Engineering
Industrial & Management Engineering fields
Okayama University Year 1999
Development of a video-rate range finder
using dynamic threshold method for
characteristic point detection
Yutaka Tanaka Akio Gofuku
Okayama University Okayama University
Nobuo Takeda Isaku Nagai
Okayama University Okayama University
This paper is posted at eScholarship@OUDIR : Okayama University Digital Information Repository.
Proceedings of the 1999 EEEJASME
lntemational Conference on Advanced Intelligent Mechatronics September 19-23, 1999 Atlanta, USA
Development of a Video-Rate Range Finder Using Dynamic Threshold Method for Characteristic Point Detection
Yutaka TANAKA*, Akio GOFUKU*, Nobuo TAKEDA**, and Isaku NAGAI*
*
Department of Systems Engineering, Okayama University 3- 1-
1 Tsushima-Naka, Okayama 700-8530, Japan**
Graduate School of Engineering, Okayama University3-1-1 Tsushima-Naka, Okayama 700-8530, Japan '
Abstract
This study develops a video-rate stereo range finding circuit to obtain the depth to objects in a scene b y processing video signals ( R , G. B, and brightness signals) from binocular, CCD cameras. The electronic circuit implements a dynamic threshold method to decrease the affection of signal noises in characteristic p o i n t s detection. where a video signal from each CCD camera is compared with multiple thresholds shifling dynamically by feeding back the previous comparison result. Several object depth measurement experiments for simple indoor scenes show that the dynamic threshold method gives high acquisition and correct rates of depth data compared with those by a fixed threshold method f o r the video signals and a relative method for R. G, and B signals utilized in the authors' previous range finders.
Key Words: Video-Rate Range Finder, Stereo Color CCD Camera, Autonomous Vehicle, Detection of Characteristic Point, Real-Time Measurement
1 Introduction
It is an important problem to develop a compact and fast range finder which can recognize objects in a scene and measure the depth of them for practical applications to robots and visual substitutes. Images from CCD cameras are commonly obtained by a frame grabber and the obtained images are processed by a computer system. Although we can apply a sophisticated algorithm for image processing, the computation speed is not so high and a vision system becomes big and expensive. Recently, DSP processors are used to realize video-rate computer vision. Kanade, et al.[l] use eight DSPs and obtain depth image of 256*240 pixels with 30 frame/sec. Other solutions to realize real-time vision are (1) to develop a vision chip to arrange small processing units between CCD cells and (2) to process image signals by an electric circuit applying. the ASIC technology. Komuro, et al. develop a very fast vision chip[2] although it can only be applied to a one-eyed vision. The authors
,
adopt the second approach to deveop a video-rate vision sys tem.
For a compact robot vision, the authors have developed several types of video-rate range finders[3,4, 51 which generate parallax signal in inverse proportion to the depth of object body surfaces by video signal processing circuits. The characteristic feature of our approach is to measure the depth of objects by electronic circuits. Therefore, the range finders can be compact and video- rate depth measurements are realized. From these advantages, the range finders are applied to autonomous running vehicles[6.7] and visual substitutes for visually impaired people[8].
In the parallax measurements, the detection of characteristic points in a scene
'7
an important problem to attain high performance (acquisition rate of depth and accurate depth measurement). In the previous range finder[3], both the brightness and its first spatial derivative of the video signals from monochrome CCD cameras were compared with fixed thresholds to detect characteristic points. Due to the noises in video signals, the depth acquisition rate was not so high even in the depth measurement of simple shape objects. To detect many characteristic points, the range finders[4. 51 used color stereo CCD cameras. The range finder[4] detected characteristic points by comparing each of R, G, and B signals with its corresponding fixed thresholds and discriminated color into 9 categories. It was also affective from signal noises, especially at the signal level near a threshold. On the other hand, the range finder[S] detected characteristic points by comparing relatively the levels of two among R, G. and B signals. The detection method is called as relative method in this paper. Although the relative method had an advantage not to require any threshold, it could not discriminated object color by its brightness.This study develops a video-rate (30 framelsec) range finder that generates 10 bits depth image of 754*483 pixels. It discriminates object color by its brightness and
color using some thresholds for R, G, B, and brightness signals. To attain high acquisition rate of depth and accurate depth measurement, the finder uses a threshold shifting method what we call dynamic threshold method. This paper describes the dynamic threshold method, construction of the 3-D range finder. This paper also dmcusses the comparison results of acquisition rate and accuracy of depth measurement with a fixed threshold method and the relative method from several distance acquisition experiments.
2
Range Finding by Dynamic Threshold
Method
2.1 Range finding using binocular cameras
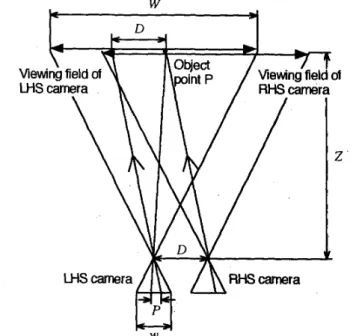
The range finding using binocular cameras utilizes the principle that an object point in a scene is observed at different position in the LHS image from the position in the RHS image. Suppose two CCD cameras are placed horizontally in parallel and synchronized as shown in Fig. 1 . In this condition, the same point appears at different horizontal positions in the same scanning line (epipolar line) of the images from the RHS and LHS cameras. The horizontal difference of positions (parallax) is in inverse proportion to the depth. In synchronous binocular cameras, the parallax is obtained as the scanning time difference of the images of an object point between the RHS and LHS cameras as shown in Fig. 2. From the observation of parallax, the depth to the point is calculated by
W
Fig. 1 Binocular cameras, visual fields and images.
Z = (D w ) I ( L Ax) (1)
where 2 depth, Ax: parallax, w: width of CCD image, L:
zoom factor (= W I
Z),
D:
base line (distance between two cameras), and W. viewing width of a CCD camera at distance 2.2.2 Detection of characteristic points by dynamic threshold method
A CCD image is scanned from top-left to bottom-right pixels along horizontal scanning lines. A characteristic point is defined as the scanned image pixel where its color changes from the color of the pixel previously scanned in the same horizontal scanning line. A pixel color is classified into categories by comparing the level of each of R, G, B, and brightness signals with its corresponding thresholds. The classified color is represented by color codes.
In the dynamic threshold method, a threshold is slightly shifted by feeding back the result of previous classification of scanned pixel color. Figure 3 shows the conception of the dynamic threshold method. In the figure, there are three base thresholds in a video signal,
Scanning line n LHS Scanning
line
n PaallaxFig. 2 Images of an object point in binocular cameras.
Color category Threshold
J
- ThA
1
Fig. 3 Dynamic threshold method.
that is ThA, ThB, and Thc. Suppose the result of initial color classification is color category 2. At the second pixel (next to the initial one), thearegion of category 2 is widen by shifting the upper threshold from the base threshold ThB to ThB+ATh and the lower threshold from
ThA to ThA-ATh. When the level of video signal increases and the result of color classification becomes category 3, the upper threshold of category 3 is shifted from Thc
to Thc+ATh and the lower one (the upper one of category 2) to ThB-ATh. At the saine time, the lower threshold of category 2 changes to ThA from ThA-ATh. The value of
ATh is determined by considering the noise level in a video signal.
By the dynamic threshold method, the color classification has hysteresis characteristic resulting in low sensitivity of signal noise. The characteristic contributes to decrease drastically the occurrence of erroneous detections of Characteristic points. As a result, the reliability to acquire color boundaries of objects increases and therefore the accuracy of depth measurement is enhanced.
2.3 Depth interpolation of a point between two characteristic points of an object
A uni-color object region has two characteristic points, that is, left and right boundaries. The depth of the left boundary is in general different from that of the right boundary. If one assumes that the surface of a uni-color object region in a scanning line between its left and right boundaries is a straight line, the depth ZX to a point
between the boundaries is given from the depths of the boundaries by the following depth interpolation as
zx
= ZL+
(ZR
-
ZL) ( x-
XL) I (XR-
XL) (2) where Z L and Z R are respectively depth of the left boundary, depth of the right boundary and x, XL, and XRare respectively horizontal coordinate in an image coordinates of the point, the left boundary, and the right boundary[9].
3 Video-rate
3-D
range finder3.1 Composition of Video-rate 3-D range finder The developed video-rate range finder is composed of binocular color CCD cameras and several sub-circuits for phase locked loop (PLL). video signal input, threshold generation, characteristic point detection, parallax measurement, and parallax output. It generates 10 bits depth image of 754*483 pixels with 30 framelsec. Figure
4 shows the block diagram of the range finder. In order to make the range finder compact. two CPLDS (Complex Programmable Logic Device) a r e used for the characteristic point detection circuit and one CPLD for the parallax measurement circuit.
3.2 Phase locked loop and video signal input circuits The previous range finders had a problem that the horizontal position of an object slightly fluctuated depending on scanning line. To solve this problem, the
Digital
parallax
Analogparallax
Fig. 4 Block diagram of video-rate 3-D range finder.newly developed range finder equips with the PLL circuit to coincide the phase between video signal and system clock for depth measurement. The circuit outputs a composite synchronization signal and clock signal of 14.3 18 MHz.
The RHS and LHS video signal input circuits change the analog video signals from binocular cameras to digital signals by 8 bits AID converters. The sampling frequency of A/D conversion is the same as the clock frequency (14.318 MHz).
3.3 Threshold generation circuit
Four thresholds are arranged in each of R, G, B, and brightness signals for characteristic points detection. The threshold generation circuit is based on a small microprocessor board. I t stores each threshold determined by a user through input buttons and outputs the threshold values to the characteristic point detection circuit through an 8 bits bus line.
3.4 Characteristic point detection circuit
The dynamic threshold method is implemented in this circuit which is composed of two CPLDs. First, the sixteen thresholds set up by the threshold generation circuit are stored in the buffer through the address decoder. A suitable threshold set is selected by the multiplexer. The selection is controlled by the output of the decoder which represents the result of the previous color classification of video signals.
3.5 Parallax measurement and D/A conversion circuits
The parallax measurement circuit counts clock pulse number corresponding to the parallax between the images of an identical characteristic point in RHS and LHS by the method explained in Section 2.1. The circuit is composed of a CPLD, an EP-ROM to configure the CPLD, and four EP-ROMs. These EP-ROMs store a look-up table for division required in the depth interpolation between left and right boundaries of an object. The inputs to the look-up table are 8 bits integers for both numerator and denominator. The output of the division is a fixed floating point number with 2 bits for integer part and 6 bits for decimal part. The output format is determined by considering the measurement range of the finder.
The D/A conversion circuit converts 10 bits digital parallax signal to an analog parallax signal. The circuit uses the clock of 14.318 MHz from the PLL circuit described in Section 3.1. The converted analog signal becomes a monochrome video signal by a video IC to
observe a parallax image in a CRT monitor.
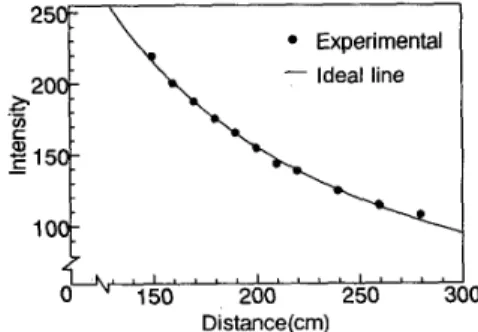
4 Depth measurement experiments 4.1 Relation between depth and parallax
The intensity of the analog parallax signal which should be in inverse proportion to the depth of an object point is measured for a rectangle object located vertically to the optical lines of the binocular cameras of the range finder. The relationship between the intensity and depth is shown in Fig. 5. The ideal line in the figure is obtained as an inverse proportion function to fit the measurement results by the least squared method. From the figure, the intensity which corresponds to parallax is correctly in inverse proportion to depth as expressed in the theoretical equation (1).
4.2 Evaluation of dynamic threshold method The applicability of the dynamic threshold method is evaluated by comparing acquisition and correct rates of depth measurement with those of both the relative method and a fixed threshold method. The base threshold set in the dynamic threshold method is the same as that of the fixed threshold method.
The acquisition rate R a is defined by
R a = N o I N a (3)
where N a and N o are total number of pixels in an image and the number of pixels which are recognized as object region. On the other hand, the correct rate Rc is defined by
Rc = N c I NO (4)
where Nc is the number of pixels which give correct depth within 5 9% error allowance.
In the target scene, there are three rectangle objects colored respectively by gray, red, and black in a white background. The depth of the gray, red, and black objects are 160,120, and 140 cm, respectively.
25T
\
Experimentald
’’
150 200 250 21 , , , , 1 , 1 1 1 1 1 . I .
Distance(cm)
Fig. 5 Relation between depth and parallax.
0
Figure 6 shows the LHS image and parallax images by the three methods. In the depth image by the relative method, the depth,images of gray and black objects do not appear. This is because the relative method does not use brightness signal for characteris tic point detection. In the depth image by the fixed threshold method, some black or white lines appear by mis-measurement of depth. The reason of the mis-measurement is incorrect detection of characteristic points resulting in the incorrect matching of characteristic points between RHS and LHS images. On the other hand, the dynamic threshold method gives
a good depth image.
Table 1 shows the comparison of the acquisition and correct rates of the three methods. From the table, the dynamic threshold method give highest acquisition rate. It also gives high correct rate almost the same as that by the relative method.
Figure 7 shows the RHS, LHS, and depth images for a Table 1 Comparison of aquisition and correct rates between three characteristic point detection methods
rate (YO) detection method
Relative method Fixed threshold method
Dynamic threshold method 93.0
(a) LHS image
(a) RHS image (b) Depth image by the relative method
(b) LHS image (c) Depth image by a fixed threshold method
(d) Depth image by the dynamic threshold method Fig. 6 Example of LHS image and depth images.
(c) Depth, image
stripe pattern. The acquisition and correct rates are 82.5 % and 83.7 %, respectively. Because the color with highest brightness is classified as the color of white background, the depth to the color region is not acquired. This is the main reason to drop the acquisition rate. This is a future problem we should improve. As obviously seen from the figure, the acquisition rate of the depth of the color region with lowest brightness (most right region of the stripe) is not so high. This is because the reflection of illumination in the LHS image differs from that of the RHS image as seen in the figure.
5 Concluding Remarks
Summarizing the results, the following conclusions are obtained:
(1) The developed range finder measures accurately the depth of objects in a scene.
(2) The developed range finder gives acquisition and correct rates of more than 90 % for a simple and conditioned scene.
(3) The dynamic threshold method gives higher acquisition and correct rates of depth data than those by the fixed threshold method.
(4) The dynamic threshold method gives higher acquisition rate and comparative correct rate compared with those by the relative method.
The developed range finder will be used as a vision system for robots and visual substitutes.
Because the present range finder has not any automatic threshold setting mechanism, its application is restricted to indoor situation where the condition of illumination is almost constant. One of future problems is to develop the mechanism in order to determine a suitable threshold set for any illumination condition of a scene.
Acknowledgments
This study is partially supported by a Research and Development Project of NEDO's District Consortium named TRIPTERS '98, 'Task diRected multIPle TransfEr Robots System".
References
[l] Kanade, T., Kano, H., Kimura, S., "Development of a Video-Rate Stereo Machine", Proc. 1995 IEEEIRSJ Int. Conf. on Intelligent Robots and Systems, Pittsburgh,
[2] Komuro, T, Ishii, I., Ishikawa, M.: Vision Chip Architecture Using General-purpose Processing Elements for l m s Vision System, P r o c . IEEE Int. Workshop o n Computer Architecture f o r Machine
USA, August, 1995, Vol. 3, pp. 95-100 (1995).
Perception, pp. 276-279 (1997).
[3] Tanaka, Y ., Nakayama, N., Goto J., "Development of High-speed 3-D Range Finder Using Binocular Cameras", Journal of Advanced Automation Technology,
[4] Tanaka, Y, Gofuku, A., Mohamed, A. : Video-rate 3-D Range Finder Using RGB-Signals from Binocular Cameras, P r o c . IASTED Int. Conf. on Mechatronics,
Hawaii, USA, August, 1996, pp. 166-168 (1996). [5] Tanaka, Y , Gofuku, A., Nagai, I.. Mohamed, A.: Development of a Compact Video-rate Range Finder and its application, P r o c . 3 r d Int. C o n f . on Advanced Mechatronics, Okayama, Japan, August, 1998, pp. 97- 102 (1998).
[6] Gofuku, A., Tanaka,
Y,
Matsuura, Y., Nagai, I.:Development of an Autonomous Running Vehicle Applying Visual Servoing, Proc. IASTED Int. Con$ on Mechatronics, Hawaii, USA, August. 1996, pp. 149-152 (1996).
[7] Gofuku, A., Tanaka, Y, Nagai, I.: A Vision-Based Autonomous Running Vehicle to Fix and Recognize Color Landmarks, P r o c . 3rd Int. Conf. on Advanced Mechatronics. Okayama, Japan, August, 1998, pp. 109- 114 (1998).
[8] Gofuku, A., Tanaka, Y, Hatayama, I.: Development of a Device Transmitting 3-D Scenery Information by Sound Signals, Trans. of the Japan Soc. of Mech. Eng.,
Vol. 63, No. 608, pp. 1243-1248 (1997) (in Japanese). [9] Tanaka, Y., Nagai, I., Gofuku, A., Miyamoto, H.: Development of a Real-time Range Finder for Measuring the Depth to a Plane without Textures, Trans. of the
Japan Soc. of Mech. Eng., (to appear, in Japanese). Vol. 7, NO. 1, pp. 66-72 (1995).