JOINT RESEARCH CENTER FOR PANEL STUDIES
DISCUSSION PAPER SERIES
DP2009-002 August, 2009
Community Rating, Cross Subsidies and Underinsurance: Why So Many
Households in Japan Do Not Purchase Earthquake Insurance
Michio Naoi* Miki Seko** Kazuto Sumita***
Abstract
A theoretical framework and empirical evidence are presented to show the connection between community uniform rating and cross-subsidies in earthquake insurance policy in Japan. Cross-subsidies are defined as the difference between a fair actuarial premium and the community uniform rate. The estimation result shows that the uniform community rating may unintentionally cross-subsidize inhabitants in high risk areas at the expense of inhabitants in low risk areas. Our simulation results indicate that replacing the current community rating with the fair actuarial premium would increase the overall subscription rate for earthquake insurance by about 3.7 percentage point, and that the increase is particularly prominent in relatively less risky areas. We propose modifying the Japanese earthquake insurance system by adopting a more refined risk rating system that more closely reflects regional differences in earthquake risk.
*Michio Naoi
Faculty of Economics, Keio University ** Miki Seko
Faculty of Economics, Keio University *** Kazuto Sumita
Department of Economics, Kanazawa Seiryo University
Joint Research Center for Panel Studies
Keio University
Community Rating, Cross Subsidies and Underinsurance: Why So Many
Households in Japan Do Not Purchase Earthquake Insurance
*First draft: April 27, 2008 / First revision: June 7, 2008
Second revision: June 29, 2008 / Third revision: October 13, 2008
Fourth revision: May 10, 2009
Michio Naoi
a, Miki Seko
b†, Kazuto Sumita
ca. Faculty of Economics, Keio University, Mita Toho Bldg. 5th Floor, 3-1-7 Mita, Minato-ku, Tokyo, 108-0073, Japan
b. Faculty of Economics, Keio University, 2-15-45 Mita, Minato-ku, Tokyo, 108-8345, Japan c. Department of Economics, Kanazawa Seiryo University, Ushi 10-1, Gosho-machi,
Kanazawa-shi, Ishikawa, 920-8620, Japan
Abstract
A theoretical framework and empirical evidence are presented to show the connection between community uniform rating and cross-subsidies in earthquake insurance policy in Japan. Cross-subsidies are defined as the difference between a fair actuarial premium and the community uniform rate. The estimation result shows that the uniform community rating may unintentionally cross-subsidize inhabitants in high risk areas at the expense of inhabitants in low risk areas. Our simulation results indicate that replacing the current community rating with the fair actuarial premium would increase the overall subscription rate for earthquake insurance by about 3.7 percentage point, and that the increase is particularly prominent in relatively less risky areas. We propose modifying the Japanese earthquake insurance system by adopting a more refined risk rating system that more closely reflects regional differences in earthquake risk.
JEL classification: D81, G22, G28, R10.
Keywords: Earthquake insurance, Cross-subsidization, Risk, Japan.
* We are grateful to the National Research Institute for Earth Science and Disaster Prevention (NIED) for
generously providing us with the data on earthquake hazard information. We also thank K. W. Chau, Dwight M. Jaffee, an anonymous referee and participants at the Asia-Pacific Real Estate Research Symposium (APRES) for their helpful comments and suggestions. The first author (Michio Naoi) acknowledges a Grant-in-Aid (#19730183) for Young Scientists (B) from the Ministry of Education, Culture, Sports, Science and Technology. Also, the second and third authors (Miki Seko and Kazuto Sumita) acknowledge a Grant-in-Aid (#19530157) for Scientific Research (C) from the Ministry of Education Culture, Sports, Science and Technology.
† Corresponding author. Email address: [email protected].
1.
Introduction
Japan is famous for its earthquakes. According to a recent survey, however, only 20% of Japanese households purchased an earthquake insurance policy in 2005. Why do so many households in Japan not purchase earthquake insurance policies given the high risk? And, what are the implications of this risky behavior?
The low subscription rates for earthquake insurance have important policy implications not only for Japan but also many other quake-prone countries.1 First, and most importantly,
uninsured victims of major earthquakes may incur severe financial and non-financial losses, which greatly influence the future well-being of these victims. Earthquake insurance can, at least partly, cover these severe losses. Second, once a massive earthquake occurs, the prevalence of uninsured individuals requires large recovery costs in the form of government grants and low-interest loans to uninsured victims that are funded by all taxpayers.
Previous studies have analyzed the incidence of underinsurance against natural disasters including earthquakes (Kunreuther, 1984). Basically earthquake insurance is fairly costly with high levels of deductions. Homeowners may be skeptical that their claims will be fully recognized and are aware of sweeping exclusions. And, if the earthquake is massive and damage is devastating, there is always the risk that payouts might be limited and delayed. Further, ex-post government grants for victims create an immense moral hazard problem in the insurance market.2 Since inhabitants in quake-prone areas expect to receive grants, compensation and low
cost loans from the local and central governments after a massive earthquake, they have little incentive to purchase insurance.
In addition to these reasons for low subscription rates, in this paper we focus on the current
1 For example, subscription rates for earthquake insurance are less than 11% in California (2000) and
19.6% in Turkey (2006). Compared with these two countries and Japan, New Zealand has a compulsory earthquake insurance system with a completely uniform premium setting.
2 This kind of moral hazard is called “charity hazard” in Browne and Hoyt (2000).
geographical risk rating in Japan’s earthquake insurance market. Because the Japanese earthquake insurance system has extremely rough and crude geographical rating categories, community uniform premiums are standardized and not linked to risk despite public perceptions that some areas are much more prone to earthquakes than others. The community uniform pricing requires cross-subsidies among individuals: individuals in risky areas will pay a premium below their actuarial value at the expense of those in less risky areas. As a result, households in less risky areas do not purchase insurance policies and customers in relatively high-risk areas purchase insurance. Thus, cross-subsidization creates a situation where only those most at risk purchase insurance.
Although there are several studies that analyze cross-subsidization in health insurance (Pupp, 1981), to the best of our knowledge there are no previous studies of cross-subsidization in earthquake insurance market. In general, catastrophes due to natural causes such as earthquakes have distinctive characteristics: they occur infrequently and are unpredictable, but can exact high costs due to their potential for devastating damage. This is the first econometric study to measure the degree and impact of cross-subsidization in earthquake insurance policy.
This paper is organized as follows: In section 2, we briefly describe the earthquake insurance system in Japan and in section 3, we briefly review the related research. In section 4, we introduce a simple theoretical model of insurance purchase under the community uniform rating and define the concept of cross-subsidization. In section 5, we discuss the data set, the estimation results on the effect of the cross subsidization and the simulation results of the elimination of the cross subsidization. Section 6 presents the conclusions.
2.
Earthquake Insurance System in Japan
In Japan, purchase of the earthquake insurance policies is voluntary, and is attached to fire insurance in general. Earthquake insurance is provided under the auspices of the government.
Private companies sell earthquake insurance, but given the enormous potential amount of claims, the Japanese government offers a reinsurance scheme and the government bears over 80 percent of the overall liability.3 So the ultimate underwriter of earthquake insurance is the government,
not private companies. Under this system, the premiums are based on the government’s regulations, not on private sector calculations.
A brief description of the Japanese earthquake insurance system is given as follows: The coverage of earthquake insurance policies is limited to buildings for residential use and household goods affected by fire, destruction, burial or flood directly or indirectly caused by an earthquake, volcanic eruptions or tsunami. Claims are adjusted based on damage assessments. If a building and/or household goods are totally destroyed the entire amount of insurance coverage is paid and if the damage is assessed at half the building and/or household goods, 50% of the insurance coverage is paid while partial losses are compensated at 5% of the insurance coverage. The limit of insurance coverage is 50 million JPY for buildings and 10 million JPY for household goods.
The potential scale of earthquake damages is so large that the government sets a limit on its reinsurance exposure. Regulations specify the obligations of private insurance companies and the government with the latter setting a limit of 5.5 trillion JPY as of September 2008 as stipulated in the Earthquake Insurance Law (see Table 1 for detail). To put this figure into context, the total claims paid out following the Kobe (Great Hanshin-Awaji) Earthquake totaled 78.3 billion JPY.4
The earthquake insurance premium standard rates are composed of a basic rate and a
3 Japan has a government-private shared policy for household risks as does California. Household risks in
Japan are all reinsured in the Japanese Earthquake Reinsurance Company (JER) where losses are shared by the insurers, the JER and the government, according to the total cost of damages. So this reinsurance scheme offered by the government serves as an effective subsidy to the private insurance companies.
4 This figure is cited from the web site of the General Insurance Association of Japan on June 7th, 2008
(http://www.sonpo.or.jp/archive/statistics/disaster/quake.html). 4
discount rate. The basic rate is set as indicated in Table 1. In case a building was constructed after June 1, 1981, a 10% discount on the cost of the premium is applied to the buildings or household goods contained therein. This discount reflects stricter building standard regulations instituted at that time. The premiums are based on the estimates of the likelihood of occurrence and the expected damages of an earthquake. The likelihood of occurrence is estimated using the records of massive earthquakes over the past 500 years. These estimates are computed at the geographical level of prefectures, and each prefecture is classified into one of the four rating zones (rank 1 (safest) to rank 4 (riskiest). See Table 1 for details). As a result, for typical housing, the insurance premiums per 100,000 JPY of coverage range from a low of 50 JPY in the safest zone to a high of 175 JPY in the riskiest zone.5 Thus for a 40 million JPY dwelling,
the annual premium could range from 20,000 to 70,000 JPY per annum.
Compared to other countries, the Japanese system is based on extremely rough and crude geographical rating categories. For example, compared with only four risk rating zones in Japan, California’s system is based on 19 risk rating zones (Jaffee and Russell, 2000).6 Japan’s crude
risk ratings significantly distort the behavior of potential insurance customers, and distort markets for earthquake insurance.
(Table 1 around here)
3.
Literature Review
In this section we briefly review the related literature of the earthquake and cross subsidization problem in the insurance market.
Naoi, Sumita and Seko (2007) implicitly showed the existence of cross-subsidization in the earthquake insurance market based on the estimated regional quality of life index (QOLI). Naoi,
5 Insurance premiums also vary according to the structure and construction method of the dwelling. 6 In October 2007, the Japanese government and the Non-Life Insurance Rating Organization of Japan
(NLIRO) released a new insurance premium policy based on a new projection of earthquake probability. However, the risk categories are still based on only four rating zones.
Seko and Sumita (2008) further examined the relationships between seismic risk and rental and owner-occupied housing prices in Japan.
Picard (2008) has theoretically investigated the role of private insurance in the prevention and mitigation of natural disasters and shown that a competitive insurance market with actuarial based rate determination and compensatory tax-subsidy transfers is better than regulated uniform insurance pricing rules or state-funded assistance schemes.
Pupp (1981) explored the inextricable connection between community rating and cross-subsidies in health insurance and estimated total, family and individual cross-subsidies based on a multivariate regression model by developing Pauly’s (1970) analysis that draws on Arrow’s (1963) findings. Our study also builds on the findings of Browne and Hoyt (2000) who estimated the demand function for flood insurance.
In this study, based on the data set used in the Naoi et al. (2007, 2008), we examine the relationship between the earthquake insurance purchasing decision and the cross-subsidies after controlling various individual and housing characteristics.
4.
The Model
In this section, we present a simple analytical framework to illustrate household’s insurance purchase decision. Previous studies have mainly focused on optimal contracts under asymmetric information in a competitive insurance market. In comparison, our primary interest in this study is on the effect of exogenous changes in insurance premium setting – actuarial and community uniform premium – on the regional disparities in earthquake insurance participation. For this purpose, we make the following assumptions: (1) the insurance premium is exogenously determined by the government regulation, and (2) both customers and insurance companies know the true risk of earthquake. The first assumption corresponds to the current Japanese situation: the premiums are based on the government’s regulations, not on the private
company’s choices.7 The second assumption implies that there is no information asymmetry in
this market. In general, individual customers can make a “preventive effort” against an earthquake, e.g., having anti-seismic reinforcement to their dwelling.8 If insurance companies
cannot observe this effort directly, adverse-selection problem would emerge (Laffont, 1989). As a practical matter, however, insurance companies can partially observe customer’s effort, since in Japan insurance premiums vary according to the quake-resistance quality of each housing unit, as well as the customer’s location.9
Suppose that there are two types of areas with differentiated risk of an earthquake. Some individuals live in high-risk areas where the probability of an earthquake is and the others live in low-risk areas where the probability is , with 0 1.
For simplicity, we assume that all individuals suffer the same loss in case of an earthquake.10 denotes their endowed income, which is the same for everybody. Earthquake
insurance contracts specify the premium and the indemnity paid in case of an earthquake , . If individuals buy earthquake insurance, they will have if no earthquake occurs and in case of an earthquake. Without insurance their income in the two states is (“no earthquake”) and (“earthquake”), respectively.
7 Rothschild and Stiglitz (1976) shows theoretically that, if insurance companies have imperfect
information about the accident probability, there will be underinsurance among low-risk customers (i.e. low-risk customers will choose partial coverage insurance, while high-risk ones will have full coverage) in a competitive insurance market with free entry.
8 Unobserved preventive effort will have important welfare implications. Leung (2001) theoretically
shows that, in a dynamic general equilibrium context, full-coverage (social) insurance will reduce the equilibrium level of labor effort and hence will reduce overall social welfare. In a dynamic political economy context, Leung et al. (2006) also show that, if individual effort can reduce the “loss” from a bad event, the intensity of such effort will crucially affect the resulting economic growth and volatility.
9 Given the rough and crude geographical rating, customers also may not know their “true risk.” In such a
situation, individuals make (and behave according to) estimates of their earthquake probabilities. In general, the resulting equilibrium will critically depend on this informational assumption. However, if low-risk customer’s (not necessarily true) estimates are actually lower than high-risk customer’s estimates, our main results remain unchanged. The authors are very grateful for the referee on this point.
10 Ehrlich and Becker (1972) examine two alternatives to market insurance: self-insurance – a reduction
in the size of a loss – and self-protection – a reduction in the probability of a loss. They show that market insurance and self-insurance are substitutes. As a result, the degree of loss after the particular earthquake would be smaller in riskier region. However, they also show that the incentive for self-insurance, compared with that for market insurance, is smaller for rare losses like earthquake.
An individual purchases an insurance contract in order to alter the pattern of income across two states. Let denote his income if there is no earthquake and his income if an earthquake occur s, and the expected utility function is given as follows:
, 1 , .
We assume that individuals are risk-averse 0 , thus , is quasi-concave. (1)
Individual demand for earthquake insurance can be derived from equation (1). A contract , determines the resulting pattern of income across two states and thus the expected
utility level, , , . From all the available contracts,
the individual chooses the one that maximizes , . He always has the option not to buy any earthquake insurance. Hence an individual will purchase insurance only if ,
, , , where W , W is the (uninsured) endowed income level in
two states.
As a benchmark, consider the case where insurance companies can offer different contracts in two areas. We assume that the insurance contract should satisfy the following expected zero-profit condition in each area:
1 , .
11
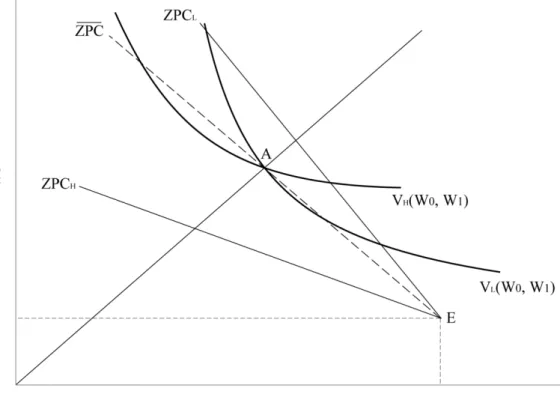
(2) Figure 1 illustrates the equilibrium outcome of this case. In Figure 1 the horizontal and vertical axes represent income in two states. The point E is the customer’s endowed income , . Zero-profit conditions given as equation (2) are shown as ZPCL and ZPCH in Figure 1, respectively.
(Figure 1 around here)
Since individuals are risk-averse, typical customer’s indifference curve must be tangent to zero-profit line at a point like AL and AH in Figure 1 (yielding equal income in both states).
8
11 In terms of , , a zero-profit condition is explicitly given as 1 0.
The following two points should be mentioned here. First, each customer buys complete (full coverage) insurance at fair actuarial premium. Since , definitions of and immediately yields in equilibrium (complete insurance). In this case, zero-profit condition (equation (2)) implies (fair actuarial premium). Second, even a risk neutral customer would purchase this contract with actuarial premiums (i.e., customers should prefer the point A to the point E regardless of their degree of risk aversion). Hence, when insurance companies can offer different contracts in low-risk and high-risk areas, every individuals purchase insurance regardless of the location.
In the above benchmark case, insurance premiums are set so as to reflect the endowed risk in each location (i.e. fair actuarial premium). However, in the current Japanese system, premium levels do not fully reflect the regional earthquake risks, and regions with different earthquake risk often have same premium level (i.e. community uniform premium).
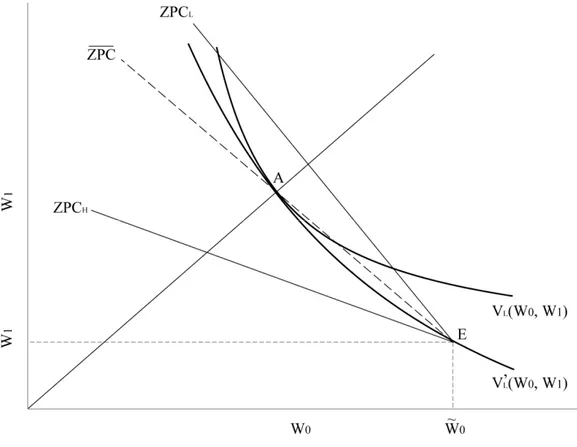
Focusing on the complete insurance case, Figure 2 illustrates the typical customer’s choice under community uniform premium.12 Suppose that the fraction of low-risk customers is .13
Then the average earthquake probability of the customers is 1 . The insurance contract, which is common to both areas, should lie on the following market zero-profit line (ZPC in Figure 2):
1 . (3)
The income pattern represented by the point A requires cross-subsidies among customers: customers in high-risk areas will pay a premium below their actuarial value at the expense of
12 Restricting customer’s choice to the complete contract is not necessary for our results here. If
customers can choose the optimal insurance contract, less risk-averse customers would prefer smaller insurance coverage. However, with a fixed loading cost, some of these customers in low-risk areas must prefer not to purchase insurance.
9
13 Note that, if some low-risk customers choose not to purchase insurance, is endogenously
determined in equilibrium. With some regularity condition on the distribution of heterogeneous customers (with respect to their degree of risk-aversion), we can show that is uniquely determined in equilibrium.
those in low- risk areas.14 The uniform premium should be . Compared with actuarial premiums, should be somewhere between and (i.e. ). The per-capita subsidy for the customers in high-risk areas is defined as and the per-capita tax for those in low-risk areas is .
(Figure 2 around here)
As shown in the benchmark case, actuarially fair premium setting predicts every individuals, regardless of their location, purchase insurance. In contrast, the premium setting that is constant across regions predicts that not all individuals in low-risk areas purchase insurance. Figure 3 shows that the low-risk customer who has a flatter indifference curve (i.e., less risk-averse) will be indifferent between complete insurance (the point A) and the endowed income without any insurance (the point E). Hence individuals who are less risk-averse than this marginal customer would not purchase insurance. In comparison, individuals in high-risk areas always purchase insurance regardless of their degree of risk aversion.
(Figure 3 around here)
Figure 3 also indicates that larger cross-subsidies across regions lead to fewer insurance purchase in low-risk areas. For example, holding other factors constant, higher earthquake probability in high-risk areas should be associated with higher average earthquake probability . This immediately leads to higher uniform premium and larger per-capita cross-taxes in low-risk areas. At the same time, since higher makes the market zero-profit line ZPC flatter, this results in lower subscription rate in low-risk areas.15 In the following
14 In a competitive market without any government regulations, cross-subsidization would disappear
through cream skimming. Because a firm can earn positive profit by offering low-risk customers (who are paying a premium above their actuarial value) a cheaper insurance, cream skimming leads to separating equilibria in which different types of customers purchase different contracts (Rothschild and Stiglitz, 1976).
15 In this model, we do not allow individuals to move across regions. Allowing for individual mobility
empirical section, we directly test this hypothesis using most recently available dataset of Japanese households.16
5.
Estimation
5.1 Data
The Keio Household Panel Survey (KHPS), sponsored by the Ministry of Education, Culture, Sports, Science and Technology, is the first comprehensive panel survey of households in Japan, conducted annually by Keio University since 2004. In the KHPS, we can use not only basic information about respondent’s social and demographic characteristics, but also information regarding their residential locations and purchases of earthquake insurance policies. In the first wave, self-administered questionnaires were given to 4,005 respondents, male and female, aged 20-69 years. These respondents were selected by stratified two-stage random sampling. In the following analysis, five waves of the KHPS (2004–2008) are utilized to examine the household’s insurance purchase decision, with special emphasis on the effect of cross-subsidization across regions.
In addition to the KHPS, the fair actuarial premium and the resulting cross-subsidies are calculated based on the objective estimates of earthquake probability. The earthquake probability measure is taken from the Probabilistic Seismic Hazard Map (PSHM) provided by the National Research Institute for Earth Science and Disaster Prevention (NIED).17 The PSHM
provides the probability of earthquake occurrence for the likely range of seismic intensity. In the with certain costs may yields similar results, and is an interesting direction for future extension. Picard (2008) presents a model with individual mobility, but in that insurance purchase is compulsory.
16 Moreover, since a part of individuals in less risky areas do not purchase insurance policies and
customers in high-risk areas still stay in the market, uniform pricing raises the overall cost of earthquake insurance: this further makes inhabitants in low-risk areas reluctant to protect themselves against earthquakes through the purchase of insurance policies.
17 The original PSHM data is provided as the ESRI grid format, where grid cells are defined as
geographic space of equally sized square grid points. The PSHM data gives the earthquake probabilities for every 1km×1km grid cells all over Japan. In the following analysis, we aggregate the original data and construct the city-level averages in order to match the PSHM probability with the KHPS. The original data is available at http://www.j-shis.bosai.go.jp/.
following analysis, we use the occurrence probability of earthquakes with ground motions equal to or larger than JMA seismic intensity 6 within 30 years.18 Probability of earthquake
occurrence obtained from the PSHM is summarized in Figure 4. (Figure 4 around here)
Based on the PSHM 30-years probability described above, we calculate the annualized probability of earthquake occurrence as 1 1 / .19 We assume that
the earthquake probability taken from the PSHM is the proxy for the true risk of earthquakes and calculate the fair actuarial premium based on the PSHM earthquake occurrence probability.20 For an indemnity of 10 million JPY, the fair actuarial premium is calculated as
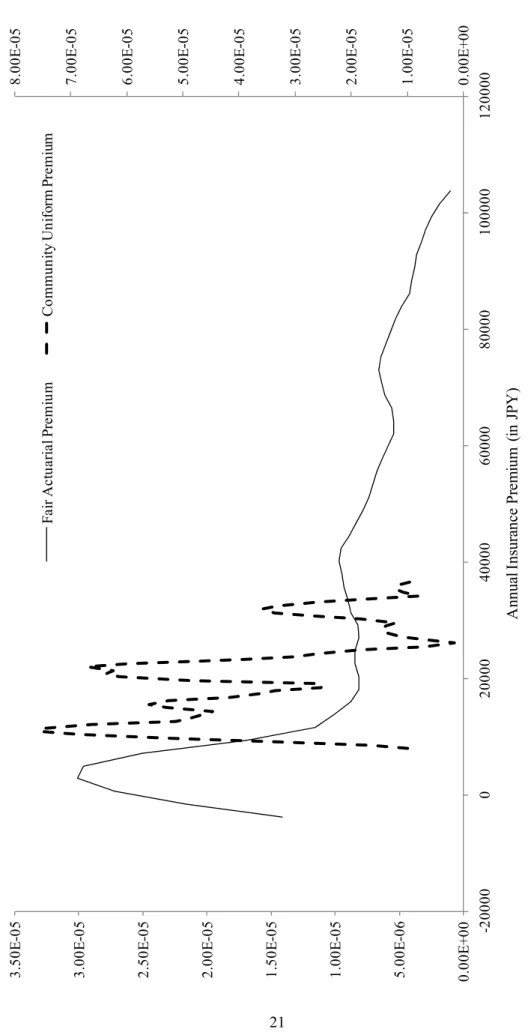
10,000,000. In the following analysis the fair actuarial premium is adjusted so that it has the same sample mean as the observed community rate.21 The distribution of unadjusted
actuarial premium and that of observed community uniform premium are shown in Figure 5. Figure 5 indicates that the calculated actuarial premium is unevenly distributed across regions, while the community premium is centered around its mean. It also suggests that, due to the extremely high levels of actuarial premium in some regions, the average actuarial values are somewhat higher than the observed community rates.
(Figure 5 around here)
18 The Japan Meteorological Agency (JMA) seismic intensity scale, which is measured with a seismic
intensity meter, and is graded from 0 to 7, provides a measure of the strength of seismic motion. For full explanation of the JMA seismic intensity scale, see http://www.jma.go.jp/jma/kishou/know/shindo/ explane.html. In general, the relationship between the JMA scale and the Richter scale depends on a distance from the epicenter. Even an earthquake with a small intensity on the Richter scale can have a large JMA intensity at location ns ear the epicenter.
19 Assuming that the earthquake probabilities are constant over time, and must satisfy the
following relationship. ∑ 1 . This yields our measure of annualized earthquake probability.
20 In our recent paper, we carefully examine the empirical validity of this assumption, and find that the
bias stemming from the use of objective PSHM probability as a proxy for individual risk assessments is almost negligible (Naoi et al., 2008).
21 Since the actual insurance contracts have high levels of deductions (3% of property value), and a total
claim payment limit (5.5 trillion JPY), the average premiums of actual contracts tend to be lower than actuarial ones. In consideration of these factors, the actuarial premium is adjusted to have the same sample mean as the observed community rate.
Observed community uniform premiums are based on NLIRO insurance rates for wooden housing without any anti-seismic construction method. As explained in Section 2, community rates are set at the geographical level of prefectures, and each prefecture is classified into one of the four rating zones. In the following analysis, we use the insurance premiums per 10 million JPY of coverage, which range from a low of 12 thousand JPY in the safest zone to a high of 35.5 thousand JPY in the riskiest zone.22 Premium discounts for a building constructed under
the stricter building code and for long-term contracts are also applied to the above basic rates. Finally, we define the cross-subsidization as the difference between the fair actuarial
premium and the observed community rate , . Clearly, since the
actuarial premium is directly linked to the PSHM probability, risky areas will have a subsidized uniform premium with 0 and less risky areas will have taxed premium with 0. Our theoretical prediction suggests that larger cross-subsidies across regions (i.e. larger negative values of ) lead to fewer insurance purchase in low-risk areas. Hence we expect that has positive impact on the household insurance purchase decision. Further, because the model also predicts that cross-subsidies do not have any impact on the insurance purchase in high-risk areas, we also define the modified cross-subsidization measure which equals to
if and 0 otherwise.
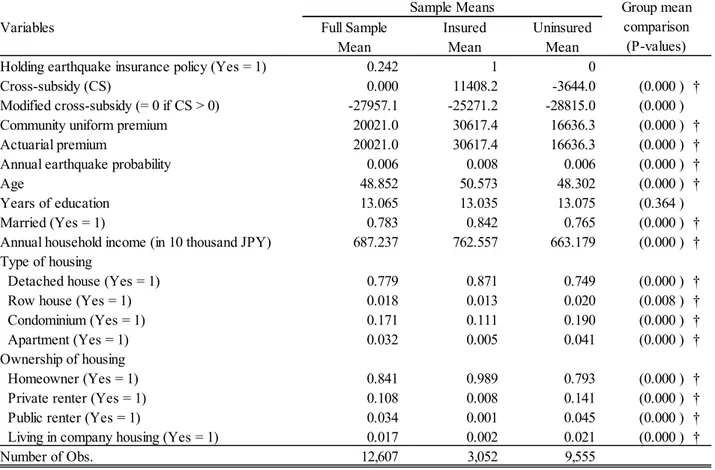
Table 2 presents definitions and summary statistics of main variables used in our statistical analysis. It also provides sample means of variables both for insured and uninsured households. A simple t-test of sample means (“Group Mean Comparison”) shows that there is significant difference in measured cross-subsidies between insured and uninsured households. While insured households tend to pay a subsidized premium below their actuarial value (i.e., 0),
22 These basic rates are as of September, 2007. As explained in footnote 5, NLIRO released a new
insurance premium policy in October, 2007. To check whether this policy change has any influence on our empirical results, we estimated the model without 2008 sample, and found that there are no fundamental changes in our estimates.
uninsured households face taxed premium higher than their actuarial value (i.e., 0). (Table 2 around here)
5.2 Estimation Results
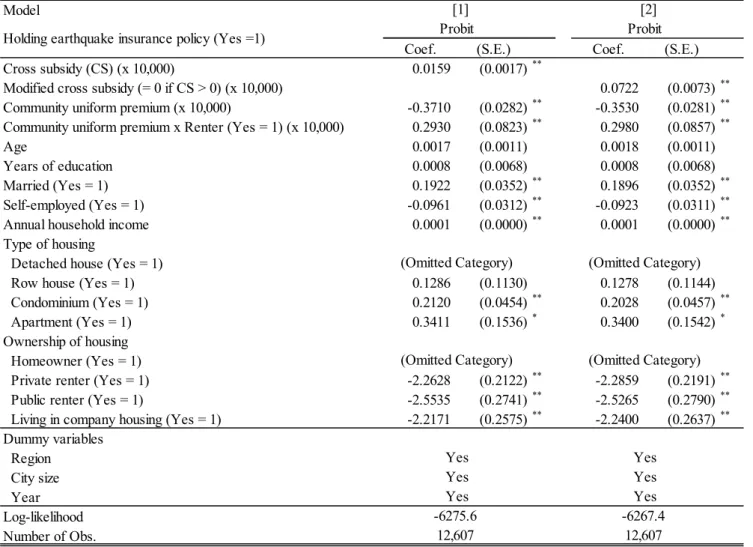
In order to test the effect of cross-subsidization on the purchase of earthquake insurance, we estimate the binary probit model. We use the cross-subsidization variable and its modified version to measure the extent of cross-subsidization. If cross-subsidization really matters, the coefficients of and are expected to show a positive impact. For the cost variable, we use the observed community rates. The coefficient of this variable is expected to show a negative impact.
Except for cross-subsidy measures and insurance premiums, variables related to respondent and housing characteristics are included in our model. For the respondent characteristics, the following variables are used: age, years of education, marital status (married = 1) and annual household income. For the housing characteristics and other control variables, the following categorical dummies are included: building type of housing, ownership of housing, size of city and region in which respondent resides, and dummies for survey years.
Table 3 presents the probit results of a household’s insurance purchase. The dependent variable is one if the household buys an earthquake insurance policy. The coefficient of is found to be positive and significant (Model [1]). This indicates that in the Japanese earthquake insurance market, cross-subsidies across areas discourage inhabitants in low-risk areas from purchasing insurance policies, as our model predicts. The coefficient of the community uniform rate is negative and significant as expected. For renter households, we also find that the price effect is largely attenuated (i.e., the interaction term between renter dummy and community uniform rate has significantly positive impact on their insurance purchase). This may attribute to the limited coverage of insurance for renter households: the coverage of earthquake insurance
policies is limited to household goods for renter households, while for homeowners insurance covers buildings for residential use as well.23
Further, since the effect of cross-subsidization might be asymmetric between subsidized regions 0 and taxed regions 0 , we estimate the model with the modified cross-subsidization measure in Model [2]. The result also indicates that the cross-taxes in low-risk areas (i.e. the larger negative values of ) lead to underinsurance in these areas. But in this case the estimated coefficient of is much larger than that of in Model [1], which is consistent with our prediction that the cross-subsidization does not matter in high-risk areas.
(Table 3 around here)
As for the building type of housing, the coefficient of condominium shows a positively significant impact. This is because condominiums, especially in tall buildings, tend to suffer larger damages than detached housing. Regarding the regional dummies, Kanto, Chubu and Chugoku area dummies show a positively significant impact (results not shown). These regional dummies would capture regional economic conditions or the effects of region-specific environments.
Since the household decision to purchase earthquake insurance is likely to be influenced by unobserved heterogeneity such as attitudes toward risk, we have also estimated the model by the random-effect probit. The results, however, show qualitatively similar estimated coefficients. Notably, the coefficients of the and show the same positive sign with the probit estimate (Models [3] and [4]).
5.3 Simulation
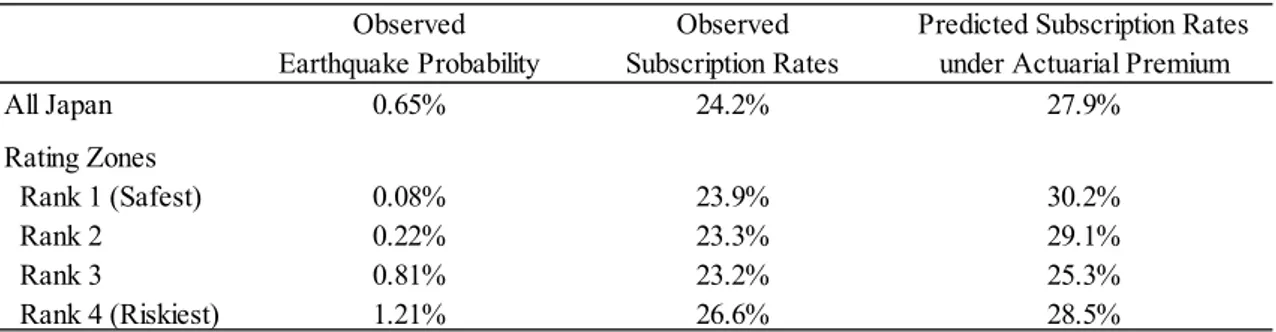
To examine the effect of cross-subsidization on the overall subscription rates for earthquake
23 We also examined the differential effect of our cross-subsidization variable between homeowners and
renter households, but find no significant difference between these two groups. 15
insurance, Table 4 illustrates the simulation results based on the probit model presented in the previous section (Model [2]). The first column shows the observed PSHM earthquake probability. The second column (“observed subscription rates”) shows the observed proportion of households holding insurance policies in the KHPS. The third column (“subscription rates under actuarial premium”), calculated from our estimation result, shows the predicted probability of holding insurance policies under the actuarial premium without any cross-subsidization.
(Table 4 around here)
The predicted probabilities are obtained by using actuarial premiums instead of observed ones, and setting 0 in Model [2] presented in Table 3. As a result, the observed subscription rate of 24.2% is considerably increased under the actuarial premium without any cross-subsidization to 27.9%. Furthermore, increases in the subscription rates are particularly prominent in regions with low earthquake risk, which is also consistent with our theoretical prediction. The increase in the subscription rate ranges from 1.9 percentage point in the riskiest prefectures (rank 4) to 6.3 percentage point in the least risky prefectures (rank 1).
6.
Conclusion
The reason why so many Japanese households do not purchase earthquake insurance is because it is too expensive. For those who face relatively less risk, the community uniform pricing system inflates premiums. For those who are at high risk, the absolute high cost of insurance ensures that many who ought to buy insurance tend not to. Even if people are risk averse, catastrophic earthquakes are rare events, even in Japan, and thus many people take their chances and save a lot on premiums.
A theoretical model is presented to show the connection between community uniform rating and cross-subsidies in earthquake insurance policy in Japan. Cross-subsidies are defined
as the difference between a fair actuarial premium and the community uniform rate. The estimation results show that the uniform community rating may unintentionally cross-subsidize inhabitants in high risk areas at the expense of inhabitants in low risk areas. That is, the current Japanese earthquake insurance system actually lowers overall subscription rates, although policy makers are seemingly unaware that this is the case. Our simulation results indicate that replacing the current community rating with the fair actuarial premium would increase the overall subscription rate for earthquake insurance by about 3.7 percentage point, and that the increase is particularly prominent in relatively less risky areas. We propose modifying the Japanese earthquake insurance system by adopting a more refined risk rating system that more closely reflects regional differences in earthquake risk and set premiums accordingly.
References
[1] Arrow, K. (1963), “Uncertainty and the Welfare Economics of Medical Care,” American Economic Review, 53(5), pp.941-973.
[2] Browne, M.J. and R.E. Hoyt (2000), “The Demand for Flood Insurance: Empirical Evidence,” Journal of Risk and Uncertainty, 20(3), pp.291-306.
[3] Ehrlich, I. and G.S. Becker (1972), “Market Insurance, Self-Insurance, and Self-Protection,” Journal of Political Economy, 80(4), pp.623-648.
[4] Jaffee, D.M. and Russel, T. (2000), “Behavioral models of insurance: The case of the California Earthquake Authority,” Paper presented at the NBER Insurance Project Workshop.
[5] Kunreuther, H. (1984), “Causes of Underinsurance against Natural Disasters,” Geneva Papers on Risk and Insurance, 9(31), pp.206-220.
[6] Laffont, J.J. (1989), The Economics of Uncertainty and Information, Cambridge, MA: MIT Press.
[7] Leung, C.K.Y. (2001), “Productivity Growth, Increasing Income Inequality and Social Insurance: The Case of China?,” Journal of Economic Behavior and Organization, 46(6), pp.395-408.
[8] Leung, C.K.Y., S.H.K. Tang and N. Groenewold (2006), “Growth Volatility and Technical Progress: A Simple Rent-Seeking Model,” Journal of Economics (Zeitschrift für Nationalökonomie), 88(2), pp.159-178.
[9] Naoi, M., K. Sumita and M. Seko (2007), “Earthquakes and the Quality of Life in Japan,” Journal of Property Research, 24(4). pp.313-334.
[10] Naoi, M., M. Seko and K. Sumita (2008), “Earthquake Risk and Housing Prices in Japan: Evidence Before and After Massive Earthquakes,” Paper presented at the Macroeconomics, Real Estate, and Public Policy workshop in Istanbul, Turkey, July, 2008.
[11] Pauly, M.V. (1970), “The Welfare Economics of Community Rating,” Journal of Risk and Insurance, 37(2), pp.407-418.
[12] Picard, P. (2008), “Natural Disaster Insurance and the Equity-Efficiency Trade-Off,” Journal of Risk and Insurance, 75(1), pp.17-38.
[13] Pupp, R.L. (1981), “Community Rating and Cross-Subsidization in Health Insurance,” Journal of Risk and Insurance, 48(4), pp.610-627.
[14] Rothschild, M. and J. Stiglitz (1976), “Equilibrium in Competitive Insurance Markets: An Essay on the Economics of Imperfect Information,” Quarterly Journal of Economics, 90(4), pp.629-649.
Figure 1: Insurance Demand under Fair Actuarial Premium
Figure 2: Insurance Demand under Community Uniform Premium
Figure 3: Insurance Demand and Degree of Risk Aversion
Figure 4: Earthquake Occurrence Probability by Prefecture
0. 00 E +00 1. 00 E -05 2 E -05 3 E -05 4 E -05 5 E -05 6 E -05 7 E -05 8 E -05 0. 00 E +00 5. 00 E -06 1. 00 E -05 1. 50 E -05 2. 00 E -05 2. 50 E -05 3. 00 E -05 3. 50 E -05 -2 00 00 0 200 00 40 00 0 600 00 8000 0 100 00 0 120 000 A nn ual I ns ur an ce P re m iu m ( in JP Y )
F
ig
ure
5
: D
is
tr
ib
utio
n
of
F
air
A
ctu
ar
ia
l
P
re
m
iu
m
a
nd
C
om
m
un
ity
U
nifo
rm
P
re
m
iu
m
.00 .00 .00 .00 .00 .00 .00 Fa ir A ctu ar ia l P re m iu m C om m un ity U nif or m P re m iu m No te s: P re m iu m d is co un ts f or a b uild in g c on str uc te d u nd er th e s tr ic te r b uild in g c od e a nd f or lo ng -t er m c on tr ac ts a re a pp lie d to c om m un ity un if orm ra te s. O bs er vat io ns w ith ca lcu lat ed ac tu ar ial v al ue s ab ov e 1 00 ,0 00 J PY ar e ex cl ud ed . E st ima ted k er ne l d en si ties f or ac tu ar ia l an d u ni for m p re m iu m s a re sh ow n o n th e le ft an d r ig ht a xis , r es pe ctiv ely . 21Table 1: Earthquake Insurance System in Japan
Details
Coverage Buildings for residential use and household goods
Risk cove re d Earthquake, volcanic eruptions and tsunami
Coverage conditions
(% paid for the amount insured) Buildings and household goods: total loss (100%) / half loss (50%) / partial loss (5%)
Limit of insurable amount Buildings: 50 million yen
Household goods: 10 million yen
Participation me thod Attached to the fire insurance
Limit of total payme nt 5.5 trillion yen for a single earthquake
Pre mium
(per 1,000 yen amount insured) Rank 1: safest
Rank 4: riskiest
Rank 1: 0.50 (non-wooden building) / 1.20 (wooden building) Rank 2: 0.70 / 1.65
Rank 3: 1.35 / 2.35 Rank 4: 1.75 / 3.55
Pre mium discounts New building code discount: 10% discount for buildings constructed after June 1, 1981
Rating method Based on the estimates of the likelihood of occurrence and the expected damages of
an earthquake
Risk rating me thod Based on the records of massive earthquakes over the past 506 years
Class location
Rank 1: Hokkaido, Fukushima, Shimane, Okayama, Hiroshima, Yamaguchi, Kagawa, Fukuoka, Saga, Kagoshima, Okinawa
Rank 2: Aomori, Iwate, Miyagi, Akita, Yamagata, Ibaragi, Tochigi, Gunma, Niigata, Toyama, Ishikawa, Yamanashi, Tottori, Tokushima, Ehime, Kochi, Nagasaki, Kumamoto, Oita, Miyazaki
Rank 3: Saitama, Chiba, Fukui, Nagano, Gifu, Aichi, Mie, Shiga, Kyoto, Osaka, Hyogo, Nara, Wakayama
Rank 4: Tokyo, Kanagawa, Shizuoka
Re insurance sche me
Notes : In October 2007, the Japanese government and the Non-Life Insurance Rating Organization of Japan (NLIRO) released a new
insurance premium policy based on a new projection of earthquake probability. Above explanations for premium rating and class location are as of September 2007.
Total Payment Claim
Liability of insurance co.
Liability of government
110bil. 1.73tril. 5.5tril.
5% 50% 100%
Table 2: Summary Statistics
Variables Full Sample Insured Uninsured
Mean Mean Mean
Holding earthquake insurance policy (Yes = 1) 0.242 1 0
Cross-subsidy (CS) 0.000 11408.2 -3644.0 (0.000 ) †
Modified cross-subsidy (= 0 if CS > 0) -27957.1 -25271.2 -28815.0 (0.000 )
Community uniform premium 20021.0 30617.4 16636.3 (0.000 ) †
Actuarial premium 20021.0 30617.4 16636.3 (0.000 ) †
Annual earthquake probability 0.006 0.008 0.006 (0.000 ) †
Age 48.852 50.573 48.302 (0.000 ) †
Years of education 13.065 13.035 13.075 (0.364 )
Married (Yes = 1) 0.783 0.842 0.765 (0.000 ) †
Annual household income (in 10 thousand JPY) 687.237 762.557 663.179 (0.000 ) † Type of housing
Detached house (Yes = 1) 0.779 0.871 0.749 (0.000 ) †
Row house (Yes = 1) 0.018 0.013 0.020 (0.008 ) †
Condominium (Yes = 1) 0.171 0.111 0.190 (0.000 ) †
Apartment (Yes = 1) 0.032 0.005 0.041 (0.000 ) †
Ownership of housing
Homeowner (Yes = 1) 0.841 0.989 0.793 (0.000 ) †
Private renter (Yes = 1) 0.108 0.008 0.141 (0.000 ) †
Public renter (Yes = 1) 0.034 0.001 0.045 (0.000 ) †
Living in company housing (Yes = 1) 0.017 0.002 0.021 (0.000 ) †
Number of Obs. 12,607 3,052 9,555
Notes : The actuarial premium is normalized to have same sample average as the observed premium. “ Group mean comparison ”
represents p-value of paired t-test of equal means between insured and uninsured. If the two means have different variances, the test is conducted using Welch’s approximation. † indicates that two sample means have different variances.
Sample Means Group mean
comparison (P-values)
Table 3: Probit Models of Earthquake Insurance Purchase
Model
Coef. (S.E.) Coef. (S.E.)
Cross subsidy (CS) (x 10,000) 0.0159 (0.0017)**
Modified cross subsidy (= 0 if CS > 0) (x 10,000) 0.0722 (0.0073)**
Community uniform premium (x 10,000) -0.3710 (0.0282)** -0.3530 (0.0281)**
Community uniform premium x Renter (Yes = 1) (x 10,000) 0.2930 (0.0823)** 0.2980 (0.0857)**
Age 0.0017 (0.0011) 0.0018 (0.0011)
Years of education 0.0008 (0.0068) 0.0008 (0.0068)
Married (Yes = 1) 0.1922 (0.0352)** 0.1896 (0.0352)**
Self-employed (Yes = 1) -0.0961 (0.0312)** -0.0923 (0.0311)**
Annual household income 0.0001 (0.0000)** 0.0001 (0.0000)**
Type of housing
Detached house (Yes = 1)
Row house (Yes = 1) 0.1286 (0.1130) 0.1278 (0.1144)
Condominium (Yes = 1) 0.2120 (0.0454)** 0.2028 (0.0457)**
Apartment (Yes = 1) 0.3411 (0.1536)* 0.3400 (0.1542)*
Ownership of housing Homeowner (Yes = 1)
Private renter (Yes = 1) -2.2628 (0.2122)** -2.2859 (0.2191)**
Public renter (Yes = 1) -2.5535 (0.2741)** -2.5265 (0.2790)**
Living in company housing (Yes = 1) -2.2171 (0.2575)** -2.2400 (0.2637)**
Dummy variables Region City size Year Log-likelihood Number of Obs.
Notes : Robust standard errors are reported for probit models. **: significant at 1%, *: significant at 5%, +: significant at 10%.
-6275.6 -6267.4
12,607 12,607
Holding earthquake insurance policy (Yes =1)
(Omitted Category) (Omitted Category)
(Omitted Category) (Omitted Category) Yes Yes Yes Yes [1] [2] Probit Probit Yes Yes 24
Table 3: Probit Models of Earthquake Insurance Purchase (Continued)
Model
Coef. (S.E.) Coef. (S.E.)
Cross subsidy (CS) (x 10,000) 0.0365 (0.0074)**
Modified cross subsidy (= 0 if CS > 0) (x 10,000) 0.1450 (0.0312)**
Community uniform premium (x 10,000) -0.8680 (0.1040)** -0.8060 (0.1000)**
Community uniform premium x Renter (Yes = 1) (x 10,000) 0.7380 (0.2290)** 0.7410 (0.2290)**
Age 0.0042 (0.0050) 0.0042 (0.0050)
Years of education 0.0095 (0.0298) 0.0086 (0.0298)
Married (Yes = 1) 0.4493 (0.1425)** 0.4447 (0.1424)**
Self-employed (Yes = 1) -0.0715 (0.1030) -0.0628 (0.1029)
Annual household income 0.0002 (0.0001)** 0.0002 (0.0001)*
Type of housing
Detached house (Yes = 1)
Row house (Yes = 1) 0.5719 (0.4526) 0.5531 (0.4513)
Condominium (Yes = 1) 0.3552 (0.1863)+ 0.3337 (0.1864)+
Apartment (Yes = 1) 0.5281 (0.4367) 0.5156 (0.4372)
Ownership of housing Homeowner (Yes = 1)
Private renter (Yes = 1) -4.9222 (0.5694)** -4.9491 (0.5707)**
Public renter (Yes = 1) -5.4469 (0.6924)** -5.3390 (0.6866)**
Living in company housing (Yes = 1) -4.5310 (0.6884)** -4.5446 (0.6922)**
Variance of random effects (σ2): 2.6527 (0.0569) 2.6492 (0.0570)
ρ = σ2/ (σ2 + 1) 0.8756 (0.0047)‡ 0.8753 (0.0047)‡ Dummy variables Region City size Year Log-likelihood Number of Obs. Yes Yes Yes Yes Yes Yes
Notes : **: significant at 1%, *: significant at 5%, +: significant at 10%. σ2represents the random-effect variance component and ρ represents
the proportion of the total variance contributed by the random-effect variance component. ‡ indicates that the likelihood-ratio test of ρ = 0 is rejected at 1% significance level.
-3628.2 -3629.4
12,607 12,607
Holding earthquake insurance policy (Yes =1)
(Omitted Category)
(Omitted Category)
(Omitted Category)
[3] [4]
Random-effect Probit Random-effect Probit
(Omitted Category)
Table 4: Simulation Results – Subscription Rates under Actuarial Premium
Observed Earthquake Probability
Observed Subscription Rates
Predicted Subscription Rates under Actuarial Premium
All Japan 0.65% 24.2% 27.9% Rating Zones Rank 1 (Safest) 0.08% 23.9% 30.2% Rank 2 0.22% 23.3% 29.1% Rank 3 0.81% 23.2% 25.3% Rank 4 (Riskiest) 1.21% 26.6% 28.5%
Notes : Simulation results are based on Model [2] estimates presented in Table 3.