26 2014.04 日立評論
Th
e Role of Geospatial Technologies
in Social Innovation
社会イノベーションを加速するグローバル
IT
ソリューションfeature articles
Bahadir Gultekin, PhD. Michihiro Tsuda
Location matters to our quality of life, and geospatial technologies such as GIS, and satellite imagery provide us with a valuable capability to analyze and understand the relationship between location and our environment, which the authors see as the essence of Hitachi s social innovation concept. Utilization of geospatial technologies leads to better planning and more effi cient implementation of energy distribution; more reliable and environmentally conscious agriculture; and faster
and smoother traffi c. This article summarizes Hitachi Solutions, Ltd. s geospatial technologies and various implementations especially in the urban infrastructure sector. These implementations cover asset and facility management in the power and gas distribution sector. Also, agricultural information systems such as fi eld and soil management, fertilizer design, and remote sensing are explained. Finally, the article summarizes efforts towards globalizing Hitachi s geospatial technologies.
1. INTRODUCTION
HITACHI describes its Social Innovation Business as providing total solutions for sustainable urban develop-ment worldwide, with the role of addressing critical global issues such as the need for creating and improving the transportation infrastructure in urban areas, improving access to clean water, developing technologies that promote a smooth and effi cient transition to the smart grid while keeping a sharp eye on sustainability objectives and the conservation of our world’s supply of precious natural resources(¹). Providing total solutions in the urban infrastructure sector is at the heart of this concept because the quality of urban infrastructure is the defi ning indicator for the quality of life of the citizens in that urban environment. Utilization of geospatial technologies based on geographical information systems (GIS) provides a unique key to the overall scheme of social innovation. Th ey provide a location-based common platform where all social innovation technologies can be gathered, analyzed, and displayed in a visual and easy-to-comprehend manner on maps, or on satellite images. Th is article summarizes Hitachi’s geospatial technologies and implementations, especially in the urban infrastructure sector. Th ese
implementations cover asset and facility management in the power, gas, and water distribution sector. Th e usage of geospatial technologies in these sectors are explained, together with how they help clients to regulate their business processes for higher effi ciency and cost eff ectiveness. Moreover, agricultural information systems such as fi eld and soil management, fertilizer design, remote sensing, and traceability are explained.
Th e fi nal section summarizes eff orts being made to globalize our geospatial technologies.
2. GEOSPATIAL TECHNOLOGIES
Th ere are various descriptions and defi nitions of geospatial technologies in the literature and Internet. Geospatial technologies have three components, the fi rst of which is GIS. Th e Geospatial Information Authority of Japan (Ministry of Land, Infrastructure, Transport and Tourism) has a very comprehensive defi nition for this technology: “GIS is a technology that supports the integrated management and processing, visual display, sophisticated analysis, and rapid evaluation of data containing location-dependent information (spatial data) based on geographic position.”(²) Th e second component
27
featur
e ar
ticles
Vol.96 No.04 256–257 社会イノベーションを加速するグローバルITソリューション is the tools to provide the data for this technology, such as
satellite images, maps, and global positioning systems (GPS). Th e third and fi nal component is the applications that are developed on these two components, and which show interrelations between data in the location dimension that would not be evident if the data were managed in traditional formats, such as alphabetically, in arbitrary groups, or in ledger format (see Fig. 1). Some examples of these applications are facility/asset management systems, energy and/or water distribution network models, and agriculture information management systems. It is possible to increase the number of these applications, but this article will focus on these ones, only.
3. UTILIZATION OF GEOSPATIAL TECHNOLOGIES IN URBAN INFRASTRUCTURE SECTOR
3.1 Facility/Asset Management in Power Distribution Th e biggest investment of power distribution companies is in their assets. Th e biggest challenge faced by power distribution companies is to increase the stability and quality of electric power while decreasing operational costs. Th ey need to accomplish this task despite the ongoing depreciation of their assets because of asset aging. Th is is only possible if they can establish an effi cient equipment repair cycle and furthermore an eff ective maintenance cycle that will prevent accidents and failures before they occur. Th is is only possible if they can capture real fi eld information related to asset condition (see Fig. 2).
Th e following is made possible by utilizing the geospatial technologies for facility management.
• As the locations of the assets are known, it is possible to create a hierarchical data model. For example, a power pole can be the origin asset, and the insulators or other equipment on the pole can be related to this pole (parent-child relationship).
• It is possible to create a network structure as the
locations and hierarchy of assets in the grid are already known. In this way it is possible to estimate the area aff ected by a failure or accident by tracing it along the distribution network (upstream for the source of trouble or downstream for the aff ected area).
• It is also possible to use various spatial analyses, such as area analysis and failure/cause and eff ect analysis, to defi ne and estimate the possible risk areas and to identify areas and assets that have high priority for maintenance.
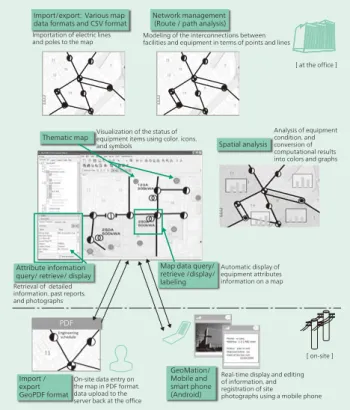
As can be seen from the system image in Fig. 2, it is also possible to use mobile technologies with GPS capabilities. Th e system can be used for customer support, accident support, and task checking by exchanging information between staff managers and fi eld workers. Th is leads to better customer service through the quick and accurate response to customer complaints or accidents using mobile technology. Also, it improves effi ciency in the fi eld by viewing detail information on the current staff and status of utilities from mobile phones or tablets.
Th e facility/asset management system can also be used for gas utility companies, and our dedicated software application is currently running in more than 12 gas utility
Import/export: Various map data formats and CSV format
Import / export GeoPDF format GeoMation/ Mobile and smart phone (Android) Thematic map Spatial analysis Importation of electric lines
and poles to the map
Visualization of the status of equipment items using color, icons, and symbols
Retrieval of detailed information, past reports, and photographs
On-site data entry on the map in PDF format, data upload to the server back at the office
Real-time display and editing of information, and registration of site photographs using a mobile phone Automatic display of equipment attributes information on a map Analysis of equipment condition, and conversion of computational results into colors and graphs Network management
(Route / path analysis) Modeling of the interconnections between facilities and equipment in terms of points and lines
[ at the office ]
[ on-site ] Attribute information
query/ retrieve/ display
Map data query/ retrieve /display/ labeling
Fig. 2│Image of Facility/Asset Management System for Power Distribution Sector.
Geospatial technologies allow the user to manage their assets at the enterprise level.
MAP
Managing separate information resources using various systems
Integrating data on maps for visualization
Hitachi Solutions Geographical Information System
Revealing previously undetected trends and pattern in the existing information
MAP
Fig. 1│Visualization of Interrelation between Data.
Geospatial technologies allow users to detect trends and patterns in the data, which are difficult to detect when using traditional management methods.
28 2014.04 日立評論
companies.
3.2 Agricultural Information Management System Hitachi Solutions has been developing and enhancing its agricultural solutions since 2004, and these have been adopted by approximately 50 agricultural cooperatives and other organizations, mainly in Japan.
Th e same principle applies in the agriculture sector as in other sectors. Farmers have to increase their effi ciency while decreasing their operating costs. However, there is another dimension in agriculture which is the environmental burden that fertilizers impose on farming fi elds. Th is agricultural information management system provides various tools not only to estimate the best harvest time, operate the agricultural machinery effi ciently, and optimize the farming work, but also to generate solutions and/or advice for farmers on how to use fertilizers or agricultural chemicals. Th is leads to more effi cient farm practice as well as less burden on the environment (see
Fig. 3)(³).
Also, when it comes to agricultural practices, another very important aspect is the safety and security of the food. Registering and recording all fertilizers and chemicals used in the fi eld makes it possible for third parties to audit these records for the safety and reliability of the crop and the
food.
Although this system provides a wide range of GIS tools for more effi cient and environmentally conscious agricultural practices, there is another aspect that the authors would like to emphasize in this chapter: the utilization of satellite imagery.
Hitachi Solutions has been providing DigitalGlobe* satellite imagery, which provides the world’s highest resolution commercial satellite images, to Japanese and Asian customers since 2001. For this reason, Hitachi has accumulated a depth of know-how relating to satellite imagery and its use in diff erent fi elds and sectors. Applying this know-how to the agriculture sector yielded an important application: planning the harvesting sequence of wheat. Th e harvest time for wheat depends on its dryness. Traditionally, the dryness level is decided manually at the time of harvest by the farmers. However, there can be diff erences in wheat dryness even within the same fi eld, and this usually leads to harvesting some of the wheat before it is dry enough, which means a lower quality crop. By using the satellite image analysis function of the agricultural information system to analyze wheat fi elds and ascertain the growth in each fi eld so that harvesting
Simulation
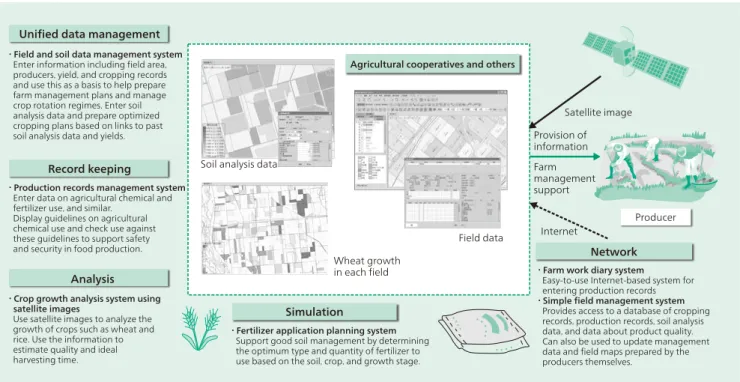
Network Producer Unified data management
Record keeping
Analysis
Agricultural cooperatives and others
・ Field and soil data management system Enter information including field area,
producers, yield, and cropping records and use this as a basis to help prepare farm management plans and manage crop rotation regimes. Enter soil analysis data and prepare optimized cropping plans based on links to past soil analysis data and yields.
・ Production records management system Enter data on agricultural chemical and fertilizer use, and similar.
Display guidelines on agricultural chemical use and check use against these guidelines to support safety and security in food production.
・ Crop growth analysis system using satellite images
Use satellite images to analyze the growth of crops such as wheat and rice. Use the information to estimate quality and ideal harvesting time.
・ Fertilizer application planning system Support good soil management by determining the optimum type and quantity of fertilizer to use based on the soil, crop, and growth stage.
・ Farm work diary system Easy-to-use Internet-based system for entering production records
・ Simple field management system Provides access to a database of cropping records, production records, soil analysis data, and data about product quality. Can also be used to update management data and field maps prepared by the producers themselves. Internet Provision of information Farm management support Satellite image Field data Soil analysis data
Wheat growth in each field
Fig. 3│Overview of Agricultural Information Management System.
Hitachi Solutions, Ltd. s agricultural information management system was developed on geospatial technology (GIS and satellite imagery). It has been developed according to user needs to overlay a wide range of different information and provide various analysis tools to create a more efficient and environmentally conscious agriculture business.
29
featur
e ar
ticles
Vol.96 No.04 258–259 社会イノベーションを加速するグローバルITソリューション can be performed in the order in which each fi eld dries out,
great reductions were made in fuel oil use for drying. Th is also cut CO2 emissions dramatically and helped to avoid quality loss as less chemicals were used to dry the wheat(³). Th is application provides a very good example of social innovation utilizing geospatial technologies in the farming and agriculture sector.
4. GLOBALIZATION OF GEOSPATIAL TECHNOLOGIES
Th e geospatial technologies and their applications in the urban infrastructure and agriculture sectors are suitable for expansion in the global market, especially in emerging countries such as Brazil, Russia, India, and China (BRICs), Turkey, Vietnam, etc. In these countries the necessary infrastructure investments have already been made. However, there is a need for effi cient and cost eff ective management systems for these existing investments. For this reason, Hitachi Solutions has been trying to promote its geospatial solutions in those countries for the last three to four years in collaboration with other Hitachi group companies, and has been getting some promising results. As mentioned in the previous chapters, geospatial technologies provide a common platform for social innovation. Th ere is another article in this issue about probe data and its use in solving traffi c problems in Hanoi, Vietnam and Istanbul, Turkey in which our geospatial technologies were used. Hitachi Solutions is also working on projects related to the power transmission and distribution sector in countries like India, Turkey, and Russia through local partners; agricultural information solutions in the BRICs, and disaster management systems in South East Asian countries like Vietnam in collaboration with Hitachi group companies. Hitachi Solutions is dedicated to promoting its know-how and expertise in geospatial technologies more and more, and will contribute to Hitachi’s social innovation concept.
5. CONCLUSIONS
In an article back in 2009, one of the authors, Bahadir Gultekin, mentioned that there are two hurdles for Hitachi group companies in the global market that result from its being a traditional and large company. Th e fi rst is adaption to diff erent cultures and business habits, the second is fl exibility and speed of reaction to changes in the global context. Now, in 2014, he believes that Hitachi has recognized these hurdles and is making great eff orts towards solving these problems by introducing its social innovation concept whereby Hitachi becomes a total solution provider and can realize its true power(4).
Hitachi Solutions will continue to develop and adapt its geospatial technologies to the needs of the global market as it has been doing for the last 25 years. Its target is to become a leading solution provider in geospatial technologies in the global market in collaboration with other Hitachi group companies.
(1) Hitachi’s Social Innovation Business,
http://www.hitachi.com/businesses/innovation/about/index.html (2) Geographical Survey Institute, “What is GIS?,”
http://www.gsi.al.,go.jp/GIS/whatisgis.html in Japanese.
(3) O. Nishiguchi et al., “Agricultural Information Management System Using GIS Technology – Improving Agricultural Effi ciency through Information Technology,” Hitachi Review 58, pp. 265 – 269.
(4) B. Gultekin, “From Turkey to Japan, My Work Experience at Hitachi,” Hitachi Review 58, pp. 309 – 311.
(5) Hitachi Solutions Geographical Information Systems, http://www.hitachi-solutions.com/gis/
REFERENCES
Bahadir Gultekin, PhD.
Government, Public Sector & Public Utilities Systems Business Division, GIS Department, Hitachi Solutions, Ltd. He is currently the head of the global business development of Geospatial Technologies.
Dr. Gultekin is a member of The Japan Section of Regional Science Association International (JSRSAI) and the GIS Association of Japan.
Michihiro Tsuda
Government, Public Sector & Public Utilities Systems Business Division, GIS Department, Hitachi Solutions, Ltd. He is currently engaged in global business development of Geospatial Technologies.
Mr. Tsuda is a member of the Japan Good Agriculture Practice Association (JGAP).