NON
-INVASIVE METHOD FOR PREDICTING HEPATOCELLULAR CARCINOMA IN PATIENTS WITH CHRONIC HEPATIC DISEASE
BY MEASURING THE SHEAR WAVE VELOCITY
Junichi Fujiwara, Takashi Goto, Tomomi Shibuya, Mitsuru Chiba, Shigetoshi Ohshima, Kouichi Miura, Wataru Sato, Takahiro Dohmen, Toshitaka Sakai, Yuko Sugimoto,
Shinichiro Minami and Hirohide Ohnishi (received 11 March 2016, accepted 14 April 2016)
Department of Gastroenterology and Hepato
-Biliary
-Pancreatology, Akita University Graduate School of Medicine, 1
-1
-1 Hondo, Akita 010
-8543, Japan
Abstract
Aim : To evaluate the usefulness of acoustic radiation force impulse (ARFI) in predicting hepato- cellular carcinoma (HCC) in patients with chronic hepatic disease (CHD).
Methods : A total of 230 patients participated in this study. They were subsequently classified into the “HCC group” and the “non
-HCC group”. We measured their liver stiffness and calcu- lated the mean shear wave velocity (SWV) using ARFI.
Results : The mean SWV was significantly higher in the HCC group than in the non
-HCC group. The cut
-off value for the mean SWV with the best discrimination between the two groups was 1.36 (m/s). The area under the receiver operating characteristic curve (AUROC) was 0.807. The AUROCs of the aspartate
-aminotransferase
-to
-platelet ratio and Fibrosis 4 score were 0.780, 0.728, respectively. The independent risk factors of HCC included the mean SWV and age. A further analysis, based on the individual causes of CHD, found that among the HCV and non
-HBV and non
-HCV (nBnC) cases, the mean SWV was significantly higher in the HCC group than in the non
-HCC group.
Conclusion : Measuring the SWV using ARFI was a reliable method for predicting HCC in CHD patients, especially in HCV and nBnC patients.
Key words : acoustic radiation force impulse, shear wave velocity, receiver operating char- acteristic curves, hepatocellular carcinoma
Corresponding author : Takashi Goto, Associate Profes- sor
Department of Gastroenterology and Hepato
-Biliary
-Pancreatology, Akita University Graduate School of Medi- cine,1
-1
-1 Hondo, Akita 010
-8543, Japan
Tel : 81
-18
-834
-1111 Fax : 81
-18
-834
-8619
E
-mail : [email protected]
-u.ac.jp
hepatocellular carcinoma (HCC) are very important is- sues. The risk factors for HCC include hepatitis C virus (HCV) infection, hepatitis B virus (HBV) infection, alco- hol consumption, obesity, and other factors ; however, the most important factor is progressive liver fibrosis, particularly the presence of cirrhosis
2). When treating progressive liver disease, it is very important to provide appropriate to prevent HCC. Furthermore, it is impor- tant to evaluate the stage of liver fibrosis in order to pre- dict HCC in patients with progressive chronic hepatic disease (CHD). A liver biopsy is considered to be the gold standard for liver fibrosis assessments ; however Introduction
Liver cancer is the second most common cause of
death : it accounted for nearly 746,000 deaths worldwide
in 2012
1). Thus, the prevention and early detection of
this method is invasive and is not suitable for screening examinations. After transient elastography (TE) using a FibroScan examination was applied in the clinical setting as a non
-invasive assessment of liver stiffness, many studies have reported correlations between TE findings and liver fibrosis
3-6). Acoustic radiation force impulse (ARFI) was recently developed as a new method for con- ducting non
-invasive liver fibrosis assessments. ARFI is a non
-invasive ultrasonographic technique that can be used to evaluate the degree of liver stiffness by measur- ing the shear wave velocity (SWV)
7). Studies that com- pared of TE and ARFI have found ARFI to have a similar predictive value to or to be more accurate than TE in the diagnosis of severe fibrosis
7)-14). Furthermore, unlike TE, ARFI is said to not be influenced by the body mass index (BMI) (<27.7 kg/m
2) or the presence of ascites
15)and is able to assess liver fibrosis of both the right and left lobes
16).
Several studies have reported a correlation between liver fibrosis and stiffness (as measured by ARFI).
However, few reports have evaluated the liver SWV in patients with CHD with respect to predicting HCC. The aim of this study was to compare the degree of liver stiff- ness between patients with and without HCC using ARFI and to evaluate the usefulness of this technique for pre- dicting HCC in patients with CHD.
Materials and Methods
The present study was conducted in accordance with the principles of the Declaration of Helsinki and the study protocol was approved by the ethics committee of Akita University Graduate School of Medicine. We ob- tained informed consent from all patients prior to their entry into the study entry.
Patients
A total of CHD 230 patients who underwent the mea- surement of the SWV in the liver parenchyma at Akita University hospital between September 2009 and January 2014 were included in this study. Patients with HCC were classified into the “HCC group” ; those who had not previously been diagnosed with HCC were classified into the “non
-HCC group.”
Diagnosis and classification
The diagnosis of HCC was made using contrast
-en- hanced computed tomography, contrast
-enhanced mag- netic resonance imaging, contrast
-enhanced ultrasonog- raphy with Sonazoid
®and/or a tumor biopsy based on the guidelines proposed by the Japan Society of Hepatolo- gy
17). HCC staging was performed according to the TNM classifications provided by the American Joint Committee on Cancer (AJCC)
18).
The assessment of liver stiffness
We used a Siemens ACUSON S2000 device (Mochida Siemens Medical Systems Co. Ltd., Tokyo, Japan) to measure the degree of tissue stiffness quantified by shear wave speed expressed in meters/second (m/sec) and cal- culated the SWV within the a 10×5 mm region of inter- est (ROI). In this study, the mean SWV was calculated within the ROI, which located in a segment of the right liver lobe 5, six times via the intercostal approach using a convex probe. The procedures were performed by the same experienced physicians. While performing B
-mode imaging, we focused on the ROI at a depth of 2
-5 cm below the liver capsule and selected a location with- out large vessels or bile ducts.
Other indexes of liver fibrosis
The aspartate aminotransferase/alanine aminotransfer- ase ratio (AAR), aspartate
-aminotransferase
-to
-platelet ratio (APRI) and Fibrosis 4 score (FIB
-4) are existing formulae that are used for predicting the progression of liver fibrosis
19-21). These formulae were used to mea- sure liver fibrosis in each of the cases. The formulae are as follows :
AAR = AST (U/L)/ALT (U/L) APRI = (AST [U/L]/
Upper normal limit for AST [U/L])/
Platelet count (10
9/L)×100 FIB
-4 = (age [years]×AST [U/L])/
(Platelet count [10
9/L]×ALT [U/L]
0.5).
We compared each of the indexes with the SWV and
examined the usefulness of the SWV.
Statistical analysis
The values are expressed as the mean ± standard de- viation. The statistical analyses were performed using the non
-parametric Wilcoxon
-Mann
-Whitney U
-test for continuous data, χ
2or Fisher’s exact test for qualitative data and the one
-way analysis of variance for the multi
-group data. The correlations between the mean SWV and the fibrosis indexes were assessed according to Spearman’s correlation coefficient. Receiver operating characteristic (ROC) curves were used to assess the di- agnostic performance of ARFI, and the area under the ROC curve (AUROC), sensitivity, specificity and cut
-off values were calculated. ROC curves represent sensitiv- ity versus 1
-specificity for all possible cut
-off values for the prediction of HCC. An AUROC value close to 1.0 indicated high diagnostic accuracy. Risk factors for HCC were identified using a multiple logistic regression analy- sis. P
-values of <0.05 were considered to indicate sta- tistical significance.
Results Patient characteristics
A total of 230 patients were included in the current study (male, n=132 ; female, n=98 ; mean age, 61.6±
13.3 years). In terms of the cause of CHD, 98 patients developed HCV infection (HCV cases), 68 patients devel- oped HBV infection (HBV cases) and 64 patients were found to have a non
-HBV and non
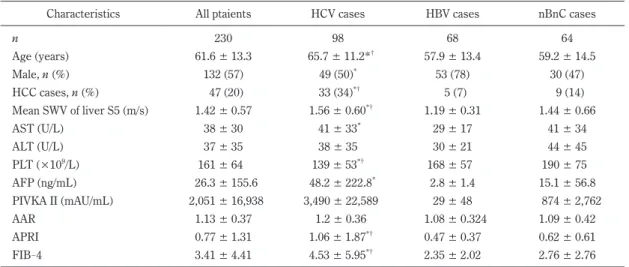
-HCV status (nBnC cases). Among the 230 patients, 47 had HCC (HCV, n=33 ; HBV, n=5 ; nBnC, n=9). Table 1 shows all of the patients’ characteristics and a comparison of the HCV cases, HBV cases, and nBnC cases. There were signifi- cant differences in the age, the number of males, the mean SWV, and the APRI and FIB
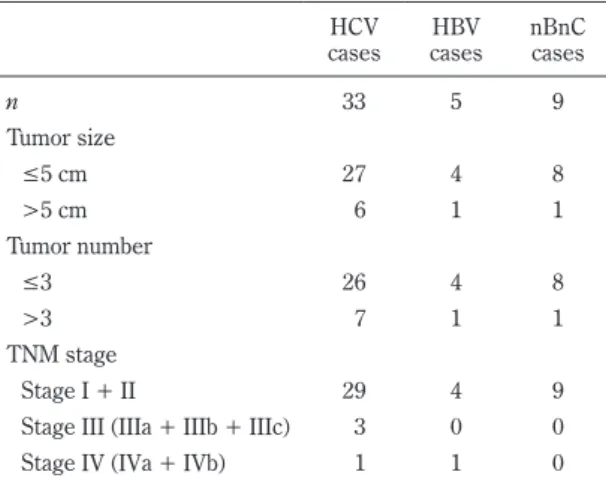
-4 values of the HCV cases and the HBV and nBnC cases. Regarding the tu- mor size and the number of tumors in the HCC patients, 27 of the HCV patients had a tumor size of ≤5 cm and 26 had ≤3 tumors. Four of the HBV patients had a tumor size of ≤5 cm and 4 had ≤3 tumors. Eight of the nBnC patients had a tumor size of ≤5 cm and 8 had ≤3 tu- mors. Almost of the HCC patients were classified as stage I or II (Table 2).
Table 1. The patient characteristics (mean±standard deviation)
Characteristics All ptaients HCV cases HBV cases nBnC cases
n 230 98 68 64
Age (years) 61.6 ± 13.3 65.7 ± 11.2*
†57.9 ± 13.4 59.2 ± 14.5
Male, n (%) 132 (57) 49 (50)
*53 (78) 30 (47)
HCC cases, n (%) 47 (20) 33 (34)
*†5 (7) 9 (14)
Mean SWV of liver S5 (m/s) 1.42 ± 0.57 1.56 ± 0.60
*†1.19 ± 0.31 1.44 ± 0.66
AST (U/L) 38 ± 30 41 ± 33
*29 ± 17 41 ± 34
ALT (U/L) 37 ± 35 38 ± 35 30 ± 21 44 ± 45
PLT (×10
9/L) 161 ± 64 139 ± 53
*†168 ± 57 190 ± 75
AFP (ng/mL) 26.3 ± 155.6 48.2 ± 222.8
*2.8 ± 1.4 15.1 ± 56.8
PIVKA II (mAU/mL) 2,051 ± 16,938 3,490 ± 22,589 29 ± 48 874 ± 2,762
AAR 1.13 ± 0.37 1.2 ± 0.36 1.08 ± 0.324 1.09 ± 0.42
APRI 0.77 ± 1.31 1.06 ± 1.87
*†0.47 ± 0.37 0.62 ± 0.61
FIB
-4 3.41 ± 4.41 4.53 ± 5.95
*†2.35 ± 2.02 2.76 ± 2.76
*P<0.05 vs HBV cases,
†P<0.05 vs nBnC cases.
AST : Asparate transaminase ; ALT : Alanine transaminase ; AFP : Alpha
-fetoprotein ; PIVKA
-II : protein induced
by Vitamin K absence or antagonists
-II ; AAR : Aspartate aminotransferase/alanine aminotransferase
ratio ; APRI : aspartate
-aminotransferase
-to
-platelet ratio ; FIB
-4 : Fibrosis 4 score.
The correlation between the SWV values and the AAR, APRI and FIB
-4 values
The mean SWV was significantly correlated with the AAR (r=0.293, P<0.0001) (Fig. 1a). Significant correla- tions were found between the mean SWV values and the APRI (r=0.503, P<0.0001) and FIB
-4 (r=0.522, P<0.0001) values (Fig. 1b, c).
Comparison of the HCC and non
-HCC groups The mean SWV values in the HCC and non
-HCC groups were 1.82 ± 0.61 (m/s) and 1.31 ± 0.50 (m/s), re- spectively. The mean SWV was significantly higher in the HCC group than in the non
-HCC group (Table 3).
Age, the AST, ALT and AFP levels and the APRI and FIB
-4 values were significantly higher and the platelet count was significantly lower in the HCC group than in the non
-HCC group (Table 3). The cut
-off value, sensi- tivity, specificity, positive predictive value (PPV) and the negative predictive value (NPV) which exhibited the best discrimination for the mean SWV were 1.36 (m/s), 0.79, 0.75, 0.45 and 0.93 respectively (Fig. 2a). The AUROC was 0.807. The AUROCs for the APRI and FIB
-4, were 0.780 and 0.728, respectively (Fig. 2b, 2c). These data indicate that the SWV is a more reliable predictor of HCC than the APRI and FIB
-4.
Table 2. The clinical characteristics of the 47 hepatocel- lular carcinoma patients.
cases HCV HBV
cases nBnC cases
n 33 5 9
Tumor size
≤5 cm
27 4 8
>5 cm 6 1 1
Tumor number
≤3
26 4 8
>3 7 1 1
TNM stage
Stage I + II 29 4 9
Stage III (IIIa + IIIb + IIIc) 3 0 0
Stage IV (IVa + IVb) 1 1 0
Fig. 1. The correlation between the SWV values and other parameters of fibrosis
(a) The mean SWV was significantly correlated with
the AAR (r=0.293, P<0.0001). (b) The mean SWV
was significantly correlated with the APRI (r=0.503,
P<0.0001). (c) The mean SWV significantly corre-
lated with the FIB
-4 (r=0.522, P<0.0001).
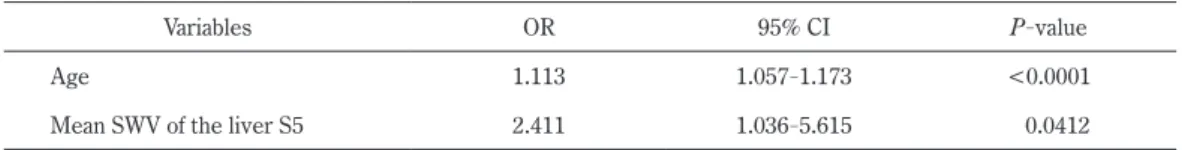
A multivariate analysis for discriminating between the HCC and non
-HCC groups
The discriminative value of the patient characteristics in the HCC and non
-HCC groups was evaluated using a multivariate logistic regression analysis. Consequently, the mean SWV and age were found to be statistically sig- nificant (Table 4).
The HCV cases in the HCC and non
-HCC groups The mean SWV values for the HCV cases in the HCC and non
-HCC groups were 1.87±0.57 (m/s) and 1.41±
0.57 (m/s), respectively. The mean SWV was signifi- cantly higher in the HCC group than in the non
-HCC group. The AST, ALT and AFP levels and the APRI and FIB
-4 values were significantly higher and the platelet count was significantly lower in the HCC group than in the non
-HCC group (Table 5). The cut
-off value which exhibiting the best discrimination for the mean SWV be- tween the HCC group and the non
-HCC group was 1.32 (m/s). The AUROC values were 0.778. The mean SWV showed a sensitivity of 0.88, a specificity of 0.65, a
PPV of 0.56, and an NPV of 0.91 for detecting HCC (P<0.0001) (Fig. 3a).
The HBV cases in the HCC and non
-HCC groups The mean SWV values for the HBV cases in the HCC and non
-HCC groups were 1.50±0.45 (m/s) and 1.17±
0.28 (m/s), respectively (Table 5). Unfortunately, the difference was not statistically significant. This was at- tributed to the number of HBV cases in the HCC group, which was smaller than the numbers of HCV and nBnC cases. However, the mean SWV cut
-off value for the HBV cases (1.67 [m/s]) showed the best discrimination between the HCC and non
-HCC groups. Furthermore, the AUROC value was 0.708, and the mean SWV showed a sensitivity of 0.60, a specificity of 0.95, a PPV of 0.50 and an NPV of 0.97 for detecting HCC (P=0.0007) (Fig.
3b).
The nBnC cases in the HCC and non
-HCC groups The mean SWV values of the nBnC cases in the HCC and non
-HCC groups were 1.94±0.80 (m/s) and 1.35±
0.59 (m/s), respectively. The mean SWV value was sig- Table 3. The comparison of all patients in the HCC and non
-HCC groups (mean±standard
deviation)