Characteristics of inertia gravity waves over Syowa Station in summer
~Comparison between the PANSY radar and the ERA5 reanalysis~
Lihito Yoshida1, Yoshihiro Tomikawa2,1, Mitsumu K. Ejiri2,1, Masashi Kohma3 and Kaoru Sato3
1School of Multidisciplinary Sciences, The Graduate University for Advanced Studies, SOKENDAI
2National Institute of Polar Research
3Graduate School of Science, The University of Tokyo
Gravity waves (GWs) can change a global wind distribution through momentum transport and deposit. Especially, GWs propagating upward drive the summer-to-winter pole meridional circulation in the mesosphere. However, observations are not enough to verify behavior of GWs in the Antarctic, due to the cold and strong wind environment there. In addition, GWs have a wide range of horizontal wavelength (i.e., from several km to several thousands km) and period (i.e., from Brunt-Väisälä period (approximately 5 minutes) to inertial period (over 12 hours)). It makes it difficult to reproduce GWs in the entire frequency range even in the state-of-the-art atmospheric models in spite of the recent increase of their resolution. In order to implement the effect of subgrid-scale phenomena into the models, which are not explicitly represented, a GW drag parameterization is introduced into the models. However, nonorographic GW drag parameterization generally assumes nearly constant wave source and instantaneous upward propagation, in which the intermittency and horizontal propagation of actual GWs cannot be considered.
The Program of the Antarctic Syowa MST/IS radar (PANSY), which was installed at Syowa Station (69°S,40°E) in 2011, can observe three dimensional winds in the troposphere and lower stratosphere with high accuracy and high temporal and vertical resolution. The PANSY radar is the only instrument in the Antarctic that enables us to capture GWs in the almost entire frequency range (Sato et. al., 2014). One purpose of this study is to examine the propagation characteristics of inertia GWs over Syowa Station in austral summer which are observed by the PANSY radar. Another purpose of this study is to confirm the reality of GWs in the latest reanalysis, ERA5 (Hersbach et al., 2020), through the comparison with the PANSY radar observation. In austral summer, it is expected that upward-propagating (i.e., upward group velocity) GWs induced by topography and/or tropospheric jet become dominant because of no polar-night jet in the stratosphere (Minamihara et al., 2018, 2020). This research has another aspect of preliminary research on superpressure balloon observations which are planned in the Antatartic in austral summer of 2021/22.
We use the hodograph analysis to examine the propagation characteristics of inertia GWs. The hodograph analysis utilizes the feature that the hodograph (i.e., the altitude change of the horizontal wind vector) drawn in the zonal and meridional wind space becomes an ellipse, in which the amplitude, intrinsic period, vertical wavelength, phase velocity, and group velocity of GWs can be obtained. Although the hodograph analysis generally has an ambiguity of propagation direction by 180o, we exclude it by estimating the ground-based period directly using the data both in time and altitude.
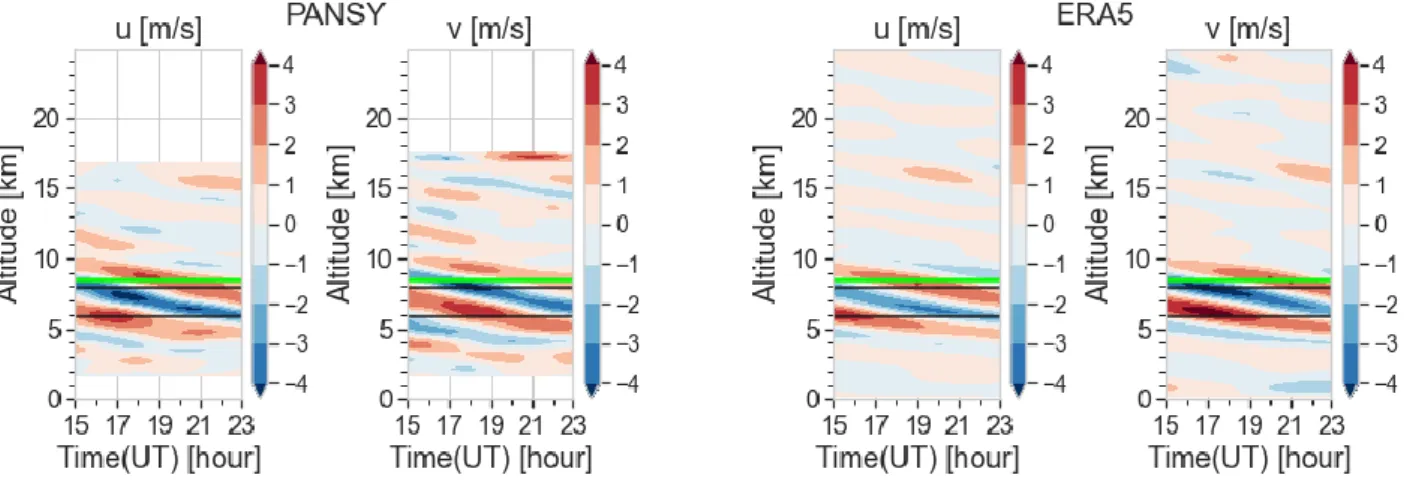
We use three dimensional winds of the PANSY radar and the ERA5 reanalysis during the time period of January to March 2016. In this period, the PANSY radar had been running a one-year continuous observation (from October 2015 to September 2016). The inertia GWs are extracted by applying a bandpass filter with a cutoff period of 4-24 h and a cutoff vertical wavelength of 1.5-8 km. Figure 1 represents time-altitude sections of zonal and meridional wind perturbations on January 13, 2016 from the PANSY radar and the ERA5 reanalysis. A wave-like structure is observed at an altitude of 5-10 km both in the PANSY and ERA5 data. We applied the hodograph analysis to the data surrounded by black lines. The obtained wave parameters such as horizontal and vertical wavelengths and intrinsic and ground-based periods are similar between the PANSY radar and the ERA5 reanalysis, suggesting that this structure is an inertia GW packet. At the same time, it is found that this inertia GW packet was well represented in the ERA5 reanalysis. We will discuss the wave source through the ray tracing analysis of the observed GWs.
Figure 1. Time altitude cross sections of bandpass-filetered zonal and meridional winds (u and v, respectively) obtained by the PANSY radar (left) and the ERA5 reanalysis (right) on January 13, 2016. Green lines represent the tropopause, and black lines show the range used for the hodograph analysis.
References
Hersbach, H, Bell, B, Berrisford, P, et al. The ERA5 global reanalysis. Quarterly Journal of the Royal Meteorological Society, 146, 1999– 2049, 2020.
Minamihara, Y., Sato, K., Tsutsumi, M., & Sato, T. Statistical characteristics of gravity waves with near‐inertial frequencies in the Antarctic troposphere and lower stratosphere observed by the PANSY radar. Journal of Geophysical Research:
Atmospheres, 123,2018.
Minamihara, Y., Sato, K., & Tsutsumi, M. Intermittency of gravity waves in the Antarctic troposphere and lower stratosphere revealed by the PANSY radar observation. Journal of Geophysical Research: Atmospheres, 125, 2020.
Sato, K., Tsutsumi, M., Sato, T., Nakamura, T., Saito, A., Tomikawa, Y., et al. Program of the Antarctic Syowa MST/IS radar (PANSY). Journal of Atmospheric and Solar-Terrestrial Physics, 118, 2–15,2014.