XAFS Study of As in K-T Boundary Clays
Shunsuke Sakai1, Akira Yoshiasa1, Hiroshi Arima2, Maki Okube3, Chiya Numako4 and Tsutomu Sato5
1Graduate School ofScience and Technology, Kumamoto University, Kumamoto 860-8555, Japan 2Graduate School ofScience, Osaka University, Toyonaka 560-0043, Japan
3Material and structures Laboratory, Tokyo Institute of Technology, Yokohama 226-850, Japan 4Facu!ty ofIntegrated Art and Science, Tokushima University 770-8502, Japan
5Laboratory ofEnvironmental Geology, Division ofSolid Waste, Resources and Geoenvironmental Engineering, Graduate School ofEngineering, Hokkaido University 060-8628, Japan
Abstract Local structure around arsenic atoms in K-T boundary clays was studied by As K-edge XAFS spectroscopy.
The threshold Eq energy of As and the characterization of the white peak of XANES spectra agree well with the values of As(+5) minerals like ^(AsO^COH^KfeO and CaQi(AsO4)(OH) according to the comparison with several types of arsenic minerals. This indicates that arsenic is in a high oxidation state As(+5) and occupies the AsO4 fcetrahedral site of a mineral in K-T boundary clays.
Keywords: As in K-T boundary clay, XAFS of As minerals, Local structure of As, Chemical species ofAs.
PACS: 78.70.Dm
INTRODUCTION
K-T boundary clays were formed inbetween the Cretaceous (Kreide) and Tertiary geological times. As they are composed of black clays, they stand out clearly. These clays contain relatively high Pt-group element concentration including indium [1].
Additionally, arsenic anomalies have also been detected in some K-T boundary clays [2]. These concentrations may provide various kinds of information on the asteroid impact and mass extinction at the end of the Cretaceous.
EXPERIMENTAL
The specimen of K-T boundary clays is from Stevns Klint in Denmark. In order to study the local structure around As atoms in K-T boundary clay, we prepared several reference natural arsenic minerals such as, natural arsenic (As), nickeline (NiAs), enargite (Cu3AsS4), arsenopyrite (FeAsS), conichalcite {CaCu(AsO4)(OH)J, ferrihydrite and legrandite {Zn2(AsO4)2(OH)2 2H2O}. The ferrihydrite was (Fe2O3-0.5H2O) from the Horobetsu mine, Hokkaido, Japan that strongly sorbs to arsenic (+5) as arsenate
(AsC^)3". All XAFS measurements were performed
with a Si(lll) double crystal monochromater at BL-
12C and BL-9C branch lines of the Photon Factory in the National Laboratory for High Physics (KEK), Tsukuba, Japan. Spectra near the As K-edge were collected in transmission mode and fluorescence mode using Lytle-type or 19-elements solid-state detectors (SSD) at room temperature. Analyses of XAFS data were performed by using XAFS93 and MBF93 programs [3].
.1.45
1-35
1.3
1.25
1.2
114 11* 113 12 122 124 123 123 Photon Energy (KEV)
FIGURE 1. XAFS spectra near the As K-edge for K-T boundary clays.
CP882, X-ray Absorption Fine Structure—-XAFS13 edited by B. Hedman and P. Pianetta
© 2007 American Institute ofPhysics 978-0-7354-03S4-0/07/$23.00 274
Downloaded 25 Fcb 2007 to 133.95.156.121. Redistribution subject to ATP license or copyright, sec hnp://procccdings.aip.org/pracccomga'cpa.jsp
RESULTS AND DISCUSSION
The fluorescence XAFS spectrum near the As K- edge for K-T boundary clays are shown in Fig. 1. and the unsmoothed background subtracted normalized EXAFS data for all samples studied are shown in Fig.
2. In Hg. 3 the observed XANES spectrum near the As K-edge of the K-T clay sample is compared to those of reference arsenic minerals.
1.6
1.2
40*
■EL 0*0.6
I
Q.2 0
-0.2
9 2 4 6 8 fO 12 14
Wave vetork [I/A]
FIGURE 2. Unsmoothed background-subtracted normalized EXAFS data for all samples studied.
'■ \\
\
'■ \\
' \
t v \/
n
K-T boundary day -
A s\ ~ -
^ KlAsNfckdlfFts \
FeAsS Arsetwpyrtts -
^As Natural Arsenic;
y ^ -\,
■"^^CaCuJAsaiXOK) ■
CaCu(AsO4)(OK) ConichaicSta
11.8S 11.86 11.87 11.88 11.89 11.9
Photon Energy (KEV)
FIGURE 3. XAKES spectra near the As K-edge for reference arsenic minerals and K-T clay.
In the XANES spectra, the threshold Eo energy (the absorption edge) shifts to higher values with increasing arsenic oxidation state. However the absorption edge for As(+5) oxide, legrandite, is at lower energy than that of the corresponding As(+5) oxide, conichalcite. The shift is attributed to difference of the composing atoms. The oxidation state of As in the K-T clay sample is estimated as As(+5) because the absorption edge approximately corresponds to that of legrandite, ferrihydrite and conichalcite.
The k*%{k) function was transformed into the radial structure function (RSF) for the As K-edge of four samples, ferrihydrite, conichalcite, legrandite and K-T clay as shown in Fig. 3. As seen from Fig. 3, the RSF for the As atoms in the K-T boundary clay sample, conichalcite and ferrihydrite are very similar, although the peak positions are slightly shifted and the shape of the EXAFS spectra is slightly different (Fig. 2). It indicates that the compounds have a similar local atomic environmental around the As atoms, but that their extended structures are not equivalent
105
CaCu(AsOt)(OK) conichalcite
0 12 3 4 5
Distance R (A)
FIGURE 4. Fourier transforms of the As K-edge XAFS oscillation function k3%{k) spectra in the range of 3.Ck k <
13.0 A"1 for ferrihydrite, conichalcite (3.0< ifc<13.0 A"1), K-T clay sample (2.5< k <11.5 A"1) and legrandite (3.0< k <15.0 A"1). No phase shift corrections are made.
In order to obtain further information on the structure parameters of the local structures and to compare them around the As atoms, we carried out
275
Downloaded 25 Fd> 2007 to 133.95.156.121. Redistribution subject to ATP license or copyright, sec httn://proccedings.aip.org/procecdmgR'cpcr.jsp
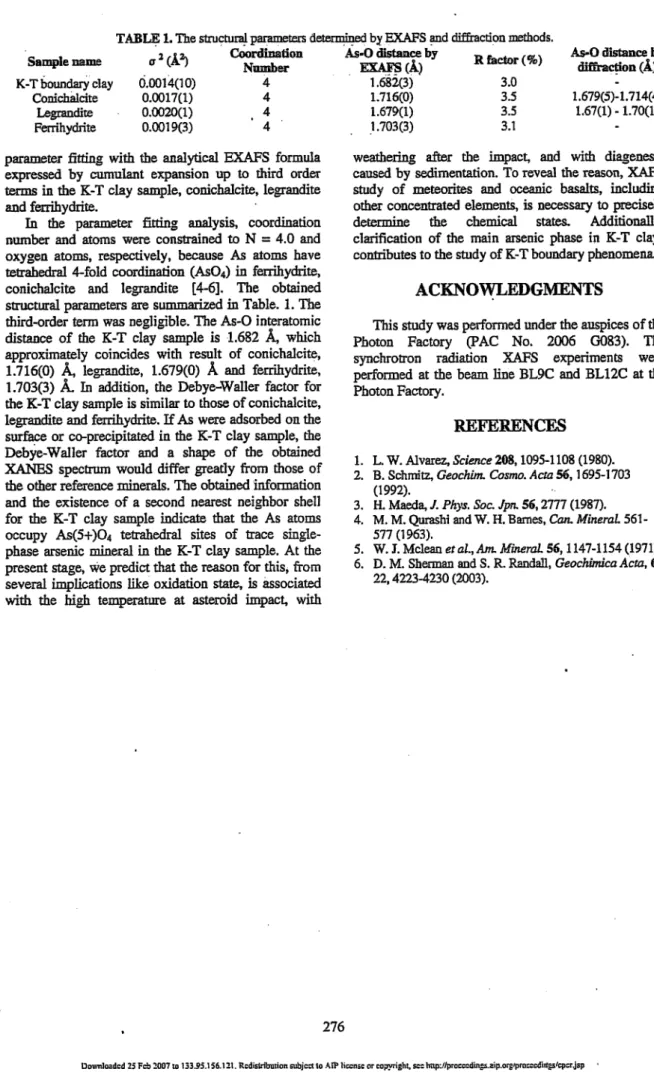
TABLE 1. The structural parameters determined by EXAFS and diffraction methods.
Sample name K-T boundary clay
Cordchalcite Legrandite Ferrihydrite
a2(A*) 6.0014(10)
0.0017(1) 0.0020(1) 0.0019(3)
Coordination Number
4 4 4 4
As-0 distance by
EXAFS(A)
1.682(3) 1.716(0) 1.679(1) 1.703(3)
R£actor(%) 3.0 3.5 3.5 3.1
As-O distance by
diffraction (A)
-
1.679(5)-1.714(4) 1.67(1) -1.70(1)
-
parameter Gtdag with the analytical EXAFS formula expressed by cumulant expansion up to third order terms in the K-T clay sample, conichalcite, legrandite and ferrihydrite.
In the parameter fitting analysis, coordination number and atoms were constrained to N = 4.0 and oxygen atoms, respectively, because As atoms have tetrahedral 4-fold coordination (AsO4) in ferrihydrite, conichalcite and legrandite [4-6]. The obtained structural parameters are summarized in Table. 1. The third-order term was negligible. The As-0 interatomic
distance of the K-T clay sample is 1.682 A, which
approximately coincides with result of conichalcite, 1.716(0) A, legrandite, 1.679(0) A and ferrihydrite,
1.703(3) A. In addition, the Debye-Waller factor for the K-T clay sample is similar to those of conichalcite, legrandite and ferrihydrite. If As were adsorbed on the surface or co-precipitated in the K-T clay sample, the Debye-Waller factor and a shape of the obtained XANES spectrum would differ greatly from those of the other reference minerals. The obtained information and the existence of a second nearest neighbor shell for the K-T clay sample indicate that the As atoms occupy As(5+)O4 tetrahedral sites of trace single- phase arsenic mineral in the K-T clay sample. At the present stage, we predict that the reason for this, from several implications like oxidation state, is associated with the high temperature at asteroid impact, with
weathering after the impact, and with diagenesis caused by sedimentation. To reveal the reason, XAFS study of meteorites and oceanic basalts, including other concentrated elements, is necessary to precisely determine the chemical states. Additionally, clarification of the main arsenic phase in K-T clays contributes to the study of K-T boundary phenomena.
ACKNOWLEDGMENTS
This study was performed under the auspices of the Photon Factory (PAC No. 2006 GO83). The synchrotron radiation XAFS experiments were performed at the beam line BL9C and BL12C at the Photon Factory.
REFERENCES 1. L. W. Alvarez, Science 208,1095-1108 (1980).
2. B. Schmitz, Geochhn. Cosmo. Acta 56,1695-1703 (1992).
3. H. Maeda, J. Phys. Soc. Jpn. 56,2777 (1987).
4. M. M. Qurashi and W. H. Barnes, Can. Mineral 561 - 577(1963).
5. W. J. Mclean et al, Am. Mineral 56,1147-1154 (1971).
6. D. M. Sherman and S. R. Randall, Geockimica Acta, 67, 22,4223-4230(2003).
276
Downloaded 25 Fcb 2007 to 133.95.156.121. Redistribution subject to AIP license or copyright, see http://procccdings.aip.org/praccartrtgs/cpcr.jsp