Ph.D Thesis
Effects of Theta Burst Transcranial Magnetic Stimulation on Brain-Motor
System in Humans
Murat Saglam
Graduate School of Science and Technology KUMAMOTO UNIVERSITY
September 2009
Contents
1 Introduction 1
2 Background 5
2.1 Overview of the Central Nervous System 6
2.1.1 Motor Cortices 9
2.1.2 Descending Motor Pathways 10
2.1.3 Motor Units 12
2.2 Electroencephalogram (EEG) 13
2.3 Electromyogram (EMG) 15
2.4 Transcranial Magnetic Stimulation (TMS) 16
2.5 Coherence 18
3 Cortico-Spinal Excitability 20
3.1 Review and Motivation 20
3.2 Methods 22
3.2.1 Subjects 22
3.2.2 Experimental Design 22
3.2.3 MEP Recording 24
3.2.4 Theta Burst Stimulation (TBS) 26
3.2.5 Sham Stimulation 26
3.2.6 Statistical Analysis 27
3.3 Results 27
3.3.1 MEP Latencies and Amplitudes 27
3.4 Discussion 33
3.4.1 Cortico-Spinal Excitability 33
4 OorticoMuscular and Cortico-Cortical Synchronization 35
4.1 Review and Motivation 35
4.2 Methods 38
4.2.1 Subjects 38
4.2.2 Task 38
4.2.3 Experimental Design 38
4.2.4 Theta Burst Stimulation and Sham Stimulation 40
4.2.5 EEG and EMG Recordings 40
4.2.6 Coherence Analysis 41
4.2.7 Phase and Cross-correlogram Analysis 43
4.2.8 Topography Maps 44
4.2.9 Statistical Analysis 44
4.3 Results 46
4.3.1 Isometric Contraction 46
4.3.2 EEG-EMG Coherence 47
4.3.3 EEG-EMG Phase 63
4.3.4 EEG-EMG Cross-correlogram 71
4.3.5 EEG and EMG Power 75
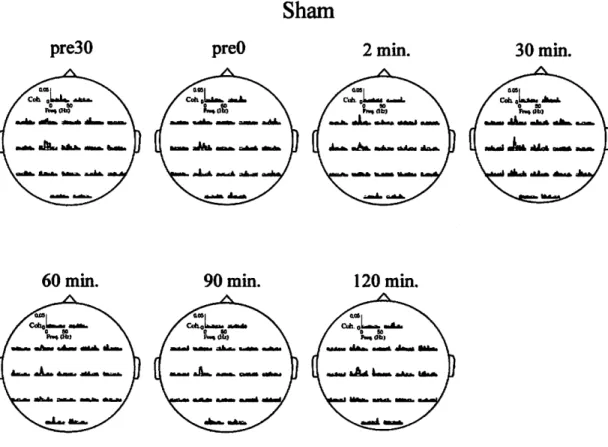
4.3.6 EEG Power Topography 79
4.3.7 EEG-EEG Coherence 83
4.3.8 EEG-EEG Coherence Distribution 93
4.3.9 Comparison between Cortico-Spinal Excitability and Cortico-
Muscular Coherence 97
4.4 Discussion 99
4.4.1 EEG-EMG Coherence 99
4.4.2 EEG-EMG Phase and Cross-correlogram 101
4.4.3 EEG and EMG Power 102
4.4.4 EEG-EEG Coherence 104
4.4.5 Comparison of Cortico-Spinal Excitability with Cortico-Muscular
Coherence 105
5 Conclusions 107
Acknowledgements 110
Bibliography 110
u
Chapter 1 Introduction
One of the most unknown phenomena about the brain is how it controls the movements of our bodies. Even for the voluntary tasks that we rarely make an effort to perform, the motor system does a complicated job and it is still unknown how the nervous system selects the right combination of muscles and controls the level of contractions appropriately. To address these questions, particular emphasis is given to understand functional and anatomical structure of the human motor cortex as it gives rise to major input signals to motoneurons of the spinal cord that inter faces the brain with the muscle periphery. This cortico-muscular communication is stemmed from dynamic, i.e. plastic, structure of cortical circuits. To study the dy namic behavior of the human cortex in healthy subjects, one could use non-invasive exogenous stimulations, for instance visual, auditory, somatosensory stimulations, or relatively-invasive transcranial electrical or magnetic stimulations where trans- cranial stands for passing or performed through - the skull. All of the stimulations mentioned above are widely-used to induce temporary changes in the brain with time constants depending on the stimulation type.
In a numerous number of previous studies, it was suggested that the synaptic
connections in cortical circuits can be potentiated or depressed by applying pulses
ulation parameters, e.g. intensity, duration, total number, and frequency of TMS pulses applied. For instance, low-frequency rTMS applied on the primary motor cortex (Ml) can produce long-lasting (i.e. couple of minutes-long) suppression of motor-evoked potentials (MEPs) (0.9 Hz rTMS: Chen et al. (1997); 1 Hz rTMS:
Touge et al. (2001)) and on the other hand, high-frequency rTMS facilitates MEPs (5 Hz rTMS: Pascual-Leone et al. (1994); Berardelli et al. (1998); Peinemann et al.
(2004)).
Lately, a well-known stimulation pattern called theta burst stimulation (TBS) has been adopted as a novel rTMS paradigm for human studies (Huang et al. (2005)).
A few studies suggested that TBS significantly improves the efficiency of the rTMS
applications by shortening stimulation duration, decreasing the number of pulses
applied and yet prolonging the after-effects in the cortical plasticity: The 1-Hz
rTMS given for 25 minutes with 1500 pulses had a 30-minutes-long suppressive ef
fect on MEP amplitudes (Touge et al. (2001)), while the continuous paradigm of
TBS (cTBS) applied for only 40 seconds with 600 pulses induced 60-minutes-long
suppression (Huang et al. (2005); Ishikawa et al. (2007)). Moreover, a recent study
showed that cTBS can induce such long-lasting after-effects not only in MEP but
also in the somatosensory-evoked potentials (SEPs) (Ishikawa et al. (2007)). Al
though MEP and SEP are quantitative measures widely employed for examining
cortico-spinal and sensory-cortical excitability, respectively, both measures neces
sarily use exogenous stimulations for eliciting the response potentials. For example,
to record an MEP from the target muscle, a single TMS should be applied over a
specific area on the scalp; and to record an SEP, one should electrically stimulate a
peripheral nerve and observe resulting scalp potential from a specific area. There
fore, as testing tools, two major disadvantages of these methods are: firstly, the
interference of testing tool as a conditioning tool (e.g. a test electrical/magnetic
pulse could induce transient plasticities in cortex) and secondly, the limitation of
the signal extent, only couple of hundred milliseconds-long evoked potentials can be
recorded rather then longer signals containing more information. These limitations
prevent the assessment of information processing within cortical areas and between
cortices and the corresponding muscles.
By contrast, the functional coupling within the cortices and between cortex
and the corresponding muscles can be investigated by means of the coherence func
tion in the frequency domain, or of the cumulant density function in the time do
main (Halliday et al. (1995)). Since these measures require no exogenous stim
uli, but recordings of cortical and muscular activities, e.g. electroencephalographic
(EEG) and electromyographic (EMG) signals, one can quantitatively examine the
cortico-cortical and cortico-muscular coherence during voluntary muscle contrac
tions in rather near-natural conditions. In previous studies, the cortico-muscular
coherence during isometric muscle contractions has been found specifically in the
beta frequency band (13-30 Hz), and in spatially localized cortical areas (e.g. Sale-
nius et al. (1997); Halliday et al. (1998); Mima and Hallett (1999a); Murayama
et al. (2001)). Cortico-muscular coherence analysis may also have some diagnostic
potential in neurological diseases arising from abnormal cortical oscillations, such
as epilepsy. Previous studies showed that those rhythmic abnormalities could be
assessed by examining cortico-muscular coherence while subjects were maintaining
voluntary isometric contraction (Silen et al. (2002)) or a posture (e.g. wrist exten
sion and thumb adduction) (Grosse et al. (2003)). In addition to cortico-muscular
coherence, cortico-cortical coherence is also used in clinical applications related to
motor dysfunctions. When two cortical sites are anatomically connected, functional
connectivity within those sites are usually reflected by high cortico-cortical coher
ence. Therefore, loss of cortico-cortical coherence may indicate a sign of reduced
connectivity within two cortical sites (Wheaton et al. (2008)); or when a compen
sating connection arises, i.e. after motor recovery from stroke, it can be detected by
an increase in cortico-cortical coherence (Strens et al. (2004)). However, dynamic
mechanisms of those cortico-muscular and cortico-cortical coherences are unknown
and there is a lack of evidence whether these functional couplings during a natural
motor task can be modulated by rTMS or not. In this study, we examined the effects
signals to muscles and SI is the cortical area that receives sensory feedback signal
from the muscles, cTBS-on -Ml or -Si could temporarily affect the cortico-muscular
and cortico-cortical coherence during voluntary isometric contraction. Before assess
ing those phenomena, to validate our results on the effects of cTBS on coherence, we
performed cortico-spinal excitability experiments by measuring MEPs to reproduce
the results in the literature and validate our cTBS procedure. In that way, we can
also assess the link between those cortico -muscular/-cortical synchronizations and
cortico-spinal excitability.
Chapter 2 Background
Prior to detailed explanation of methodologies and results, it is crucial to be familiar with the fundamental concepts used in this study. Since the present study aims to contribute finding an answer of the question-"how does the brain work?", first a basic overview of the brain and the rest of the central nervous system (CNS) is necessary. As this work focuses on the effects of a brain stimulation technique on the cortical mechanisms of a motor function, it is essential to know the basics about anatomical and functional structure of the CNS, the modalities to measure the brain activity and the tools to stimulate the brain. Thus, in the first section, the structure of CNS with an emphasis on the motor systems is introduced.
Although several measuring modalities are used in this study, the main brain imaging tool is the electroencephalogram (EEG). Also in order to assess the muscle activity, electromyogram (EMG) was recorded from subjects. In the second section, background and basic features of the EEG, basic generation process and conven tional interpretation of EEG rhythms are presented; in the third section, a brief information on EMG is given.
The fourth section is dedicated to the introduction of brain stimulation tech
niques. In that section, non-invasive transcranial magnetic stimulation (TMS) is
they are explained in detail in the following chapters.
2.1 Overview of the Central Nervous System
The nervous system is a sophisticated network of specialized cells which co ordinates body activities according to the state of internal and external dynamic conditions. The nervous system is comprised of two main parts: The central ner vous system (CNS) and the peripheral nervous system (PNS). CNS consists of spinal cord lying within the bony vertebral column and the brain enclosed within the skull.
PNS is made up of the nerves that serve arms, legs, trunk, skeletal muscles and inter nal organs. The smallest specialized intellectual unit of the nervous system is called the neuron. Each neuron is designed to transmit information to other neurons or other cells in the nervous system. The brain, as the largest and most complex part of the CNS, consists of 1011, i.e. one hundred billion, number of neurons. The brain owes its sophisticated functionalities, such as cognition, emotion, sensory and motor functions, to the structural and functional properties of neurons. Although those phenomena arise in part from single neuron properties, mostly they are the cumu lative outcome of networks in which vast number of neurons constitute local and global circuitries via electro-chemical interconnections, called synapses (the average number of synapses in the human brain is 1014). Since there are multiple subtypes of neurons and synapses, neural circuitries show much more functional and structural diversity than those of single neurons.
Prom anatomical and functional point of view, brain consists of three mam
parts: brainstem, cerebellum and cerebrum (Fig.2.1). The brainstem is actually a
continuity of the spinal cord and it constitutes a connection among cerebral cortex,
spinal cord and cerebellum. Main component of the brainstem is the thalamus which
relays and integrates signals coming from sensory systems to respective cortical ar
eas. The cerebellum mainly serves as a coordinator of the somatic muscle system to
provide balance and harmonious muscle activity. The cerebrum is the largest part
of the brain and is accounted to be the part that actually distinguishes human from
other high vertebrates. The outer cerebrum, or the cerebral cortex, is known as the heavily convoluted outer surface of the brain. These convolutions are made up of gyri (sg. gyrus) or ridges and sulci (sg. sulcus) or valleys which provide convenient boundaries between the four parts (frontal, parietal, temporal and occipital lobes) of the cerebral cortex. The frontal lobe is responsible for executive functions, thinking and planning of voluntary motor executions; and the parietal lobe is where visual and somatosensory information is integrated. At the side of the head is the tem poral lobe in which centers for auditory processing, language functions, emotion- and memory-related areas are located. At the back of the head is the occipital lobe which is involved in visual processing and perception. More detailed distinction of cortical areas is available as Brodmann's areas where the cerebral cortex is mapped out on the basis of functional and histological patterns (Fig.2.1).
As we are interested in the CNS sections which are related to motor functions, motor systems are on the focus of the following part of the background. Motor systems that coordinate movements and the posture of the body are organized in a hierarchical fashion. Sophisticated interaction of cerebral cortex, cerebellum, basal ganglia and midbrain produces descending signals that are pooled onto spinal mo- toneurons and projected to skeletal muscles via motoneurons to control contractions.
To study the mechanisms of motor systems during voluntary contractions, structure
of the motor system with an emphasis on cerebral cortex, descending pathways and
the motor units should be understood as these parts constitute the major cortico-
spinal-muscular tract.
ipitallobe
nontallob
cerebeIlum
鋼i
cord
Figure21:ZbpJLatera1viewofthecerebralcortexshowmgtheprincipalgyriand sulcithatseparatesthecortexintofrontal,temporal,parietalandoccipitallobes,
Bottom:Midsagittalviewofthebrain、Visiblearethestructuressituatedonthe medialaspectofthecortex,aswellassubcorticalareas・MajorBrodmann,sareas aremarkedbasedontheirlocations.[AdoptedfromSiegelandSapru(2006)]
8
2.1.1MotorCortices
Motorcorticescanbedefinedasthecorticalareasinvolvedinthecontrolof contractionsandmovementsofskeletalmuscles・Initiationsofthecontractionsare
realizedinprimarymotorcortex(M1)locatedinBrodmann'8麺ea4M1issom汁
totopicaUyorganizedaccordingtothemusculatureitserves.Butthisarrangement isdistortedwithrespecttothenumberofneuronsdevotedtoeachparticulararea aSshowninFig.2.2.
/~=
Figure22:Cross-sectionofthecortexshowingtherepresentationsofthevarious
partsofthebodyontheprimaエymotorcortex.[AdoptedfromSiegelandSapru(2006)andPenfieldandRasmussen(1950)]
Muscles requiring finer motor control have dense motor interventions and thus occupy larger area in Ml. Ml is comprised of precentral gyrus and the anterior wall of the central sulcus and axons of the Ml cells project to the spines as a motor output of the cerebral cortex. Those cortico-spinal neurons, also called pyramidal neurons, drive the descending motor pathways by modulating their firing patterns depending on the parameters of the motor activity. Besides Ml, several areas in the brain are involved in the regulation of the motor activity. Before initiation of the motor task, supplementary motor area (SMA) is also involved in the planning phase and accordingly shapes the cortico-spinal tract via direct projections to Ml. SMA is located in Brodmann's area of 6 and on the medial face of the hemisphere anterior to Ml and lateral to the lateral premotor cortex. Posterior to the Ml, on the post- central gyrus, primary somatosensory cortex (SI) is located. SI is separated from Ml by central sulcus and labeled as Brodmann's areas 1,2 and 3. Si demonstrates a highly correlated somatotopy with Ml and serve as the sensori-motor cortex that receives ascending sensory signals coming from the muscles. Besides anatomical correspondence, Si is functionally integrated with Ml for better motor control by providing a sensory, i.e. feedback, mechanism. At further posterior regions, poste rior parietal cortex (Brodmann's area of 7) exists, this part is located just anterior to the visual cortex and believed to have role in visuo-motor coordination. A rough interaction of the cortical areas during a motor task is illustrated in Fig.2.3.
2.1.2 Descending Motor Pathways
One major descending pathway of the motor system is the cortico-spinal tract originating from the Ml (area 4) and SMA (area 6), directly passing downward through internal capsules and pyramids of medulla and continuing its descent down in the spinal cord. Most of the cortico-spinal cells send axons to the contralateral spinal cord and some of them descend without crossing to form ventral cortico- spinal tract. Axons of the cells originating from red nucleus of the midbrain form rubro-spinal tract. These cortico-spinal and rubro-spinal pathways are crucial for
10
|虹 etaj
Figure23:PrincipalaHerentprojectionstothemotorcortexillustratingseveralkey corticocorticalconnectionsthatareessentialfbrmotorfimctionsThemajorcon- nectionsare:fromtheposteriorpametalcortex(areas5and7)tothepremotorand
supplement麺ymotor麺ea,homarea6(supplementaryandpremotorcortices)totheprimarymotorcortex(area4),andconnectionsfromtheprimarysomatosensory
cortex(areas3,1,and2)totheprimarymotorcortex[AdoptedhomSahi(2005)Iorganizedmovementofsmallmusclegroups,especiallythedistalmusclesperfbrming
finemovements,Incontrast,othermotorpathwaysdescendingfrombrajnstem虹econcernedwithproximal,largegroupofmusclesrelatedtoregulationofupperbody andlimbpostureortheheadposition、
Withoutanysynapticinterruption,allofthesemotorprojectionspoolontothe
spmalcordtomakesynapticconnectionswithmotoneuronsthatconveycortico-spmalsignaJstocorrespondingmuscles・Inthespinalcord,presynapticterminals
ofmotoneuronsareorderlyarrangedaccordingtothemuscleproximitie8.Synaptic
telminalsofthemotoneuronsdescendmgtothedistalmusclesmethemostlateral anddorsalones,whereasthosedescendingtotheproximalmusclesarelocatedatthemostmedialandventralsitesofthecervicalspinalcordcrosssection(Fig.2.4)
S
U:UpperLimb
T:Tmnk
L,S:LowcrLimb
Lateral
ticospinal
Tract
Figure24:Cortico-spinalnact.[AdoptedfromSiegelandSapru(2006)andSafri (2005)]
2.1.3MotorUnits
Amotorunitconsistsofamotoneuronandthemusclefiberscontractedbythat neuron(Fig.25)Themusclefiberscomprisingamotorumtarewidelydispersed
andinterminglewiththosefromothermotorunits.E班hmu8cleismadeupof differentnumberofmotorunitsMotorunitswithsmaUgroupoffibeIB虹eusuallycomposedofslowlycontractingjfatigue-resistantfiberslncontrast1largermotor umtsconsistofrapidcontractmgandeasy-tGfatiguefibers、Activationofmuscles
麺eorganizedinahierarchicalmanner、Accordingtothesizepmnc”IC,smallermotorumtsm・erecruitedfirst.
12
、m石alNeWeRDD1 Tmd
Muscl
Figure25:MotorUnitS.[AdoptedfromSafTi(2005)I
ME1ectroencephalogram(EEG)
Studyoftheelectricalactivityofthebraindatesbacktonineteenthcentury,
butitwa81920sthatitwashrstsystematicallyanalyzedbytheGermanpsychiaF
tristHansBergerwhocoinedthetermofE1ectroencephalogram(EEG).Basically,
EEGdenotesthespontaneousHuctuationsofcorticalpotentiaLsthataJFerecorded
overthescalpRecordingtechniquesoftheelectric8Jactivityofthebrainislabeled
accordmgtothepo8itionoftheelectrodeu8edUnlikeEEG,whentheelectrodesarepla妃eddirectlyoverthesurf8心eofthecerebralcortex,therecordmgiscalledelec-
trocorticogram(ECoG)Altern誠ivelyうthininsulatedelectrode8canbepenetrated
mtothebrajn,withoutgivinganyharmtoneuraltissue,thistechniquei8then
calleddepthrecording・rbrallofthesemethods,therecordedpotentialsarethesu-
scalppotentialsarethepyramidalcenswhichareorientedverticallyinthecortex
andwhoseceUbodiesareintriangularshape,withtheapexdirectedtothecorticalsurface(Fig.2.6).
EEGelectrode
------Ⅱ ̄■---------------------■ ̄■ ̄--------------=----=-=--=---=---=--------------------■■------------------..-----ヨー
--------- ̄Ⅱ ̄■---------■■---Ⅱ ̄■-------------------■-.--------------------------..--..------------------..------国
skml
Figure26:ElectrogenesisofCorticalFieldPotentials.[Adopted症omWebster (1998)]
Whendepolamzingsynapticmputrea妃hestothedendritesofthepyramidal
cells,sul>thresholdcurrentnowsthroughthedendritesandtheceUbody,thenit return8tothesynapticsiteviaextraceUularbathingmedium・Asitisindicated in(Fig.2.6),theextraceUularmediumaboutthesomabecomesasource(+)and andthedendriticsitebehaveshkeasmk(‐)constitutingacurrentdipole、De pendingonthenumberandsignofthesynapticmputs,andahsoontheposition andorientationofthepyramidalceUs,thosedipolesshowaverydynamicbehaスノー14
ior. When synchrony between enough number of current dipoles is maintained, this behavior can be observed in the form of fluctuating potentials either from depths of the brain, from the cortex or from the scalp. Typically, ECoG signals can be as large as 10 mV. Essentially, compared to invasive techniques, EEG signals are smaller in amplitude (~100 ^V) and have relatively lower S/N ratio. Yet, EEG is widely recognized as a powerful brain imaging tool. In the literature, EEG sig nals are often named also as EEG rhythms, because the main component of the EEG signals is their oscillating activity. Conventionally, distinct patterns of EEG rhythms are associated with specific behavior. For example, alpha rhythms which are low-amplitude rhythmic waves at a frequency between 8 to 12 Hz, are observed usually in quite arousal state. On the other hand, during intense mental activ ities, brain activity with higher frequency can be elicited. Beta (13-30 Hz) and gamma (>30 Hz) rhythms are associated with alert wakefulness and some certain conscious functions. Slower brain activity, such as delta (1-3 Hz) and theta (4-7 Hz) rhythms are observed at several sleep or emotional conditions. Besides conventional associations between EEG rhythms and brain functions, direct/indirect connection between different rhythms and various motor, cognitive and mental functions has been demonstrated by a number of studies.
2.3 Electromyogram (EMG)
Electromyogram (EMG) is the recording of electrical activity of the muscle by using surface electrodes placed on the skin or indwelling electrodes penetrating intramuscularly. When a muscle fiber is stimulated, an action potential propagates along the fiber membrane in both directions away from the neuromuscular junction.
An electric field is generated by the flow of the current across the membrane and this
field can be detected as a voltage change at the recording electrode. As the action
potentials propagate along the muscle fiber, the potential observed at the electrode
input (Conway et al. (1995)). In particular, during sustained contractions and slow movements of hand muscles, motor units are found to be synchronized with cortical rhythms at beta band (Farmer et al. (1997); Salenius et al. (1996)). Depending on the fiber physiology, the geometry of the surrounding tissue and the location of the electrode, EMG signals recorded from a contracting muscle may show variance.
When the muscle fiber is located close to the electrode, the fluctuation is observed as a sharper increase/decrease in potential, resulting a high frequency signal. This phenomenon constitutes a low-pass, i.e. spatial, filtering effect; therefore for surface EMG, the muscles located far from the skin surface are not suitable. To interpret the oscillatory activity, recorded EMG signals are often rectified as it has been showed that rectified EMG is linearly proportional to the force produced by the muscle (Mima and Hallett (1999a)).
2.4 Transcranial Magnetic Stimulation (TMS)
Basically, cortical brain rhythms are affected/modulated by three main factors:
changes in the membrane properties of individual neurons, synaptic changes and interaction within intra-cortical and thalamocortical circuits. Those factors can be transiently modulated by controllable exogenous stimulations. Using quantitative analyses, the significance of modulated regions in a certain brain function hence working principles of the brain can be studied. There are two major classes of exogenous brain stimulation techniques: invasive and transcranial stimulations. In vasive techniques like deep brain stimulation (DBS) require surgical operation, thus applied usually for therapeutic purposes. In DBS, deeper areas of the brain can be stimulated; for example DBS application to subthalamic regions has great potential for coping with Parkinson disease. On the other hand, transcranial stimulation tech niques are applied over the skull without any invasive operation and used as either transcranial- electrical stimulation (TES) or -magnetic stimulation (TMS). Both methods induce an electric current in the excitable cortical cells, so that transient changes can be realized at cortical circuits. In TES, the electrodes are placed direct
16
overthescalptherefOretheappliedcurrentdoesnotdirectlynowintothebrain、A
signihcantportionoftheappnedcurrentflowsbetween8timulatingelectrodesand cannotexceedtheskulLThiscurrentmayinducetheexcitationofpajnreceptors
andcontractionofscalpmusclesthuscausingadiscomfOrtfbrthesubject3How‐evera8TMSoperatesbasedontheprinciplesofelectromagneticmduction,itcan
aUeviatethesedemerits、
InFmaday'sexperimentsmthel9thcentury,heconnectedordisconnecteda woundedconandheobservedanelectricalcurrentpassingthroughanotherconpo-
sitionedinanintelmediatemedium,i、e、air,yetclosetothefirstcoiLThisideais
thenevolvedintofbundationsofTMSHerethehrstcoilrepresentsthestimulating TMScoil,themtermediatemediumstandsfbrskin,skulland8calpandtargetedbrajntissueactsasthesecondcoU(Fig.2.7)
magneticl
fluxline§~塁(
--=----
、
'
’
/magnetio
--------ヨノcoil,/" ̄
~---
current
Figure27:DirectionofcurrentflowinaTMScoilandtheinducedcurrentmthe
brajn.AdoptedhomHallett(2000).
Sincemagneticheldsareabletopassthroughthesemediumswithrelatively
either as a test or modulating tool. By applying a single TMS pulse, different aspects of cortical phenomena can be tested, especially the ones related to the motor system;
because when TMS pulse is applied over Ml with a certain intensity, the cortico- spinal tract can be excited and this excitability can be quantified by the amplitudes of motor evoked potentials (MEPs) which are recorded from corresponding muscles.
When TMS pulses are used in a repetitive fashion (rTMS), usually higher than 0.2 Hz, they can modulate the cortical circuits by inducing synaptic plasticities.
Those rTMS-induced plasticities can be divided into two groups: excitatory or long term potentiation (LTP)- and inhibitory or long term depression (LTD)-like effects.
These effects can be selectively produced depending on the rTMS parameters, such as frequency, number of pulses and specific pattern of the rTMS train, stimulation location, intensity and duration. In the following chapters, effects of rTMS patterns with different parameter sets are introduced (Chapter 3).
2.5 Coherence
In order to study the interaction between localized neural circuits, it is usually of interest to measure the likelihood of two signals recorded simultaneously from two different sites within the nervous system. The correlated patterns in the amplitude fluctuations of two signals provide information on the functional coupling between those sites, this also reflects the existence of physiological connection. To assess the coupling between two signals, x(t) and j/(£), one can use cross-correlation function which corresponds to the likelihood of two signals as a function of time lag (r) between them (Eq. 2.1).
z(t)= f x{r)y{t + r)dT (2.1)
J—oo
In the frequency domain, we can express the Fourier transform of z(t) as:
18
Z{w) = r z(t)e-jwtdt = r x{r) f°° y{t + r)e-jwtdtdr
J—oo J—oo J—oo(2.2)
a time shift r corresponds to multiplication by e?*"1 in frequency domain yielding Eq. 2.2 to be:
Z(w) = Y(w) l x{r)e?wtdT
J(2.3)
where the integral term becomes nothing but the complex conjugate of the X(w), thus:
Z(w) = Y(w)X*(w) (2.4)
The Eq. 2.4 shows that in the frequency domain, the cross-correlation function (Z{w)) corresponds to multiplication of the Fourier transform of one signal with the complex conjugate of the other transformed signal and can also be denoted as Sxy{w)- If X and Y were the same signal, then Z would be the auto-correlation function, also called the power spectrum (Sxx(w)).
Coherence is defined as the cross-spectra normalized by auto-spectra:
\KxyKV))\
The coherence, Kxy(w), is a dimensionless, normalized measure of the coupling
between two signals and takes the values between 0 and 1, with 1 indicating a perfect
linear dependency and 0 indicating the lack of association. As it can be seen from
the processes mentioned above, computation of coherence involves the calculation of
power spectral and cross spectral densities by means of the Fourier of the signals of
interest. This systematic approach has been widely applied for EEG signals recorded
from multiple channels (i.e scalp positions). In Chapter 4, previous applications
of coherence function on EEG and EMG signals are presented together with the
Chapter 3
Cortico-Spinal Excitability
3.1 Review and Motivation
Cortico-spinal excitability is the most-widely-used measure of the TMS studies and it refers to the sum of cortical and spinal motoneuron activity initiated by a TMS pulse. There are different aspects of cortico-spinal excitability, such as MEP amplitude, latency and motor threshold. The amplitude of the MEP is expressed as the potential difference between two peaks of opposite polarity. The latency refers to the time elapsed from the stimulus onset to the beginning of MEP and the mo tor threshold represents the minimal intensity of TMS that produces an MEP (Fig.
3.3). Usually, as the stimulus intensity increases, the cortico-spinal activity thus the MEP amplitude increases but the latency is almost independent of the TMS intensity. Also performing voluntary contractions during TMS pulse delivery drasti cally increases the MEP amplitude, therefore the investigators defined two different thresholds: resting- and active-motor thresholds (RMT and AMT, respectively).
RMT is determined while target muscle is in complete resting condition whereas for AMT subjects are asked to perform slight tonic contractions. Obviously, RMT for a subject is higher than his/her AMT value and to assess cortico-spinal excitabil ity, supra-threshold values of RMTs are preferred. However, in order to condition
20
the cortical sites using rTMS, sub-threshold values of AMTs are usually preferred as rTMS intensity. This selection is based on the double-pulse stimulation experi ments where a conditioning TMS pulse is followed by a test TMS pulse. When the interval between pulses are smaller than 5 ms, a sub-threshold conditioning pulse reduces the amplitude of the MEP elicited by the supra-threshold test pulse. While at longer intervals, upto 30 ms, conditioning TMS facilitates the MEP amplitudes (Kujirai et al. (1993)). These phenomena are known as intra-cortical inhibition (ICI) and intra-cortical facilitation (ICF), respectively. However, when the condi tioning is performed not by a single but rather by a train of TMS pulses, i.e. rTMS, inhibitory and facilitatory effects on cortico-spinal excitability become much compli cated. Generally the rTMS patterns are divided into high (>5Hz) and low frequency (<1 Hz) groups with facilitatory and inhibitory effects on cortico-spraal excitability, respectively(low frequency rTMS: Chen et al. (1997); Touge et al. (2001); high fre quency rTMS:Pascual-Leone et al. (1994); Berardelli et al. (1998); Peinemann et al.
(2004)). Although demonstration of increased/decreased cortico-spinal excitability is well documented in those studies, the stimulation conditions are not optimal.
For example, using 1 Hz rTMS with 1500 number of pulses for 25 minutes Touge et al. (2001) could induce 30 minutes of MEP suppression or using 5 Hz rTMS with 1800 number of pulses for 6 minutes Peinemann et al. (2004) could induce 30 minutes of MEP facilitation. Given the potential of being a promising research tool to study cortical plasticities, optimization of the rTMS delivery is of great im portance. In a previous study, Huang et al. (2005) presented an alternative rTMS pattern adopted from a widely-used electrical simulation pattern called theta burst stimulation (TBS) which can efficiently induce long-lasting synaptic modifications in the motor areas of rodent cortices (Hess and Donoghue (1999)). The continuous paradigm of TBS (cTBS) which consists of 600 TMS pulses lasting for only 40 sec onds, can suppress cortico-spinal excitability for 60 minutes (Huang et al. (2005);
Ishikawa et al. (2007)).
chapter we aimed to confirm the previous findings on the effects of cTBS on cortico- spinal excitability by means of MEP amplitudes; so that we can compare the time course of the cortico-spinal excitability change with that of coherence and we can justify whether the isometric contractions included in our experimental design in terfere with the cTBS-induced effects or not.
3.2 Methods
3.2.1 Subjects
Seven subjects (7 men, 29.5±3.5 years) participated in this experiment. All subjects gave written informed consents for the experiments which were approved by the local ethical committee due to the requirements of the Declaration of Helsinki.
3.2.2 Experimental Design
To assess the effects of cTBS on cortico-spinal excitability, MEPs were recorded before and after cTBS. cTBS was applied either over the scalp location of Ml or as sham. For each subject, active motor threshold(AMT) over the Ml for the right FDI muscle was defined as the lowest TMS intensity at which 5 out of 10 con secutive stimuli could elicit reliable amplitude of MEPs (~ 200/zV) during slight tonic contraction of the target muscle (~ 20% of the maximum voluntary contrac tion). Previous studies have demonstrated that cTBS has long-term effects on the cortico-spinal excitability (Huang et al. (2005); Ishikawa et al. (2007)). Recently, it was shown that such an after-effect of cTBS could be interfared/disturbed by a weak isometric muscle contraction performed immediately after cTBS (Huang et al.
(2008)). Therefore, we measured MEPs in an experimental condition matched to that of experiments for cortico-muscular and cortico-cortical coherence mentioned in Chapter 4.
22
B 糯in
ACOntractionnlsk
=三、200,..-40time-6s
国|回□□|面I闇OsBcReStcTBsk
、、Ⅱ
MEP
Experimentplc30p歴0-3021530
60 90 120mmFigureal:Experimentaldesign、Ineachsession(whitebars),subjectswereaskedto perfOrml-minutelongcontractionnvetimeswith30second-1ongrests,butwithout
EEGandEMGrecordmg(insetA:TindicatesTもskwithoutEEG-EMGrecording)E亜hMEPrecordingsessionwasconsistedof20singleTMSpulses(bluebars)
Motorhot8potandcTBSimensityweredeterminedatthebeginningbefbretwo
presessions(graybar)asiUustratedinFig、3.2.cTBSwa8deliveredfromt=-40
tof=O(blackb麺)(insetB:cTBScon8istedofthreebiphasic50-HzTBSpulsesrepeatingthemselvesatevery200ms).
As illustrated in Fig. 3.1, subjects were asked to perform the same contraction task, at nearly the same time points with that of coherence experiments in the next chapter, i.e. pre30 and preO before cTBS and 2, 30, 60 and 90 minutes after the cTBS. Since last MEP recording session was performed 120 minutes after cTBS, a trailing contraction session would have been meaningless, hence it was omitted. To obtain baseline MEP values (as the peak-to-peak amplitudes) for each subject, two recording sessions were performed before cTBS application. In those sessions, MEP amplitude was measured 40 times each. After applying the same cTBS as in the coherence experiment, a post-hoc recording session was made 15 minutes later, and was subsequently repeated every 30 minutes (i.e. 15, 30, 60, 90, and 120 minutes after cTBS). Each of the post-hoc recording sessions consisted of 20 MEP recordings.
There was a 6-minutes-long interval from the first post-hoc contraction task to the following recording session, in order to avoid possible post-exercise facilitation of MEPs.
3.2.3 MEP Recording
MEP was recorded from the right FDI muscle using Ag-AgCl surface elec trodes. The MEP signal was fed to a bio-amplifier (Synax-1200; NEC, Japan) with a passband of 20-3000 Hz, and with 5-kHz sampling frequency. In order to ensure complete relaxation of the right FDI muscle during the MEP recording, the EMG was monitored online, and the data were stored to a personal computer for offline analysis (Signal Software, Cambridge Electronic Design, Cambridge, UK). A High Power Magstim 200 machine and a figure-of-eight coil with mean loop diameters of 70 mm (Magstim Co., Whitland, Dyfed, UK) were used to apply a monophasic single pulse of TMS (100 fjs of rise time and 0.8 ms of pulse width) that evokes MEP.
The current at the coil intersection flowed toward the handle during the rising phase of the magnetic field. The coil was held tangentially to the skull, the handle end pointed backwards and laterally at a 45 degree away from the midiine.
24
MEPResponses
DPomFDImuscIe
 ̄L- ̄ ̄--- ̄~-
---4-/1戸-へ戸
一一一八一-八パーへ一
 ̄
鐸i二二児●c-。◆●
oMotorHotSpot=M1
,IYMScoiI
PD=■
C・ノ
Figure32:DeterminationofM11ocationlnpreparationsessions(graybarsinFig、
3.1andFig.4.1,1ocationofM1wassearchedbyshiftmgthecoiloverthepresumed
areaofM1andapplyingsingleTMSpulse、ThelocationthatgaN/emax1mumMEP responsewasacceptedasthemotorhotspotandassumedtobetheM1ofhandarea、Z1heMEPme8po"sesq'℃notthe7mldqtqa"damTl)"/brjllustmtionpuTposa
In this orientation, the coil was presumably placed perpendicular to the line of the central sulcus, and therefore it was the optimum positioning for inducing a posterior-anterior electric current in the brain thereby achieving the minimum motor threshold (Brasil-Neto et al. (1992); Mills et al. (1992)).
We determined the optimum scalp position for the activation of the right FDI muscle by moving the coil with 1-cm steps in the presumed Ml area (Fig. 3.2). The position where the single TMS of slightly supra-threshold intensity could produce the largest MEP in the FDI muscle was marked as the motor hot spot. For each subject, at the beginning of every experiment, the position of TMS was searched and then the single-pulse TMS intensity was set so that the evoked MEP amplitude was approximately 1 mV (Huang et al. (2005), Ishikawa et al. (2007)).
3.2.4 Theta Burst Stimulation (TBS)
Continuous TBS (cTBS) paradigm used in this study was designed as it was described previously (Huang et al. (2005)). Three pulses of the TMS were given at 50 Hz and each of the pulse triplets was applied at 5 Hz for 40 seconds (600 pulses in total) and each of the magnetic pulse had a 300-yisecond-long biphasic waveform (inset B in Fig. 3.1). cTBS was delivered to the Ml location or applied as sham.
The stimulation was delivered using a Magstim Super Rapid stimulator (Magstim Co., Whitland, Dyfed, UK) and a figure-of-eight coil with mean loop diameters of 70 mm. The current at the coil intersection flowed toward the handle in the first phase, and then into reverse in the second phase. The intensity of each pulse for cTBS was set to 80% AMT for the FDI muscle as in the previous reports (Huang et al. (2005); Ishikawa et al. (2007)).
3.2.5 Sham Stimulation
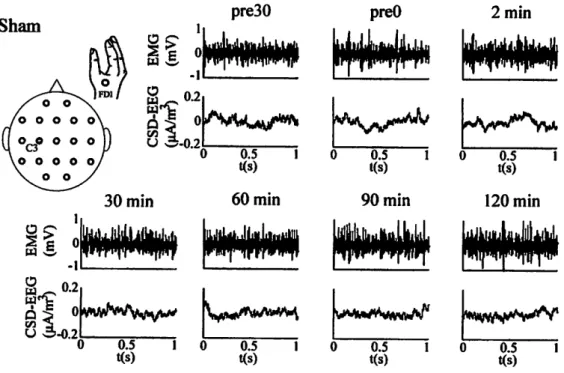
A figure-of-eight coil connected to an uncharged magnetic stimulator was placed over the left Ml area so that the subject felt the presence of a coil as in the case of real stimulation. In addition, another coil connected to the charged stimulator was
26
held 10 cm above the scalp, and was allowed to pass the same electric current as the real cTBS. This could produce the same sound as the real stimulation, and yet avoid induction of the electric current in the brain.
3.2.6 Statistical Analysis
Effects of cTBS on peak-to-peak MEP amplitudes were tested by the repeated- measures of ANOVA (analyses of variance) using within-subject factors. The inter action between the TBS site (Ml and sham) and time course of the effect (pre30, preO, 15, 30, 60, 90,120 minutes) was evaluated using two-way repeated measures of ANOVA as within-subject factors. In addition, the effects of cTBS on MEP ampli tudes was evaluated by employing separate one-way repeated-measures of ANOVA as within-subjects factors. When necessary, the Greenhouse-Geisser correction was used to correct the non-sphericity. The post-hoc test with the Bonferroni correction for multiple comparisons was used to compare the MEP amplitudes between ses sions. In all analyses, the statistical significance was assumed for p values smaller than 0.05.
3.3 Results
3.3.1 MEP Latencies and Amplitudes
A typical MEP response from FDI muscle in response to a TMS pulse with
supra-threshold intensity is shown in Fig. 3.3. The main measures of MEP response,
i.e. conduction time (MEP latency) and peak-to-peak amplitude (MEP amplitude),
are demonstrated. The conduction times are quantified by measuring mean latencies
of MEPs that are given in Table 3.1. Statistical analysis revealed no significant effect
of stimulation or time on MEP latencies which were ~ 21 ms for all conditions (n=7).
2r
•8 3
-1
Peak-to-peak MEP amplitude
<^^
0
0.02 0.04
t(s)
0.06
0.08
Figure 3.3: A sample of motor evoked potential (MEP) recorded from FDI muscle of subject 1. The conduction time is defined as the time interval between TMS pulse onset and the point where evoked potential reaches to a threshold value that is around one standard deviation of the resting potential. Cortico-muscular excitability is quantified with the potential difference between the positive and the negative peaks, i.e. peak-to-peak amplitude.
28
Table 3.1: Mean of MEP latencies (n=7).
cTBS position
Ml Sham
preSO 21.1
21.3
pre 21.3
21.5
15 21.3
21.4
Timc(tns) 30 21.7
21.4
60 21.4
21.9
90 21.5
21.4
120 21.4
21.6
± standard error values are smaller than 0.01, therefore omitted.
Next, we checked mean MEP responses (n=7) from cTBS-on-Ml and sham experi ments shown in Figures 3.4 and 3.5, respectively. These figures qualitatively indicate that there is a tendency of suppression in the MEP amplitudes after cTBS-on-Ml.
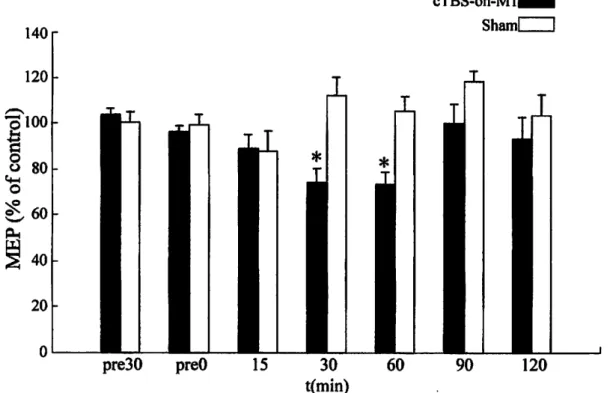
In order to quantity the effects of cTBS on MEP amplitudes, peak-to-peak ampli tudes of MEP were normalized with the control amplitude, which were obtained by averaging the peak-to-peak MEP amplitudes in the pre30 and preO sessions. One way ANOVA did not reveal any significant difference between the MEP amplitudes of the pre30 and preO sessions under all conditions. The control values from the seven subjects (mean ± SE) were 1.25 ± 0.13 and 1.14 ± 0.12 mV for the cTBS- on-Ml and sham conditions, respectively; and paired-sample t-test did not reveal any significant difference between those amplitudes. Fig. 3.6 shows the mean of normalized peak-to-peak MEP amplitudes. Two-way repeated measures of ANOVA revealed a significant interaction between stimulation site (Ml and sham) and time (pre30, preO, 15, 30, 60, 90 and 120 min). One-way repeated measures of ANOVA revealed a significant effect of time on the normalized MEP amplitudes after cTBS- on-Ml, but not for the sham. Post-hoc Bonferroni multiple comparison test showed that MEPs were significantly suppressed to 74.3 ± 6.1 % and 73.4 ± 5.5 %, 30 and 60 minutes after cTBS-on-Ml, respectively, and recovered to baseline levels to 100.1
± 8.2 % and 93.1 db 9.6% in 90 and 120 minutes after the stimulation, respectively.
These demonstrate that cTBS-on-Ml affected the cortico-spinal excitability, and the
effects persisted for 30 and 60 minutes, then faded away in 90 and 120 minutes.
国噸月の露。吟冨gロ呉日go吋箪・爾旦壱・訂員冨』“(寓因勺)写ロ日豊、暑]⑩ロ訂(国Ⅱ『〉遷 室、や、壷胃範の鼠自)目亀頭や自丁琶房擁冨」日の日・自富、。息騨甘号鼻&冨重冨巨の.
晩炬P(mV) Ⅱ3 hN」-- ̄-fg
hmP(mW
l -ご-&l閂〕山 @□1,‐
②。魯鞠卓』 c
黛塾
⑳C吋再》■
@口・轍。」 白
兵塁
圓 菖 EG I、少一一一t。IJ R、」-●-Hg
○画ロ功。』 。
((、)
菖菖言
や、つい察』 や
(念)
壷柿①。
ロ自円函顕!○宮」迂壺
噂。
Bq l、ユ-□■■t、』Iu l、ユ-‐-tⅥ』
■.■■I0lqI
や。。鞠②」 ・
帯)
]いつ再国{回
○・つ釣、』
{毎)
罠吻曰匿
ムーc-tqq
い②目勗邑
ロ毎つ軌。」
黛馨
十 十十 十
fHhflm
pre30 pr造り l5min 3○mm
21012[。録圏)閏圏 21□靴2 21012筍繭 21012』閂
0 0.鰹@.lo
t(s〕
0.05。」DIS)
9,mm
qO50J
t(3)
lZGmin
00.050.1
t(s)
60min
2 21012
←』
21012
画〆爲韓国回]塗 I
Oトー I 2
弓
B▲
0.05010
Ks)
qO5q10
噸)0.056,1 t(3)
0
Figurea5:MeanofmotorevckedpotentiaLs(MEP)fmmallsljKbjects(n=7,2p MEPspersesBion)inshame:xp麺ment・TMSonsetindicatBdbyblueUne.
21012
2
0
Z
-1|〆-
JIF-」Ir-
十
J1,-
140 120
3100
Ci—i
8 80
o
40
20 0cTBS-on-Ml^B Shaml I
pre30 preO 120
Figure 3.6: Effects of cTBS on the normalized peak-to-peak MEP amplitudes (n=7).
Control value is obtained by averaging the mean peak-to-peak MEP amplitudes in the pre30 and preO sessions. Results are displayed as means ± SE (* indicates significant change (p<0.05) after Bonferroni correction.)
32
3.4 Discussion
3.4.1 Cortico-Spinal Excitability
Present results indicate that cTBS-on-Ml suppressed cortico-spinal excitability for 30 and 60 minutes after the stimulation consistent with the previous findings (Huang et al. (2005); Ishikawa et al. (2007)). These results unlikely to be due to unknown factors because sham stimulation did not induce any effects on the cortico-spinal excitability. Present data confirm that cTBS with a short period, i.e.
40 seconds, and low intensity, i.e. 80% AMT have long-lasting temporary effects on the physiology of CNS. Since previous paired-pulse studies showed that spinal H-reflexes were not affected (Chen et al. (1998)) but the intra-cortical circuitries were modulated by the stimulation in terms of short interval intra-cortical inhibi- tion(Huang et al. (2005)), present results are likely to be due to modulation of the excitability of neurons in the motor cortex. This is consistent with the evidence that other rTMS paradigms have their after effects via modulating the effectiveness of synaptic interactions(Siebner et al. (2000)).
In our experimental design, we have included 5-minute-long sessions of isomet
ric contraction of the FDI muscle to match the conditions with that of the coherence
experiments. Because, Huang et al. (2008) demonstrated that contraction during or
immediately after 20 seconds of cTBS delivery can alter the after-effects of stimula
tion. In that study, 1-minute-long isometric contraction of the FDI muscle during or
immediately after the cTBS delivery can abolish or reverse the inhibitory effect of
cTBS, respectively, whereas contraction 10 minutes after the cTBS had only tran
sient effect on the inhibition. In this study, the effect of cTBS-on-Ml remained
inhibitory according to the MEP size, although the contraction of the target muscle
was performed at 2, 30, 60, and 90 minutes after the end of stimulation. There are
two possibilities to explain this discrepancy. First, as we have known that 40 seconds
of cTBS produces much longer lasting after-effect than 20 seconds of cTBS does (60
within or very shortly after 40 seconds of cTBS. Second, although synaptic plastic ity can be reduced or reversed by physiological activity after plasticity induction, previous animal studies have proved that the effect is greatest, the nearer it is to the end of the induction period (Chen et al. (2001)). A 2 minute gap may be long enough for inhibitory effect of cTBS to be stabilized, and muscle contraction after 2 minute gap can no longer modify the inhibitory effect.
34
Chapter 4
Cortico-Muscular and
Cortico-Cortical Synchronization
4.1 Review and Motivation
During maintained voluntary contractions in humans, motor units are exposed
to a number of cortico-spinal drives which rise from primary motor cortex and syn
chronize generally within the /? band (13-30 Hz). Although the frequency range and
spatial localization of cortico-muscular synchronization has reached a consensus, the
generator mechanisms are still under debate. A previous study on higher primates
demonstrated that cortico-muscular coherence is a reflection of cortico-spinal syn
chronization (Baker et al. (1997)). Moreover, it was shown that this beta band
cortico-spinal coherence can be affected not by only the neural circuits at Ml but
also by other brain sites. For example, in invasive studies on higher primates or
human patients, local beta-band oscillations have been found in Ml (Murthy and
Fetz (1996)), in basal ganglia (Courtemanche et al. (2003)) and in the cerebellum
(Courtemanche et al. (2002)), suggesting that those sites may contribute to the
cortico-spinal coherence generation. This idea can be further supported by the exis
and Lamarre (2005); Soteropoulos and Baker (2006)), thalamus and motor cortex (Marsden et al. (2000)), spinal cord and thalamus (Marsden et al. (2000)), motor cortex and basal ganglia (Marsden et al. (2001)). However it is difficult to gener alize these functional connections to the normal human brain as these studies used invasive recordings from animals or patients.
Alternatively, Conway et al. (1995) was the first who systematically investi gated cortico-muscular synchronization using magnetoencephalography (MEG) and surface EMG in healthy human subjects. His results on the existence of beta band cortico-muscular coherence during isometric contraction were then confirmed by other studies. For instance, Salenius et al. (1997) and Murayama et al. (2001) re ported beta-band MEG-EMG coherence showing the synchronization between Ml and FDI hand muscle during isometric contraction task. In addition, during a similar isometric contraction task, several EEG studies demonstrated beta-band EEG-EMG coherence between Ml and FDI muscle (Halliday et al. (1998); Mima and Hallett (1999a); Safri et al. (2006)). However MEG-EMG or EEG-EMG coherence alone is not enough to understand the contributions of different brain sites to maintained voluntary contraction task. Therefore investigators observed the changes in the power spectra and cortico-cortical coherence to indirectly assess the functional cor tical connections. In monkeys, Brovelli et al. (2004) demonstrated the existence of beta band coherence within different sites of sensorimotor cortex. Cortico-cortical coherence in human sensorimotor cortex was reported in Ohara et al. (2001), in that study the coherence ranged between 5-40 Hz and demonstrated within the pairs of M1-S1-SMA triplet. Similarly, Mima et al. (2000a) and Schoffelen et al. (2008) demonstrated the existence of coherence between ipsilateral motor cortices in hu mans during isometric contraction. As for the effects of rTMS paradigms on cortical power and cortico-muscular or cortico-cortical coherence, the number of studies are limited. It was previously shown that a single pulse of TMS-on-Ml can increase cortico-muscular coherence for up to 600-800 ms (Hansen and Nielsen (2004)) and 0.9 Hz rTMS on premotor cortex can suppress cortico-muscular coherence for less than 15 minutes (Chen et al. (2003)). Changes of the EEG power before and af-
36
ter rTMS application has been also reported (0.9 Hz rTMS: Chen et al. (2003); 1 Hz rTMS: Brignani et al. (2008); 10 Hz rTMS: Okamura et al. (2001); Griskova et al. (2007)) Likewise, effects of rTMS on EEG-EEG coherence were reported in previous studies with various conditions (1 Hz rTMS: Strens et al. (2002); 5 Hz rTMS: Oliviero et al. (2003); 10 Hz rTMS: Jing and Takigawa (2000); Plewnia et al.
(2008)). However, only few studies attempted to examine the effects of cTBS on EEG activity, and in those studies different cortical locations have been targeted, i.e.
eye field (Schindler et al. (2008)) or prefrontal cortex (Grossheinrich et al. (2008)).
Motivation: In this chapter, in order to investigate the effects of cTBS on synchro
nized activity at cortico-muscular and at cortico-cortical level, we aimed to study the
effects of cTBS-on-Ml or -Si not only to the beta-band cortico-muscular coherence
but also to cortico-cortical coherence and power spectra of EEG and EMG.
4.2 Methods
4.2.1 Subjects
Eight subjects (7 men, 1 women; 25.6±2.2 years) participated in the experi ments. All subjects gave written informed consents for the experiments which were approved by the local ethical committee due to the requirements of the Declaration of Helsinki.
4.2.2 Task
Subjects were asked to maintain weak isometric contraction of their right hand FDI muscle with ~15% of maximum voluntary contraction. The contraction level was determined using a force gauge sensor gripped by the subject by holding and squeezing it between the thumb and the index finger (inset in Fig. 4.2). The sensor output was shown to the subject only prior to the recording sessions. During the sessions, the display was not exhibited in order to avoid a possible visual-cognitive effect of force level exhibition (Safri et al. (2006)).
4.2.3 Experimental Design
In order to assess the effects of cTBS on cortico-muscular and cortico-cortical synchronization, during isometric contraction task, EEG and EMG signals were si multaneously recorded before and after cTBS. First, to obtain baseline coherence values (as the magnitudes and the frequency bands) for each subject, two record ing sessions were made before cTBS application as shown in Fig.4.1 ("pre30" and
"preO"). Each recording session consists of five 1-minute long EEG-EMG recordings during which the subjects were asked to perform above-mentioned task. Between each 1-minute-long recording, 30 second-long breaks were given in order to prevent fatigue. The location of motor hot spot and the stimulation intensity were searched between two pre-sessions (Fig.4.1, "Search Ml and Intensity"; for details see Chap-
38
ContlBclionIask
EEG-EMGRecording
騏旦駅
Search
M1&intensity:TBS
Onnnn
306090120mm CoherenExperim
t鴎印
pre30 prcO-302
Figure41:Experimentaldesign、Ineachsession(greenb麺s);EEGandEMG
signalswererecordedwhilesubjectswereperfOrmingl-mmute-longcontractionfive timeswith30second-longrests(inset:T+RindicateslaskandRecording)Motor hotspotandcTBSintensityweredeterminedbetweentwopresessions(graybar)
asiUustratedmFig、32.cTBSwasdeliveredfromt=-40tot=O(blackbar)as
iUustratedininsetBofFi9.3.1.
ter 3), so that we could confirm that single-pulse TMS did not alter the coherence.
Three minutes after the preO session, we delivered 40-seconds-long cTBS, and then two minutes later, a post-hoc recording session was made. Afterwards, a recording session was repeated every 30 minutes (i.e, 30, 60, 90, and 120 minutes after cTBS).
Thus, there were seven recording sessions in total.
4.2.4 Theta Burst Stimulation and Sham Stimulation
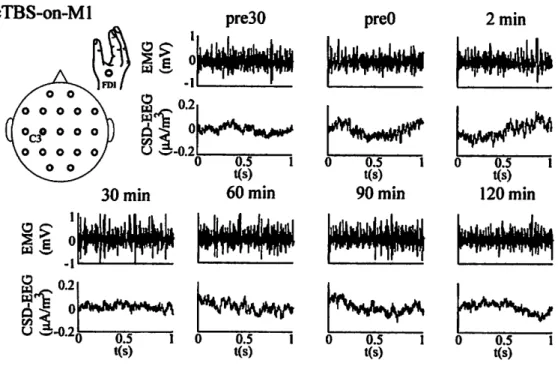
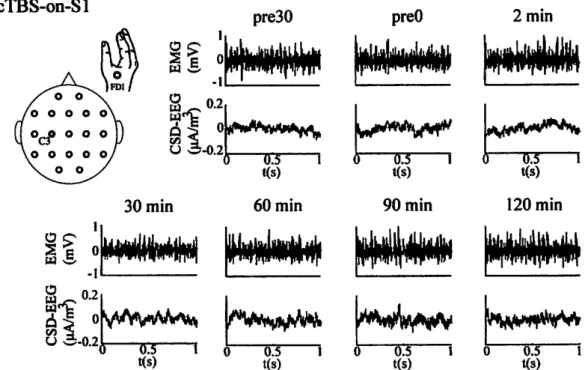
Continuous TBS paradigm used in cortico-muscular and cortico-cortical coher ence experiment has the same parameters with that in cortico-spinal excitability experiment (Chapter 3). In coherence experiment, cTBS was applied either at over a scalp location of Ml or SI (2 cm posterior to Ml). Similarly, in order to bypass uncontrollable factors, a sham stimulation session was performed as it is explained in Chapter 3.
4.2.5 EEG and EMG Recordings
EEG signals were recorded from 19 scalp electrodes mounted on a cap (Electro- cap International, Inc., Eaton, OH) according to the conventional 10-20 electrode placement system (Fig. 4.2). Electrode impedances were kept below lOkfi each for a high signal-to-noise ratio. Earlobe Ag-AgCl surface electrodes served as the reference. Surface EMG was recorded from the right FDI muscle with a reference surface electrode placed on the second metacarpal bone of the index finger. EEG and EMG signals were recorded by a bio-amplifier (MME-3124; Nihon Kohden, Tokyo, Japan) with pass-bands of 0.5-200 and 5-300 Hz, respectively, and with 1- kHz sampling rate. All the recordings were performed in a magnetically shielded room which is shown in Fig. 4.2 together with the experimental setup.
40
ShieldRoom
」 し
八
lldlIUIlUU
I
IEIヨG
]■11【011「ヨ'JWJW41MN
ヂコミコ己
9,二二=,
EMG
lⅡ■rQIi4WLIM川
自皀 自皀
Bio-ampUfier
、」、名■ロ□一口
PC ⅡⅡ
L 「
Figure42:ExperimentalsetupfbrEEGandEMGrecordings.
4.2.6CoherenceAnalysis
First,theEMGsigna]swererectifiedandmeansofEMGandEEGsignalswere
noImalizedbefOrean副ysesasitwasproposedpreviously(HallidayetaL(1998)i
MimaandHallett(1999a);SafrietaL(2006);SafrietaL(2007))Then,EEG andrectihedEMGsignalsweresegmentedintonon-overlappingepochsoflO24ms,EEGsign2Lsfroml9channelsusingtheear-lobereferencingwereconvertedtocur- rentsourcedensity(CSD)becauseMimaandHaUett(1999a)previouslyreported
thatcoherencebetweenCSD-transfbrmed-EEGandEMGsignalsistwiceorthreetimeslargercomparedtothatofbetweenotherreferencedEEGsandEMGs・CSD
transfOrmationwasappliedtothepresentdatabyemployingsphericalspmユesasEEG
洲lWJ1,vwlMハ
瀞
preSSp了I
RenSOr
recorded from n number of electrodes (n = 19 in this study).
Data Acquisition
Epoching
Mean Normalization
^Qy&r every epoch
CSD Transformation
Calculation of Power- & Cross-
Spectra
Averaging
Estimation of Coherence
Figure 4.3: Block diagram illustrating the steps of spectral analysis of EEG.
To calculate power spectra of CSD-transformed-EEG and EMG signals, those signals were moved into frequency domain by Fast Fourier transform with 1024 points, resulting a spectral resolution of 0.98 Hz. Similarly, cross-spectra between CSD-transformed-EEG and EMG signals and then using Eqn.4.1, the EEG-EMG coherence were evaluated (Fig. 4.3). Although coherence function between two sig nals is defined in Eq.4.1, practically the coherence spectra is estimated by averaging over a number of epochs. Because, from Eq. 4.1, selection of single epoch essentially results to an outcome which is always one. Therefore, cross-correlation function is
42
averaged over n epochs (before taking the absolute value), indicated by (...)„ in the following equation:
In practice, the confidence level of meaningful coherence could be determined by calculating the coherence function with two independent signals. With large number of n (i.e. more experimental data), resulting coherence spectra would be more reliable. Here we used the confidence level determined by Eq. 4.2 proposed by Rosenberg et al. (1989).
4.2.7 Phase and Cross-correlogram Analysis
The temporal relationship between two signals can be estimated by the phase spectra which is the argument of the cross-correlation spectra (Eq. 4.3). The phase has the units of degree and must be evaluated in conjunction with the coherence magnitude, because phase information at a certain frequency has a meaning only if the coherence value at that frequency is significant.
4>xy(w) = arg {SXy(w)) (4.3)
Knowing the phase estimate at each frequency, we can estimate the time delay between EEG and EMG signals using the following equation:
AtXY(f) = 4>xY{f)l2*f (4.4)
Alternatively, one can estimate the delay between EEG and EMG signals by assessing cross-correlogram which can be calculated by using Inverse Fast Fourier Transform (IFFT) of the cross-spectra between EEG and EMG signals. In the results section, EEG-EMG time delays extracted from phase and cross-correlogram analysis are presented.
4.2.8 Topography Maps
In the results section, cortico-muscular coherence and cortical powers from 19 electrodes are presented as topography maps. Once maximum coherence or spectral power at a certain frequency band (delta, theta, alpha, beta, gamma) for all data points are calculated, an exponential interpolating function is employed to assign data for the intermediate points in between 19 scalp positions. As for the cortico- cortical coherence, topographical maps are compiled as a connectivity map within 9 central EEG electrodes (F3, Fz, F4, C3, Cz, C4, P3, Pz, P4) since they presumably cover the motor cortices. The maximum coherence in each frequency band for each pair is color and width coded. Further details are given in corresponding sections.
4.2.9 Statistical Analysis
Coherence magnitudes were assumed to be statistically meaningful only if they exceed the 95% confidence level by evaluating the eqn. 4.2. Effects of cTBS on contraction force levels, peak coherence frequencies and peak coherence magnitudes were tested by the repeated-measures of ANOVA (analyses of variance) using within- subject factors. The interaction between the TBS site (Ml, SI and sham) and time course of the effect (pre30, preO, 2, 30, 60, 90, 120 minutes) was evaluated using two-way repeated measures of ANOVA as within-subject factors. In addition, the effects of cTBS on coherence was evaluated by employing separate one-way repeated- measures of ANOVA as within-subjects factors. When necessary, the Greenhouse- Geisser correction was used to correct the non-sphericity. The post-hoc test with the Bonferroni correction for multiple comparisons was used to compare the coherence
44
between sessions. In all analyses, the statistical significance was assumed for p values
smaller than 0.05.
4.3 Results
4.3.1 Isometric Contraction
Subjects successfully performed isometric contraction at a level of ~15% of MVC during coherence experiment. Table 4.1 presents the values (mean ± SE) of the isometric contraction task. Two-way repeated measures of ANOVA revealed that neither time (pre30, preO, 2, 30, 60, 90 and 120 minutes) nor stimulation site (Ml, Si and sham) was a significant factor for the mean contraction levels. Also, interaction of those factors did not produce any significant effect. Separate one-way repeated measures of ANOVA revealed that mean contraction levels did not change significantly with respect to time during either the cTBS-on-Ml, cTBS-on-Sl, or the sham condition.
Table 4.1: Mean force levels of voluntary isometric contraction as percentage of MVC.
cTBS position Time (min)
pre30 pre 2 30 60 90 120
Ml 14.6 ± 0.89 14.5 ± 0.70 14.7 ± 0.79 14.8 ± 0.85 15.1 ± 0.90 16.2 ± 0.97 14.8 ± 0.80 SI 12.8 ± 0.83 13.1 ± 0.78 13.7 ± 0.91 14.3 ± 0.94 13.7 ± 0.85 14.3 ± 0.82 14.0 ± 0.87 Sham 14.4 ± 0.78 14.8 ± 0.57 14.7 ± 0.75 14.1 ± 0.81 15.1 ± 0.71 14.3 ± 0.70 14.3 ± 0.80