ON-SITE MEASUREMENT OF DELAMINATION AND SURFACE CRCK IN CONCRETE STRUCTURE BY VISUALIZED NDT
Kimitoshi MATSUYAMA
Senior Engineer, Nippon Koei Co. LTD., Japan [email protected]
Masahiko YAMADA
Graduate School of Science and Technology, Kumamoto University, Japan
Masayasu OHTSU
Graduate School of Science and Technology, Kumamoto University, Japan
ABSTRACT:
On-site measurement in concrete piers of a highway structure was conducted by visualized non-destructive testing (NDT). First, the radar technique was applied to identify delaminated areas between pre-stressed concrete (PC) panels covered and original concrete piers. By applying the impact-echo method, SIBIE (Stack Imaging of spectral amplitudes Based on Impact Echo) procedure is developed as an imaging technique, which can visually display a cross-sectional view based on the impact-echo data. In order to identify voids in delaminated areas and depths of surface cracks, then the impact-echo tests were conducted. From these results, a superior applicability of the SIBIE procedure to on-site measurement is demonstrated in existing concrete structures.
Keywords: nondestructive evaluation, impact echo, radar technique, delamination, surface crack
1. INTRODUCTION
It is seriously recognized in concrete engineering that concrete structures are no longer considered as maintenance-free, as a number of the existing structures are aging and going to reach their service-life limits. Accordingly, inspections on the current state of existing structures have been increasingly carried out all over the world. In this regard, development and establishment of innovative and highly advanced non-destructive testing (NDT) are necessary.
So far, quantitative assessment of damage and structural integrity of the structures are neither quantitative nor completely successful yet. This is because applications of NDT techniques to on-site measurements have been not so successful as each technique requires a particular analysis.
In this regard, visualization and imaging of results are in great demand for practitioners and engineers for inspection. For on-site measurement by NDT, the elastic-wave methods have been developed and standardized. Among the methods, the impact-echo method has been successfully applied to locate defects, flaws, inclusions and voids in concrete structures [1].
Since the attenuation of high-frequency components in elastic waves is dominant in concrete, a high-energy impact and the detection of elastic waves in the low-frequency range are recommended [2].
The impact is usually generated by dropping a steel ball or hitting by a hammer, and a displacement sensor is placed next to an impacted location to detect elastic waves. By identifying the resonant frequency in a frequency spectrum, which is obtained through the Fourier transform (FFT) of a detected waveform, the location of a defect is estimated from a relation between the wavelength of resonance and the travel distance via the defect. In actual cases, however, many peak frequencies are usually observed in the spectrum and the peak frequency responsible only for the location of the defect is not easily identified.
In order to compensate this drawback, SIBIE (Stack Imaging of spectral amplitudes Based on
Impact-Echo) has been developed, as an imaging procedure applied to the impact-echo data in the
frequency domain [3]. Applying the procedure, depths of voids in reinforced concrete were
successfully determined [4]. The presence of un-grouted tendon ducts in pre-stressed concrete was also evaluated by the improved procedure [5], where the impact was driven right over the duct hole between two locations on the surface where elastic waves were detected by accelerometers. To generate a high-energy and reproducible impact, a device for shooting an aluminum projectile by air-pressure was developed. In the present paper, an applicability of the radar technique and the SIBIE procedure to on-site measurement in concrete structures is investigated.
2. SIBIE TECHNIQUE
In the impact-echo method, the presence and the locations of defects in concrete are estimated by identifying peak frequencies in the frequency spectra. In practical applications, however, spectra obtained include so many peak frequencies that it is very difficult to identify particular peak frequencies only associated with defects. Consequently, the SIBIE procedure has been developed [3, 4, 5].
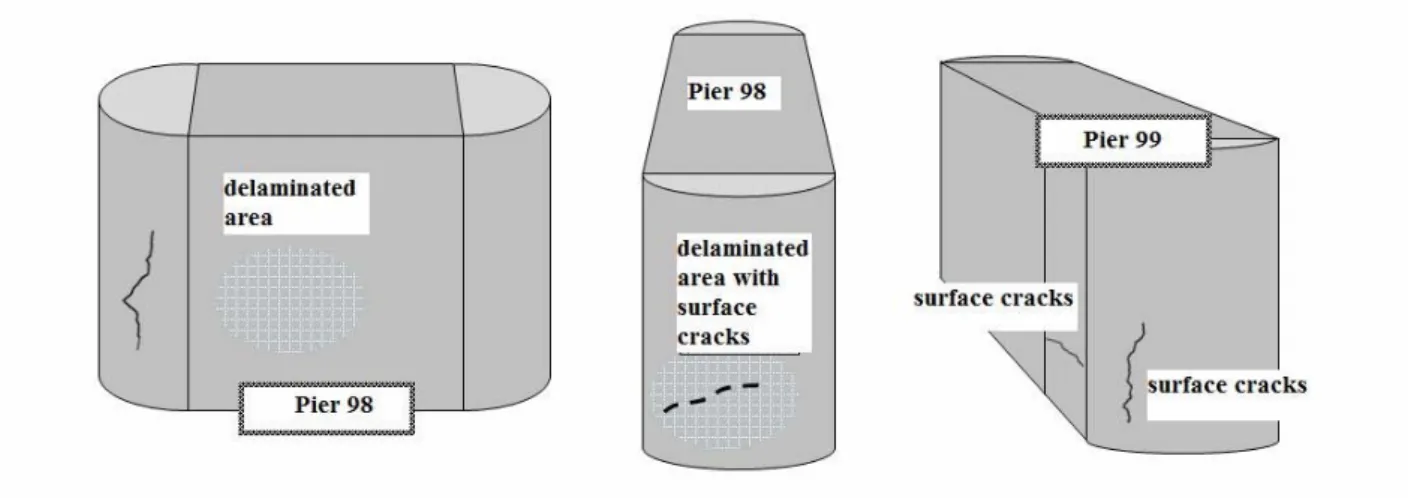
Hitting the hammer could only generate an impact of the lower frequency contents than around 5 kHz. In the case of dropping the steel ball, a small ball is suggested to generate high-frequency waves with the decrease in a contact time. In order to generate an impact of high-energy with wide-frequency coverage, a device for shooting a projectile with tapered head by air-pressure was developed.
An aluminum bullet of 8 mm diameter and 17 mm length in Fig. 1 is shot at the impact point by a projectile system via compressed air (0.05 MPa) shown in Fig. 2. The projectile system consists of a portable compressor and a shooting device for the aluminum bullet. Elastic waves generated are detected at the surface by an accelerometer next to the impact point. It is confirmed that the system could generate the impact of frequency rage up to around 50 kHz [3].
A cross-section of a specimen measured is modeled and divided into square elements as
shown in Fig. 3. Then, resonant frequencies due to reflection at the element are theoretically
and virtually calculated, without taking into account whether the resonant vibrations occur or not.
The travel distance from the input point to the output via the center of the element is calculated as denoted in the figure,
R = r 1 +r 2 . (1)
Resonant frequencies due to reflection at the element are obtained as,
2
2 r
f C p , and
R
f R C p . (2)
Here C p is the velocity of P wave. In a frequency spectrum of a detected wave, spectral amplitudes corresponding to these two resonant frequencies are just summed up at the element as a reflection intensity. Thus, a stack image is created at each element. Assigning stack images at all elements, a contour map on the reflection intensity is eventually obtained at the cross-section. As discussed in the previous paper [3], the minimum length of the square element,
x, is determined from,
x = C p t/2, (3)
where t is the sampling time of a recorded wave.
After the SIBIE analysis, a two-dimensional view of the contour image is displayed, as the high reflected zone is visually identified. In the cases of analytical results discussed below, a grade classification by five colors is adopted.
3. ON-SITE MEASUREMENT 3.1 Test Site
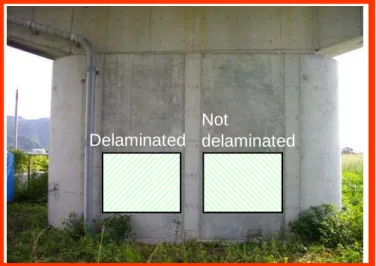
Tests were conducted in two concrete piers, No. 98 and N. 99 of an express highway as
illustrated in Fig. 4. The piers were re-strengthened right after construction in order to upgrade
the earthquake resistance. This is because the Japanese standard on earthquake resistance was
revised after the Great Hanshin Earthquake. By attaching precast and pre-stressed concrete (PC)
panels of 100 mm thickness, load-bearing capacities of the piers were improved. In PC panel, the cover-thickness of reinforcement with 13 diameter deformed steel bar (D13) was 50 mm and post-tensioning duct of 33 mm diameter was embedded at 85 mm depth. The panels were placed outside the piers, and grouting was performed between the pier and PC panels. Since the cross-section of the pier was oval, a flat panel and a curved panel were jointed on the surface of the pier. The joint was covered by in-place casting concrete.
Although real causes have not been clarified yet, surface cracks were observed after post-tensioning of PC panels as illustrated in Fig. 4. Imperfect grouting between PC panels and original concrete in piers is one possible cause, because voids between the panels and the original concrete were detected at many areas of the piers. Consequently, internal voids due to delamination or poor grouting, and surface cracks are major concern at the site to be investigated.
3.2 Radar Test
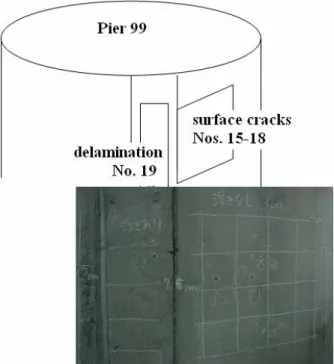
The delaminated areas in Fig. 4 were detected and identified by hammer-hitting in Piers 98 and 99. Then, to visually identify voids in delaminated areas between the PC panels and original concrete, the radar technique was applied. Nominal frequency of an antenna was 1. 5 GHz. A radar antenna and a control unit are shown in Fig. 5. Measurement was conducted at Pier 98, two areas of delaminated and not delaminated were selected as shown in Fig. 6.
3.3 Impact Test
Impact tests were performed at Pier 98 and at Pier 99. In Pier 98, three areas were selected
as shown in Fig. 7. At each area, right before the test, P-wave velocity was determined by
employing an ultrasonic tester (MIN-02, Marui). The time of flight was measured 10 times at
four locations with 50 mm interval on the panel surface. Dark circles in the pictures show the
points where sensors of the tester were set up. At the points of Nos. 1 to 6, voids or
delaminations were attempted to be detected by applying two-point detection [5]. At the point
selected, the impact was driven by the shooting device in Fig. 2. Two accelerometers were attached at two locations 50 mm horizontally apart from the impacted point, and elastic waves were detected and recorded.
At the semi-circular end of the pier, the points of Nos. 7 to 10 was selected. Because a surface crack extended in the vertical direction was found, the impact was driven at the location 50 mm horizontally apart from the surface crack and the accelerometer was attached at the counter location 50 mm apart from the crack to detect elastic waves. At the other end of the pier, delaminated area was found and thus the points of Nos. 11 to 14 were selected and tested.
In Pier 99, the points of Nos. 15 to 19 were selected and tested as shown in Fig. 8. Again, at each area, P wave velocities were measured in advance. The point of No. 19 is located at a joint between a flat panel and a curved panel, where concrete was cast on site after a jointed device was set up at 40 mm depth.
At each point, the impact was driven five times and five waveforms were recorded after visually confirming the waves on CRT screen. A storage-type oscilloscope (TDS2014, Tektronix) was employed to store the waveform data in time domain. A waveform was digitized at 4 sec sampling time ( t) of 2048 recording words (N=2048). By employing the FFT software, frequency spectrum was determined, and then the SIBIE analysis was performed.
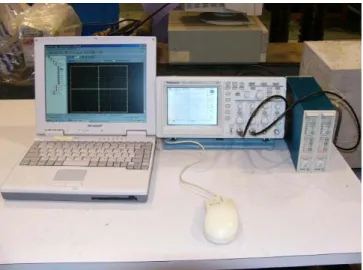
Here, taking into account the thickness of the PC panel (100 mm), 12 kHz was set as the lower-bound frequency in the analysis, which corresponds to approximately 150 mm depth. 40 kHz upper-bound frequency was selected due to the characteristic range of the accelerometer. A system for data acquisition and SIBIE analysis are given in Fig. 9.
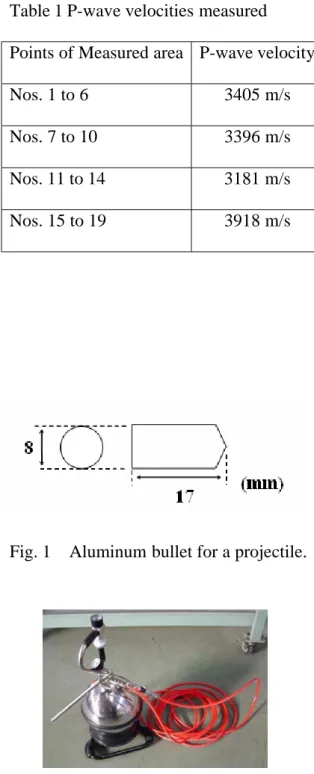
P-wave velocities measured are given in Table 1. The velocities were measured at four areas
in Figs. 7 and 8. The velocities were measured on the surface at four intervals. Consequently,
from the relationship between the distances and arrival times, the velocity was evaluated as a
gradient of the highest correlation coefficient. It is noted that these velocities in the table are
obtained by the surface method. It is known that the velocity measured by the surface method
could be slower than that of the through-transmission method. This might affect results of the SIBIE analysis.
4. RESULTS AND DISCUSSION 4. 1 Results of Radar Technique
Results of radar imaging and received electro-magnetic signals are shown in Fig. 10. Due to the presence of rebar at 50 mm cover-depth, imaging view is not so clear to discriminate delaminated area and not delaminate area. Concerning the signal waveforms, a peak amplitude of reflected wave at the delaminated area is lower than that of non-delaminated. From a practical viewpoint, it seems that the radar technique is not readily applicable to visually identify the delamination inside heavily reinforced concrete.
4.2 SIBIE Results
The SIBIE analysis was performed at the two kind cross-sections. For the delamination or the void, the cross-section 300 mm wide and 150 mm deep was divided by 10 mm mesh. This is because a possible location of the delaminated void was 100 mm below the panel surface, as the thickness of the panel is 100 mm. In the case of the surface crack, the cross-section of 125 mm width and 250 mm depth was analyzed with 10 mm mesh.
After the SIBIE analysis, it was found that results of 5 waves at the same location and at the same area were really similar. Not averaging or summing any wavefroms and spectra, therefore, a typical result is discussed at each point.
(1) Delaminations and voids
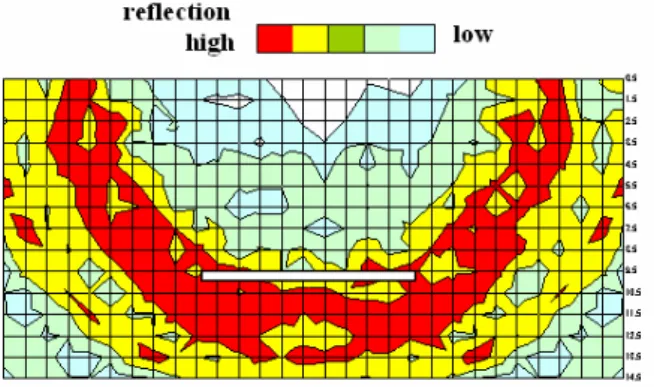
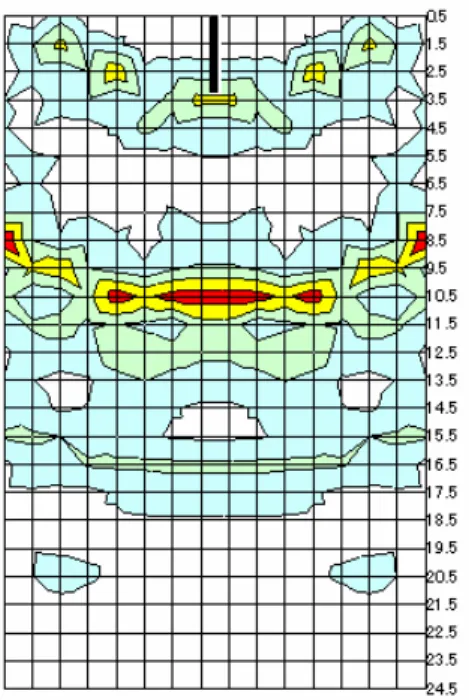
A result at the point of No. 1 is shown in Fig. 11. The dimension of a mesh is 10 mm x 10 mm. The reflection intensity at each mesh is graded with 5 colors from high to low. The ordinate in the figures here-in-after denotes the depth of the cross-section with centi-meter unit.
Because the delamination should exist at 100 mm depth, open rectangular area is inserted at 100
mm depth. The reflection intensity is classified by colors as indicate at the top. From the figure, it is realized that the delamination is really present, and the width of void gap could be around 30 mm. It is interesting that the effects of reinforcement at 50 mm depth and post-tensioning sheath at 85 mm depth are minor in the result. This is because the upper-bound frequency is set at 40 kHz, and thus the effect of shallow reflector becomes less dominant than the void.
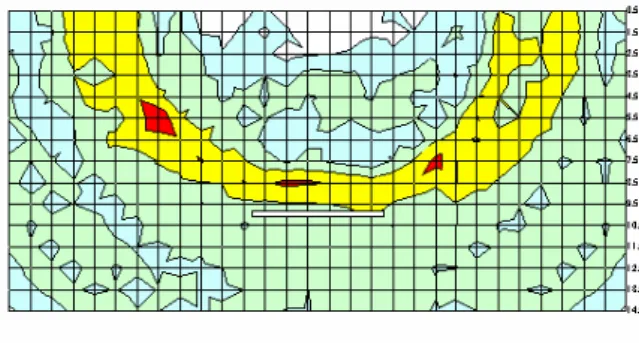
A result at the point of No. 2 is shown in Fig. 12. Since the measurement point was located around a transition zone between delaminated and well bonded areas, the refection intensity at 100 mm depth is fairly weak. But, it is still possible to identify the depth of delamination.
A result at the point of No. 11 is given in Fig. 13. Weak reflection intensity is observed at an area upward apart from the assigned depth of the delamination (rectangular blank area).
Because the thickness of PC panel is 100 mm, a shallower delamination than 100 mm is not plausible. This might be because the velocity of P wave was estimated as slower than actual.
As realized in Table 1, P-wave velocity measured for Nos. 11 to 14 is the slowest of all. It is known that the velocity measured in the surface method could be slower than that of the through-transmission method. The area of Nos. 11 to 14 is a curved end of the pier, and thus the slower velocity might result in estimation of a shallower delamination in the analysis. It is noted that the reflection intensity is not so high in comparison with other cases. Therefore, it might suggest that the portion is not evidently delaminated.
(2) Surface cracks
A result at the point of No. 8 is shown in Fig. 14. In the figure, a virtual crack is illustrated by a solid line, which is extended from the top surface to the zone of highest reflection intensity.
The case illustrated is a surface crack with 0. 1mm width of crack-mouth opening. The depth
is estimated to be around 80-90 mm, which is shallower than the thickness of the PC panel (100
mm). It suggests that the surface crack does not reach up to the bottom of the PC panel. At
the point of No.10 in Fig. 15, the depth is estimated around 95 mm. This implies that a surface crack could be referred to be a through-thickness crack in the PC panel. Since the crack-mouth opening width was 0. 2 mm, these two cases suggest that surface cracks with the width over 0. 1 mm possibly extend up to around the bottom of the PC panels.
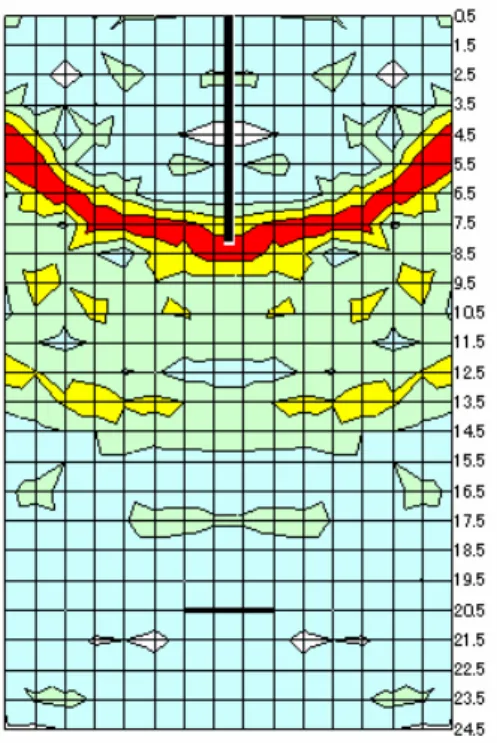
Another case of 0. 1 mm crack width is given at the point of No. 17 in Fig. 16. Here, two zones of high reflection intensity are observed. One is located at around 100 mm depth. So, the crack line is drawn up to this depth, suggesting a through-thickness crack in PC panel. In the case, the crack width of surface opening was 0. 1mm. The second is observed at around 130 mm depth. This implies that the void of delamination is present below the surface crack. The surface crack reaches to the depth of the PC panel, and the delaminated void of around 30-40 mm width might be created between the panel and the concrete pier.
The point of No. 19 is located on the in-place concrete, which corresponds to a jointed portion between a flat PC panel and a curved panel. In almost of all piers, surface cracks were observed at in-place concrete, probably because of shrinkage at an early age and an external constraint in the hardening process. A result of the SIBIE analysis is shown in Fig. 17. It is observed that the depth of a surface crack is around 40 mm, although the crack opening width was 0. 3 mm wide. It is in good agreement with the depth of a connection joint between the flat and the curved panels.
Consequently, the surface crack is arrested at 40 mm depth. In addition, the delamination is observed at 100 mm depth. Due to shrinkage of in-place concrete, therefore, the surface crack was created by external constraint from the both-side panels, and the delamination occurred at the interfacial zone between the cast concrete and the concrete pier.
6. CONCLUSIONS
In this study, the radar and the SIBIE techniques are applied to on-site measurement in
concrete structures. In order to visually identify delaminated areas between concrete piers of a
highway structure and pre-stressed concrete (PC) panels covered are applied. Conclusions are summarized, as follows:
(1) According to the results of the radar technique, a peak amplitude of a reflected electro-magnetic wave is changed due to the delamination between PC panels and original concrete. As a visualized NDT, however, it does not seem to be readily applicable to identify the delamination inside heavily reinforced concrete.
(2) Concerning the SIBIE results obtained, one remark is found on the velocity of P wave, which was determined by the surface method and applied to the analysis. Since the velocity could be underestimated by the method, the depths of defects are sometimes underestimated.
(3) At the portions where both the surface crack and the demanination are located, both defects are visually and successfully identified by the SIBIE analysis, without the effects of reinforcing steel-bar and PC tendon in the PC panel. Thus, the SIBIE analysis has a great promise for on-site measurement and detection of internal defects in concrete structures.
REFERENCES
1. Sansalone, M. J., Streett W.B., “Impact-Echo”, Ithaca, NY Bullbrier Press, 1997.
2. Sansalone, M. J., “Impact-Echo: The Complete Story”, ACI Structural Journal, Vol. 94, No. 6, 1997, pp. 777-786.
3. Ohtsu, M., Watanabe, T., “Stack Imaging of Spectral Amplitudes based on Impact-Echo for Flaw Detection”, NDT&E International, No. 35, 2002, pp.189-196.
4. Watanabe, T., Morita, T., Hashimoto, C., Ohtsu, M., “Detecting Voids in Reinforced Concrete Slab by SIBIE”, Construction and Building Materials, Vol. 18, No. 3, 2004, pp. 225-231.
5. Ata, N., Mihara, S., Ohtsu, M., “Imaging of Un-grouted Tendon Ducts in Pre-stressed Concrete
by Improved SIBIE”, NDT & E International, Vol. 40, No. 3, 2007, pp. 258-264.
Captions of a table and figures Table 1 P-wave velocities measured Fig. 1 Aluminum bullet for a projectile.
Fig. 2 Portable compressor and a shooting device.
Fig. 3 A cross-section divided into meshes.
Fig. 4 Sketches of two concrete piers at the test site.
Fig. 5 Radar antenna and control unit Fig. 6 Measured areas at Pier 98.
Fig. 7 Pier 98 and selected points for the impact test.
Fig. 8 Pier 99 and selected points for the impact test.
Fig. 9 System for data acquisition and SIBIE analysis.
Fig. 10 Results of radar technique.
Fig. 11 SIBIE result at the point of No. 1.
Fig. 12 SIBIE result at the point of No. 2.
Fig. 13 SIBIE result at the point of No. 11.
Fig. 14 SIBIE result at the point of No. 8 (0.1 mm width).
Fig. 15 SIBIE result at the point of No. 10 (0.2 mm width).
Fig. 16 SIBIE result at the point of No. 17 (0.1 mm width).
Fig. 17 SIBIE result at the point of No. 19 (0.3 mm width).
Table 1 P-wave velocities measured Points of Measured area P-wave velocity
Nos. 1 to 6 3405 m/s
Nos. 7 to 10 3396 m/s
Nos. 11 to 14 3181 m/s
Nos. 15 to 19 3918 m/s
Fig. 1 Aluminum bullet for a projectile.
Fig. 2 Portable compressor and a shooting device.
Fig. 3 A cross-section divided into meshes.
Fig. 4 Sketches of two concrete piers at the test site.
Fig. 5 Radar antenna and control unit
Delaminated Not
delaminated
Fig. 6 Measured areas at Pier 98.
Fig. 7 Pier 98 and selected points for the impact test.
Fig. 8 Pier 99 and selected points for the impact test.
Fig. 9 System for data acquisition and SIBIE analysis.
Fig. 10 Results of radar technique.
Fig. 11 SIBIE result at the point of No. 1.
Fig. 12 SIBIE result at the point of No. 2.
1 4.5 1 3.5 1 2.5 1 1.5 1 0.5 9 .5 8 .5 7 .5 6 .5 5 .5 4 .5 3 .5 2 .5 1 .5 0 .5