Business Sentiments and Investment Behavior in Small and Medium Enterprises
著者 MATSUSHIMA Sigeru, TAKECHI Kazutaka
出版者 Institute of Comparative Economic Studies, Hosei University
journal or
publication title
Journal of International Economic Studies
volume 28
page range 37‑53
year 2014‑03
URL http://doi.org/10.15002/00009700
Business Sentiments and Investment Behavior in Small and Medium Enterprises
Sigeru Matsushima
Graduate School of Management of Science and Technology Tokyo University of Science
and
Kazutaka Takechi
Faculty of Economics, Hosei University
Abstract
This paper employs a unique firm survey dataset to investigate how subjective perceptions held by Japanese small and medium enterprises affect their real investment behavior. We identify both the usefulness of sentiments for prediction and which types of sentiment play a significant role. The results indicate that perceptions of long-term improvements in business conditions are required for manufacturing firms to invest and that the level of current business conditions, rather than their change, is a significant factor. These findings reveal the kinds of perceptions that contain useful information on economic fundamentals (or animal spirits) among the many possible forms of business sentiment.
Keywords: Business sentiments, Investment, Financial difficulties, Labor–capital substitution JEL codes: D21, D92
1 Introduction
Investment by firms is a major driving force of economic growth and business cycles. Thus, an important issue is the examination of which determinants of real investment are significant. In the macroeconomic literature, the investment decision is considered to be based on fundamentals, including capital adjustment costs and profitability shocks (for example, Lucas and Prescott, 1971;
Hayashi, 1982). In this study, we argue that subjective factors are also fundamental elements for investment decision making. For example, firms with pessimistic perceptions may be less likely to invest than they would otherwise. We address this issue using primary data on the subjective perceptions of firms.
In previous studies employing sentiment data, the basic question was whether economic agents’ perceptions or expectations are useful for predicting future economic activity and whether these sentiments affect real economic activity. In terms of findings, at least several of these respond in the affirmative; that is, consumer expectations have predictable power, and sentiments
* We would like to thank Yuji Genda and seminar participants at Hosei University, and the Small and Medium Enterprise Agency. Any remaining errors are our own. Financial support for this research was provided by a Grant-in-Aid for Scientific Research by the Japan Society for the Promotion of Sciences (Nos. 18730175 and 19330066).
*
do indeed affect business decisions (Dominitz, 1998; Jappelli and Pistaferri, 2000; Souleles, 2004;
Vuchelen, 2004; Nicholson and Souleles, 2005). However, while these studies shed useful light on an important role of expectations in terms of income and consumption, which account for a large part of the economy, yet another important element in the economy, investment, has not hitherto been extensively investigated. This may partly be because of data limitations. Using a unique survey dataset on firm sentiments, we address the basic issue of whether the business sentiments (e.g., whether business conditions will improve or worsen) held by the managers of small and medium enterprises (SMEs) affect real investment.
This paper analyzes the investment behavior of SMEs using panel data collected by the Organization for Small and Medium Enterprises and Regional Innovation, Japan (SMRJ). The data source contains various types of perceptions held by SMEs, including those concerning business and financial conditions and the level of production facilities. The SMRJ conducted the survey by administering questionnaires to SMEs about their business sentiments and investment decisions, and constructed a panel of data for 4,439 firms from 1998 to 2006. The survey questions include, for example, “Are the business conditions for your firm better this year than last year?”, “Is financing of your firm easier this year than last year?”, and “ Have you invested in the current period?” In doing so, this dataset allows us to examine which perceptions about business conditions affect real activity in the form of investment.
Because the financial data available on SMEs are not sufficient (as many SMEs are not public firms), we are unable to construct an index of fundamental value (such as Tobin’s Q). Instead, we explore the panel data characteristics by assuming that firm fundamentals are firm specific and do not change over the sample period. By controlling for unobservable firm-specific characteristics, we are then able to employ data on firm perceptions to examine whether their psychological elements are significant in the investment decision.
The estimation results indicate that in manufacturing firms, if business conditions are better in two consecutive periods, the probability of investment increases, while a one-year improvement does not. Therefore, for manufacturing firms, investment is based on improvements in long-term business conditions. This is perhaps because of the large scale of manufacturing investment, where it is necessary for these firms to build sufficient confidence regarding business conditions to undertake investment. This may also relate to conservatism (Edwards, 1968), whereby the revision of individual beliefs is typically slow.
We also find that if managers perceive the status of business conditions as being good (i.e., the level of business conditions is good), they tend to invest. On the other hand, if the level of business conditions is bad, they are unlikely to invest. These findings reveal that the levels of business conditions are significant factors for investment. The significance of the judgments regarding the levels of business conditions also suggests that firms have a reference point of business sentiment at which to invest and that the status quo provides such a reference point. This finding supports ideas about anchoring (Tversky and Kahneman, 1974). For example, firms whose reference point is good current business conditions may invest, even when they are worse off from the previous period, because the deterioration of business conditions is not sufficiently taken into account for the current decision. Because we find that some sentiments affect economic behavior but others do not, particular sentiments are closely related to the information that affects economic activities. Therefore, while we do not identify whether sentiments reflect information on economic fundamentals or some autonomous fluctuations in belief (Barsky and Sims, 2010), our study reveals the kinds of managerial perceptions that contain useful information on economic fundamentals (or animal spirits) among the many forms of business sentiments possible.
Our sentiment data include not only perceptions on business conditions but also those
concerning financial difficulties; for example, how difficult it is to borrow from the bank. As Denis (2004) found, many financial channels are available for small firms. However, in Japan, the venture capital market is not well developed, and so banking remains the major source of financing. Because credit crunches are recognized as a major problem for SME financing, several studies examine banking activities for SMEs (Berger, Klapper, and Udell, 2001; Berger, Miller, Petersen, Rajan, and Stein, 2005). For SMEs, financing costs may also vary depending on the relationship to their banks (Petersen and Rajan, 1994). As a result, SMEs confronting difficult banks may change their real investment behavior, as Hancock and Wilcox (1998) show when examining how banking behavior affects real economic activity. Therefore, in order to analyze real investment, it is necessary to incorporate the sentiments underlying borrowing.
With respect to bank borrowing, the empirical results show that if firms consider that financing has become easier, and if interest rates fall relative to the previous period, investment is more likely to take place. The magnitude of these effects is larger for easier financing than when interest rates fall, where easier financing relates to the amount able to be borrowed, while the interest rate is the price at which it is borrowed. The availability of finance is then a more important subjective element for real investment than the price of finance. This result is consistent with the fact that in our sample period, the central bank of Japan adopted a zero-interest-rate policy, and the reluctance of private banks to lend was criticized. This problem may be particularly acute for SMEs, because building close ties with banks may increase the availability of finance, not the price of finance, as shown in Petersen and Rajan (1994). Hence, financial policies affecting the quantity of loans or banks’ attitudes to lending are required to encourage investment. We also find that future expectations of reductions in interest rates have a negative impact on current investment.
Thus, firms decide whether to invest in a forward-looking manner, as Nicholson and Souleles (2005) find using data on medical students.
Another unique aspect of the data is that firms report their perceptions on the optimal level of capital and labor. Generally, it is difficult to obtain the level or optimal size and mix of labor and capital using financial data as it depends on how managers consider their business conditions. For instance, if business goes badly, they may consider their current level of capacity too great. We utilize the SMEs’ judgments on whether their capacity and labor level are excessive or limited. In the extant literature, firms adjust their capital stock level with the adjustment costs paid (Cooper and Haltiwanger, 2006). Instead of considering adjustment costs, we investigate whether the motivation for capital or labor adjustment relates to their perceptions of capacity or the level of labor. Thus, our study complements the previous literature on capital and labor adjustment.
We find that if firms consider that the firm is short of labor, they tend to invest. While capital adjustment costs are found in the literature (Cooper and Haltiwanger, 2006), we find that firms do not adjust their capital to their capacity level but rather to their employment level. This reflects the fact that it is difficult for SMEs to find employees, even if they demand more labor. Because of this, they substitute capital for labor. These findings help to illustrate the basic investment behavior nature of SMEs.
The paper is organized as follows. Section 2 introduces the dataset. In Section 3, we describe our empirical framework. Section 4 provides the empirical results. The final section concludes the paper.
2 Data
The data employed are survey data collected and compiled by SMRJ and the Research Institute of
Social Science at the University of Tokyo. The survey data are from a questionnaire of business sentiments and investment behavior. The data also contain other firm information, including the number of employees, the firm’s industry, and the prefecture where it is located. We link the responses for business sentiments and investment. Since this dataset is newly constructed by SMRJ, no study has previously examined this issue.
While our data concern Japanese SMEs, some of their characteristics are common with SMEs in other countries. In terms of the number of firms, 99 percent of firms in Japan are SMEs, employing a majority of Japanese workers (about 70 percent) and providing about half the total output (White Paper on Small and Medium Enterprises, 2008). This situation is similar to that in other countries; for example, the United States (see the U.S. Small Business Administration website (www.sba.gov)). Therefore, the behavior of SMEs and their impact on real economic activity are major issues, not only in Japan but also elsewhere. Furthermore, in terms of financial aspects, almost all Japanese SMEs rely on bank borrowing. Because financial problems are the main difficulties that SMEs face, our analysis of the impact of sentiments on financial difficulties may have similar implications in other counties where banking is also the major financing channel and venture capital markets are also not well developed, as in Japan.
The sample period is from 1998 to 2006. While SMRJ obtains the data on a quarterly basis, it employs only the April–June (first quarter) data to construct the panel data. Thus, 1998 is the first quarter of 1998. Therefore, the results obtained in this study should be treated with some caution as we do not take into account investment in other periods. We have data from 4,439 firms, including not only the manufacturing sector but also the wholesale, retail, service, and construction sectors. For the manufacturing sector, there are 1,422 firms. The questions range widely and include business conditions, changes in the number of employees, financial conditions, production facilities, and investment decisions. For example, with respect to business conditions, the question is “compared with the same period last year, are your firm’s business conditions (1. better off), (2.
unchanged), (3. worse off)?” The question on investment is “have you invested during this period?”, and the choices available are “(1. yes), (2. no).”
We construct dependent and independent variables using the survey data. Because the data on investment are discrete (yes or no), the investment decision is treated as a discrete choice. We denote the investment decision by firm i in period
t
by:1 if invest 0 otherwise Yit
®¯
This is our dependent variable. The main explanatory variables are dummy variables expressing psychological factors. There are two types of business condition perceptions: changes and levels.
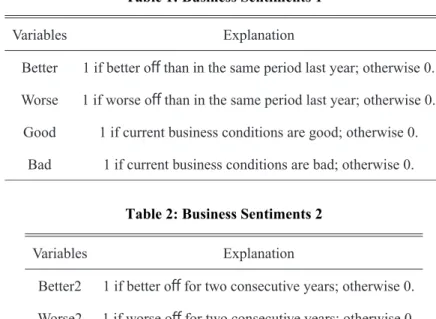
We construct the variables as follows. The variable “Better” takes a value of one if firms respond that business conditions are better when compared with the same period last year, otherwise zero.
The same period last year means that, for example, business conditions in the first quarter of 2001 are compared with the first quarter of 2000. “Worse” takes a value of one if firms respond that business conditions have worsened from the same period last year, otherwise zero. For levels,
“Good” takes a value of one if firms respond that business conditions are good, otherwise zero.
“Bad” takes a value of one if firms respond that business conditions are bad, otherwise zero. The variables are shown in Table 1. In addition, in order to consider the long-term changes in business conditions, we construct a two-period consecutive improvement and worse-off measure. These are shown in Table 2.
The differences in levels and changes in business sentiment may be significant in that the firms’ decisions may depend solely on the current condition. Even if firms are better off than in the
“INSERT Table 1 Here.”
“INSERT Table 2 Here.”
previous period, they may not invest because they do not consider that their business conditions will improve sufficiently. In particular, our sample period matches with a period of recession in Japan, and this distinction between level and changes provides us with firms’ perceptions of business conditions in greater detail.
These variables are sufficiently rich to capture the perceptions of business managers regarding the business conditions that their company faces. We can then consider these as important factors affecting investment decisions. In addition, the survey data contain firm responses concerning perceptions of the input side of investment; i.e., financing. In terms of the difficulty of obtaining long-term debt, “DebtEasy” takes a value of one if the manager responds that financing is easier than for the same period last year, otherwise zero. Similarly, “DebtHard”
takes a value of one if the manager responds that financing is more difficult than for the same period last year, otherwise zero. In addition, we account for the expectations of managers, where
“EDebtEasy” takes a value of one if the manager responds that the firm will find financing easier in the next period, otherwise zero. “EDebtHard” takes a value of one if the manager responds that it will be harder for the firm to obtain financing in the next period, otherwise zero. The finance variables are shown in Table 3.
“INSERT Table 3 Here.”
Table 1: Business Sentiments 1
Table 3: Financing Difficulties 1 Table 2: Business Sentiments 2
The survey also enables us to construct variables representing interest rate perceptions. These are not objective in the sense that the interest rate referred to is not the actual market interest rate but rather the rate that firms consider that they face when they borrow money from financial institutions. Nevertheless, these variables are more appropriate than the market interest rate because they reflect differences in each firm’s financial conditions, as argued by Petersen and Rajan (1994). With respect to interest rate changes, “IrateRise” takes a value of one if the manager responds that interest rates have risen when compared with the same period last year, otherwise zero. “IrateFall” takes a value of one if the manager responds that interest rates have fallen when compared with the same period last year, otherwise zero. Finally, the survey includes responses to a question on the expectations regarding interest rates. “EIrateRise” is an index measure of an increase in the expected interest rate in the next period, and “EIrateFall” is that of a decrease in the expected interest rate. Table 4 details these variables.
“INSERT Table 4 Here.”
The difference between whether financing is more difficult and whether interest rates have risen has an important implication. A variable such as DebtHard reflects the amount of money able to be borrowed. That is, it reflects the quantity of financing. However, a variable for interest rate change, such as IrateRise, indicates the price of raising funds. The quantity aspects of difficulty in financing may be more significant than the price (interest rate) aspects because they limit the amount borrowed, even if firms are able to pay back a loan at higher interest rates. We expect the magnitude of the effects of financing difficulty to be larger for the variables in Table 3 than for those in Table 4.
Finally, we take into account the situation where managers decide to invest so as to adjust their optimal mix of capital and labor. These data are only available for manufacturing firms.
“OptFactoryEx” takes a value of one if the manager responds that there is excess production capacity, otherwise zero. “OptFactoryShort” takes a value of one if the manager responds that there is a shortage of production capacity, otherwise zero. Similarly, “OptEmplyEx” takes a value of one if the manager responds that there is an excess of labor, otherwise zero. “OptEmplyShort”
takes a value of one if the manager responds that there is a shortage of labor, otherwise zero. By considering these factors, we are able to examine whether managers adjust their production facilities to their psychologically optimal level. Table 5 presents these variables. Because our dependent variable is investment, we can identify not only the adjustment of the capital stock but also the substitution between capital and labor, based on the subjectively optimal capacity level.
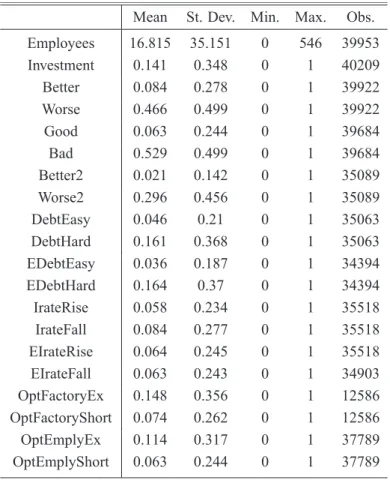
Table 6 provides summary statistics for our data. This table presents statistics of the variables denoted earlier and the number of employees. The average number of employees in our sample firms is about 17, and the maximum is 546 employees. The average investment of 0.141 indicates that about 14 percent of firms invest. While only about 8 percent of firms respond that business conditions are better than in the previous year, about 47 percent of firms consider themselves worse off. This indicates that business performance worsened, on average, for SMEs during our
Table 4: Financing Difficulties 2
“INSERT Table 5 Here.”
sample period. Similarly, the percentage responding that it has become more difficult to obtain finance is about 16 percent, while only about 5 percent of respondents find financing easier. There is not much difference between the interest rate changes, with about 6 percent responding that interest rates have risen, and 8 percent responding they have fallen. Finally, in 11 percent of firms, the number of employees is considered excessive, while 8 percent of managers respond that they face a shortage of labor. Because all firms do not respond to all questions each year, the data comprise an unbalanced panel.
“INSERT Table 6 Here.”
Table 5: Optimal Size of Labor and Capital
Table 6: Summary Statistics
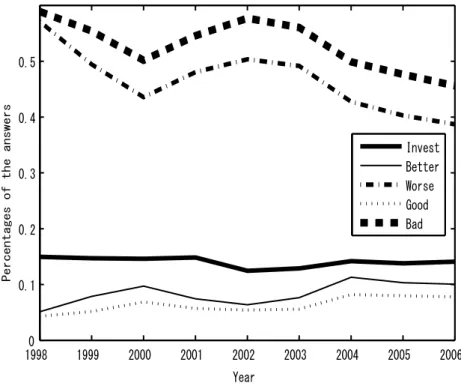
In order to obtain a basic idea about the time-series changes in these variables, we plot the average yearly values. Figure 1 depicts the probability of investment and business conditions.
These graphs illustrate that when business conditions are good or better, the probability of investment increases, and when the percentage of bad or worse conditions rises, investment falls.
It also suggests that there is a lagged effect when considering the relationship between 2000 and 2002. In 2000, the percentage of firms considering business conditions to be good or better increased, with an increased number of firms investing one year later (in 2001).
“INSERT Figure 1 Here.”
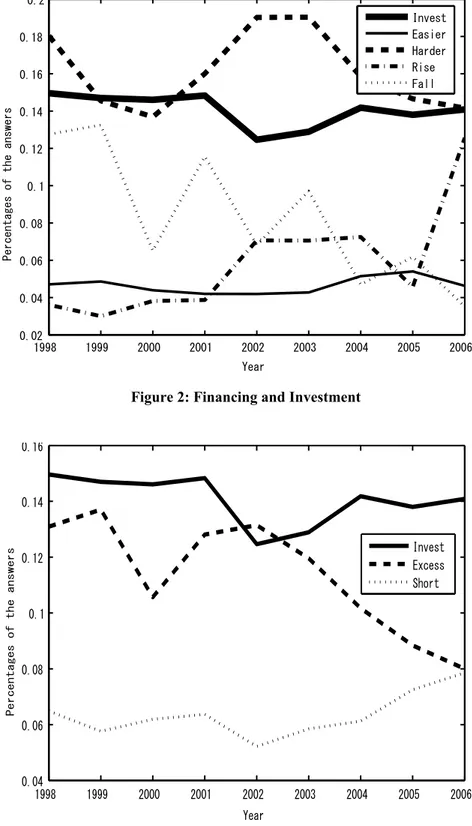
Figure 2 shows the relationship between finance and investment. “Easier” is the percentage of firms indicating DebtEasy, “Harder” is firms indicating DebtHard, “Rise” is firms indicating IrateRise, and “Fall” is firms indicating IrateFall. These relationships imply that there may be a negative relationship between financial difficulty and investment. For instance, when the percentage of firms finding finance more difficult increases (in about 2002/03), the percentage of firms with investment decreases. However, we cannot discern a clear relationship between investment and interest rates using this figure.
Finally, Figure 3 shows the relationship between labor shortage/excess and the investment decision. “Excess” is the percentage of firms indicating OptEmplyEx, and “Short” is firms indicating OptEmplyShort. This figure shows that from 2000 to 2002, the percentage of firms considering that they had an excess of labor increased, and the investment percentage decreased.
From 2002 to 2006, while the percentage of excess labor decreased and the percentage of firms short of labor increased, the investment percentage increased. Therefore, it is not clear how investment and the subjective level of optimal labor are related. This relationship will be examined in the empirical section to obtain the implications for labor–capital substitution.
In the next section, we examine empirically the effects of firm perceptions of business and financial conditions on investment behavior.
19980 1999 2000 2001 2002 2003 2004 2005 2006
0.1 0.2 0.3 0.4 0.5
Year
Percentages of the answers
Invest Better Worse Good Bad
Figure 1: Business Sentiments and Investment
“INSERT Figure 2 Here.”
“INSERT Figure 3 Here.”
1998 1999 2000 2001 2002 2003 2004 2005 2006
0.02 0.04 0.06 0.08 0.1 0.12 0.14 0.16 0.18 0.2
Year
Percentages of the answers
Invest Easier Harder Rise Fall
Figure 2: Financing and Investment
1998 1999 2000 2001 2002 2003 2004 2005 2006
0.04 0.06 0.08 0.1 0.12 0.14 0.16
Year
Percentages of the answers
Invest Excess Short
Figure 3: Optimal Employment Size and Investment (Manufacturing Firms)
3 Hypotheses and Empirical Framework
To examine the empirical relationship between sentiments and investment, we construct several hypotheses associated with each sentiment. First, when firms perceive that their business conditions are good or better during the present time, they become confident about their business.
This will lead them to engage in real investment activities.
Hypothesis 1. Positive perceptions on business conditions lead to real investment, while bad perceptions do not.
The sign of the effect of business sentiment tests this hypothesis. Second, when firms consider that they face financing difficulties, they are unable to invest. In particular, we focus on difficulties in borrowing money (the availability of funds) and the price of debt (interest rates). Thus, the hypothesis is described as follows.
Hypothesis 2. Perceptions of decreasing difficulties in the availability of finance and a decreasing interest rate lead to real investment, while those concerning increasing difficulties in the availability of finance or an increasing interest rate lead to less investment.
These are captured by the effect of the sentiments for financial difficulty and the interest rate on investment. Finally, we can address the motivation of capital adjustment using the sentiments on optimal capacity and the employment level. It is natural to consider that if firms consider that they have a shortage of capital (or an excess of labor), they adjust their capital to the optimal level by investing. We employ the following hypothesis.
Hypothesis 3. Perceptions of a shortage of capacity or an excess of labor lead to real investment.
This hypothesis will be confirmed if the effect of a shortage of capital (or an excess of labor) is positively significant. However, if the effect of a shortage of labor is positively significant, then it reflects the situation that SMEs face when it is difficult for SMEs to employ appropriate labor.
That is, capital–labor substitution takes place. In such a case, this hypothesis fails.
We now construct the empirical framework to study the above hypotheses. Because our data on investment indicate whether a firm invests, we employ a discrete choice model (for discrete choice investment modeling, see Adda and Cooper, 2003). We use a discrete choice panel data model, as do Das and van Soest (1999). However, while Das and van Soest (1999) consider the link between past realizations and expectations of consumer sentiments, we investigate the link between the judgments of past realizations and current economic behavior in the form of real investment. In this study, instead of solving the dynamic programming problem explicitly, a reduced form approach is used. Let W denote a latent variable that is a function of the determinants of real investment. If W is greater than the threshold value, 0 , firms invest, otherwise they do not. Therefore, the investment decision is expressed by:
( 0)
it it
Y I W t
where ( )I is the indicator function.
We consider that the psychological elements of managers and firm-specific factors affect Wit. Let us denote Wit WˆitWit, where ˆWit are fundamental factors, such as the size of the firm and profitability shocks, and Wit is the subjective factor held by SME managers. When we
use business sentiment variables explicitly, Wit is specified as follows:
0 1 2 3 4
ˆ it Size
it it it it it it it
W W W E E e E Better EWorse EGood
5Badit 6Better2it 7Worse2it Xit
E E E G
where Size is the number of employees, eit is the error term, Betterit is the index of better business conditions when compared with the previous year, Worseit is the index of worse business conditions when compared with the previous year, Goodit is the index of good current business conditions, Bad is the index of bad current business conditions, Better2it is the index of two consecutive years of better business conditions, Worser2it is the index of two consecutive years of worse business conditions, and Xit are other sentiment variables. The factors affecting Xit are financial aspects and optimal levels of production facilities and labor as shown in Tables 3, 4, and 5.
The first three terms (constant, Size and eit) in Equation (1) correspond to the fundamentals, ˆit
W . The error term includes unobservable firm-specific effects and an iid error term,
it i it
e P H . The unobservable firm heterogeneity term, Pi, captures firm characteristics other than size, business sentiments, and Xit. Thus, Pi corresponds to idiosyncratic profitability shocks.
For estimation, we employ a linear probability model: Yit Wit. Because we do not have many firm characteristic variables, it is important to control for firm-level heterogeneity. We control for firm-level heterogeneity using fixed effects estimation. We also use time dummies to take into account any time-specific effects. These controls enable us to identify the relationship between investment and psychological factors. For a robustness check, we employ conditional logit estimation.
4 Estimation Results
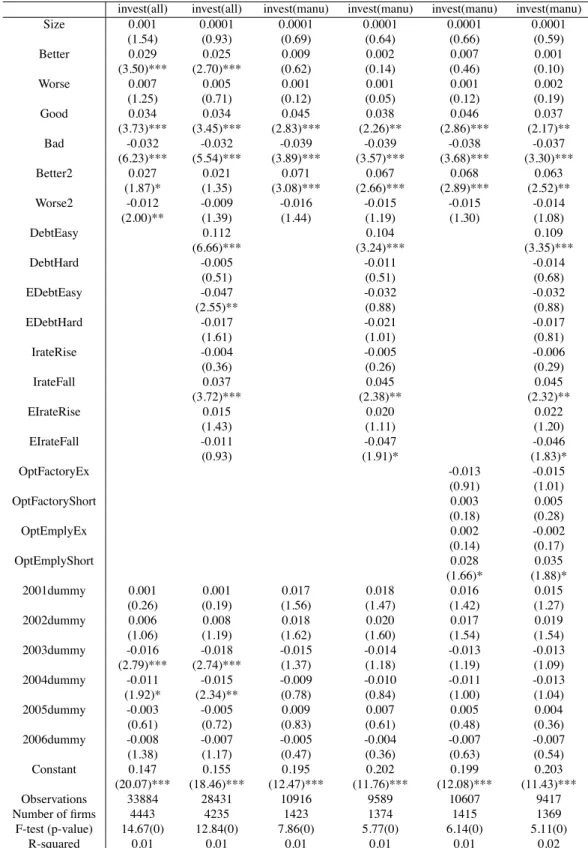
Table 7 reports the results of the fixed effects panel estimation. Columns 2 and 3 show the results using data from all industries. Columns 4 to 7 report the results using manufacturing firms only.
The results using only the business conditions variables are reported in Columns 2 and 4. The remaining columns show the results including the financial and production facilities factors.
From Columns 2 and 3 in Table 7, we find that if business conditions are better than in the previous year, the probability of investment increases. Column 2 also shows that when we employ only the business conditions variables, two consecutive years of better-off and worse-off business conditions affect the probability of investment positively and negatively, respectively. These results reveal the intuitive relationship between business sentiment and investment: firms considering their own business conditions as being better off in the long run are likely to invest, and firms considering their own business conditions as worse off in the long run are unlikely to invest. As shown in both Columns 2 and 3, the level of business conditions significantly affects investment. Our results suggest that improvements in business conditions and the level of business conditions are thus crucial for the investment decision. Therefore, when using all industry data, the results are consistent with Hypothesis 1.
Column 3 reports the results using the financial aspects. While the results are similar to Column 2, the two consecutive years’ change in business conditions (Better2 and Worse2) is insignificant. Several financial elements are significant, and the effects of long-term changes in (1)
“INSERT Table 7 Here.”
invest(all) invest(all) invest(manu) invest(manu) invest(manu) invest(manu)
Size 0.001 0.0001 0.0001 0.0001 0.0001 0.0001
(1.54) (0.93) (0.69) (0.64) (0.66) (0.59)
Better 0.029 0.025 0.009 0.002 0.007 0.001
(3.50)*** (2.70)*** (0.62) (0.14) (0.46) (0.10)
Worse 0.007 0.005 0.001 0.001 0.001 0.002
(1.25) (0.71) (0.12) (0.05) (0.12) (0.19)
Good 0.034 0.034 0.045 0.038 0.046 0.037
(3.73)*** (3.45)*** (2.83)*** (2.26)** (2.86)*** (2.17)**
Bad -0.032 -0.032 -0.039 -0.039 -0.038 -0.037
(6.23)*** (5.54)*** (3.89)*** (3.57)*** (3.68)*** (3.30)***
Better2 0.027 0.021 0.071 0.067 0.068 0.063
(1.87)* (1.35) (3.08)*** (2.66)*** (2.89)*** (2.52)**
Worse2 -0.012 -0.009 -0.016 -0.015 -0.015 -0.014
(2.00)** (1.39) (1.44) (1.19) (1.30) (1.08)
DebtEasy 0.112 0.104 0.109
(6.66)*** (3.24)*** (3.35)***
DebtHard -0.005 -0.011 -0.014
(0.51) (0.51) (0.68)
EDebtEasy -0.047 -0.032 -0.032
(2.55)** (0.88) (0.88)
EDebtHard -0.017 -0.021 -0.017
(1.61) (1.01) (0.81)
IrateRise -0.004 -0.005 -0.006
(0.36) (0.26) (0.29)
IrateFall 0.037 0.045 0.045
(3.72)*** (2.38)** (2.32)**
EIrateRise 0.015 0.020 0.022
(1.43) (1.11) (1.20)
EIrateFall -0.011 -0.047 -0.046
(0.93) (1.91)* (1.83)*
OptFactoryEx -0.013 -0.015
(0.91) (1.01)
OptFactoryShort 0.003 0.005
(0.18) (0.28)
OptEmplyEx 0.002 -0.002
(0.14) (0.17)
OptEmplyShort 0.028 0.035
(1.66)* (1.88)*
2001dummy 0.001 0.001 0.017 0.018 0.016 0.015
(0.26) (0.19) (1.56) (1.47) (1.42) (1.27)
2002dummy 0.006 0.008 0.018 0.020 0.017 0.019
(1.06) (1.19) (1.62) (1.60) (1.54) (1.54)
2003dummy -0.016 -0.018 -0.015 -0.014 -0.013 -0.013
(2.79)*** (2.74)*** (1.37) (1.18) (1.19) (1.09)
2004dummy -0.011 -0.015 -0.009 -0.010 -0.011 -0.013
(1.92)* (2.34)** (0.78) (0.84) (1.00) (1.04)
2005dummy -0.003 -0.005 0.009 0.007 0.005 0.004
(0.61) (0.72) (0.83) (0.61) (0.48) (0.36)
2006dummy -0.008 -0.007 -0.005 -0.004 -0.007 -0.007
(1.38) (1.17) (0.47) (0.36) (0.63) (0.54)
Constant 0.147 0.155 0.195 0.202 0.199 0.203
(20.07)*** (18.46)*** (12.47)*** (11.76)*** (12.08)*** (11.43)***
Observations 33884 28431 10916 9589 10607 9417
Number of firms 4443 4235 1423 1374 1415 1369
F-test (p-value) 14.67(0) 12.84(0) 7.86(0) 5.77(0) 6.14(0) 5.11(0)
R-squared 0.01 0.01 0.01 0.01 0.01 0.02
Table 7: Panel Estimation
Numbers in parentheses are the absolute values of the t-value. All estimations include time-series dummies. *, **, and ***
indicate significance at the 10, 5, and 1 percent level, respectively.
business conditions may be picked up by the financial conditions. The insignificance of the long-term changes may also be the result of our including firms across all industries. Because real investment is more important for manufacturing firms than it is for other firms in other industries, we employ the same estimations using only the data on manufacturing firms.
Columns 4 to 7 report the results using the data on manufacturing firms. These show that while improvements in business conditions when compared with the previous year do not affect investment, improvement in two consecutive years increases the probability of investment. This suggests that for the manufacturing industry, the investment decision is based on long-term performance. This contrasts with the results using data from all industries, including wholesale, retail, service, and construction firms. Because investment in manufacturing firms means that firms purchase or develop production facilities, the scale of investment may be larger than in other industries. It is then necessary to build sufficient confidence in business conditions to undertake large-scale manufacturing investment. The behavior described as conservatism (Edwards, 1968) may partly explain this result. Conservatism implies that the revision of individual beliefs is typically slow. Therefore, it is not the one-year improvement in business conditions but rather the two-consecutive-year improvement which drives real investment. Furthermore, these investment costs are sunk costs more so than in other industries. Therefore, they require a sufficient improvement in business conditions for investment to proceed. This is consistent with hysteresis behavior (Dixit, 1992), in which the existence of an option value for delaying investment creates persistent noninvestment behavior.
As Columns 4 to 7 show, while one-year business condition changes do not affect investment decision, the current business condition levels are significant factors for investment. The distinction between the level and the change of business sentiments provides an important implication, as it implies that initial psychological business conditions matter for real investment.
Put differently, firms with good current business conditions would invest, even if their business conditions became worse, while those with bad initial conditions would not invest, even if they became better. As mentioned, this behavior is consistent with anchoring (Tversky and Kahneman, 1974), where individuals’ decisions depend on their estimates relative to the initial conditions. If firms take their current status as the initial point, their decisions on investment depend heavily on current business conditions. However, note that because our data only comprise the first quarter in each year, the data coverage may bias the effects on investment. That is, as our data cannot capture investment in periods other than the first quarter, we cannot identify the effects if improvements in business conditions affect investment in subsequent periods. Nevertheless, the contrast between manufacturing and all industries reveals the specificity of investment in the manufacturing industry.
The subjective factors affecting investment include not only business sentiments but also their financial aspects. Columns 3, 5, and 7 report the results using financial aspects. In all estimations, when it is easier to borrow money and the interest rate decreases, the probability of firm investment increases. Thus, Hypothesis 2 is confirmed. That is, easier financial conditions significantly affect investment behavior. Because almost all Japanese SMEs rely on banking, this provides concrete evidence that banking affects real economic activity, as also found in Hancock and Wilcox (1998). These findings apply equally to all industries and to manufacturing industries alone, illustrating the importance of financial conditions for all types of SME. Policies mitigating financial difficulties in SMEs will then promote investment because firm investment is sensitive to perceptions regarding the availability of finance.
The magnitude of the coefficient for easier borrowing (DebtEasy) is larger than that for interest rate falls (IrateFall). This indicates that financing conditions regarding the quantity
borrowed have a larger effect on investment than the price borrowed. This is consistent with the fact that during our sample period, the Bank of Japan adopted a zero-interest-rate policy, and the reluctance of private banks to lend was often criticized. As Petersen and Rajan (1994) show, the building of close ties with banks by SMEs may increase the availability, but not the pricing, of finance. Therefore, our results suggest that financing difficulties caused by the changes in ties with banks affect perceptions on the availability of financing. From a policy point of view, financial policies affecting not only interest rates but also banks’ attitudes to lending are then required to stimulate investment.
Columns 5 and 7 show that expectations of a future interest rate decrease negatively affect current investment. This suggests that the investment decisions of managers are forward looking.
That is, firms expecting future interest rate falls refrain from investing today and may delay investment until the next period. Thus, we find that expectations of economic agents (here firms) are useful for predicting economic activities (Carroll, Fuhrer, and Wilcox, 1994; Dominitz, 1998;
Vuchelen, 2004). As the expectation of a future interest rate increase does not cause an increase in current investment, the investment choice related to future interest rate changes is asymmetric. Put differently, it is less costly not to invest than to invest. Therefore, only interest rate increases have a significant negative impact.
Finally, Columns 6 and 7 report the estimation results taking into account the optimal levels of capital and labor. The significant factor is when labor is in shortage, not a shortage of capacity (capital). This suggests that firms with labor less than the optimal level increase their probability of investment. We thus find that labor shortages are the primary motivation for capital adjustment, not capital shortages, and this has not been previously considered in the capital adjustment literature (Hayashi, 1982; Cooper and Haltiwanger, 2006). While the estimation results do not support Hypothesis 3, they may reveal the labor market conditions that SMEs face. Because workers would prefer to obtain employment in larger firms, it is difficult for SMEs to ensure that they have an adequate labor force. Hence, firms with an incentive to employ labor invest (in capital) instead of hiring (labor). This implies that the substitution between labor and capital is evidence of firms with difficulties in hiring labor.
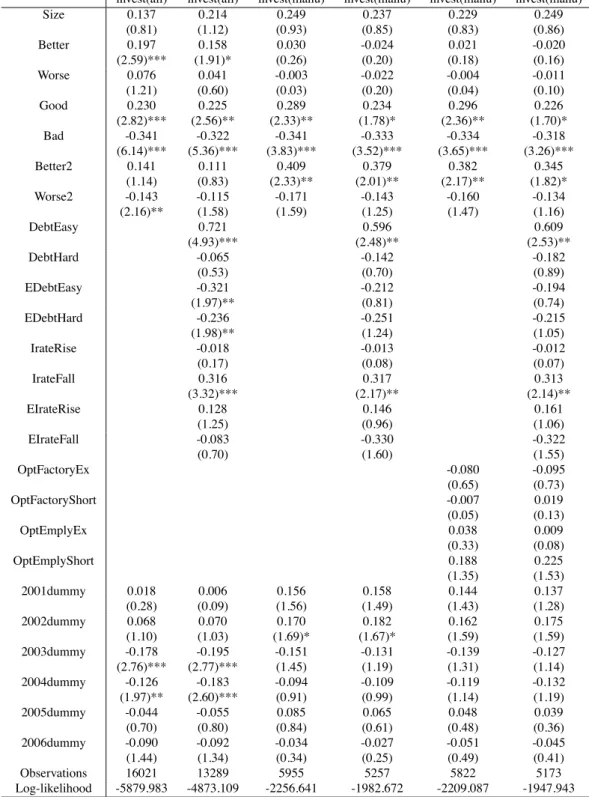
To check the robustness of our linear probability model, we also employ conditional logit estimation. Table 8 reports the estimation results of the conditional logit model. The number of observations differs from the linear probability model because the likelihood of firms not investing in any period and that of firms investing in all periods are zero. These firms were excluded from the sample. While the statistical significance of several coefficients is low, likely because of the small sample, the results are qualitatively similar to the linear probability models, thereby supporting the robustness of the results. In particular, for manufacturing firms, the effects of the long-term changes in business conditions are found to be significant.
In summary, using these results, we have shown the kinds of factors related to investment behavior. The significant relationship between business sentiments and investment reveals the important effect of psychological factors on real economic activities. Because financial conditions and interest rates significantly affect investment, the findings also suggest the importance of financial policy. Finally, the substitution between capital and labor suggests that SMEs face difficulties in ensuring an adequate labor force. This aspect is essential for analysis of the production structure in SMEs.
“INSERT Table 8 Here.”
invest(all) invest(all) invest(manu) invest(manu) invest(manu) invest(manu)
Size 0.137 0.214 0.249 0.237 0.229 0.249
(0.81) (1.12) (0.93) (0.85) (0.83) (0.86)
Better 0.197 0.158 0.030 -0.024 0.021 -0.020
(2.59)*** (1.91)* (0.26) (0.20) (0.18) (0.16)
Worse 0.076 0.041 -0.003 -0.022 -0.004 -0.011
(1.21) (0.60) (0.03) (0.20) (0.04) (0.10)
Good 0.230 0.225 0.289 0.234 0.296 0.226
(2.82)*** (2.56)** (2.33)** (1.78)* (2.36)** (1.70)*
Bad -0.341 -0.322 -0.341 -0.333 -0.334 -0.318
(6.14)*** (5.36)*** (3.83)*** (3.52)*** (3.65)*** (3.26)***
Better2 0.141 0.111 0.409 0.379 0.382 0.345
(1.14) (0.83) (2.33)** (2.01)** (2.17)** (1.82)*
Worse2 -0.143 -0.115 -0.171 -0.143 -0.160 -0.134
(2.16)** (1.58) (1.59) (1.25) (1.47) (1.16)
DebtEasy 0.721 0.596 0.609
(4.93)*** (2.48)** (2.53)**
DebtHard -0.065 -0.142 -0.182
(0.53) (0.70) (0.89)
EDebtEasy -0.321 -0.212 -0.194
(1.97)** (0.81) (0.74)
EDebtHard -0.236 -0.251 -0.215
(1.98)** (1.24) (1.05)
IrateRise -0.018 -0.013 -0.012
(0.17) (0.08) (0.07)
IrateFall 0.316 0.317 0.313
(3.32)*** (2.17)** (2.14)**
EIrateRise 0.128 0.146 0.161
(1.25) (0.96) (1.06)
EIrateFall -0.083 -0.330 -0.322
(0.70) (1.60) (1.55)
OptFactoryEx -0.080 -0.095
(0.65) (0.73)
OptFactoryShort -0.007 0.019
(0.05) (0.13)
OptEmplyEx 0.038 0.009
(0.33) (0.08)
OptEmplyShort 0.188 0.225
(1.35) (1.53)
2001dummy 0.018 0.006 0.156 0.158 0.144 0.137
(0.28) (0.09) (1.56) (1.49) (1.43) (1.28)
2002dummy 0.068 0.070 0.170 0.182 0.162 0.175
(1.10) (1.03) (1.69)* (1.67)* (1.59) (1.59)
2003dummy -0.178 -0.195 -0.151 -0.131 -0.139 -0.127
(2.76)*** (2.77)*** (1.45) (1.19) (1.31) (1.14)
2004dummy -0.126 -0.183 -0.094 -0.109 -0.119 -0.132
(1.97)** (2.60)*** (0.91) (0.99) (1.14) (1.19)
2005dummy -0.044 -0.055 0.085 0.065 0.048 0.039
(0.70) (0.80) (0.84) (0.61) (0.48) (0.36)
2006dummy -0.090 -0.092 -0.034 -0.027 -0.051 -0.045
(1.44) (1.34) (0.34) (0.25) (0.49) (0.41)
Observations 16021 13289 5955 5257 5822 5173
Log-likelihood -5879.983 -4873.109 -2256.641 -1982.672 -2209.087 -1947.943
Table 8: Conditional Logit Estimation
Numbers in parentheses are the absolute values of the z-value. All estimations include time-series dummies. *, **, and ***
indicate significance at the 10, 5, and 1 percent level, respectively.
5 Conclusion
This study investigates empirically the connection between investment behavior and psychological factors in Japanese SMEs. We employ panel data on business sentiments and investment using a survey conducted by the SMRJ. Our findings reveal the importance of business sentiments for investment decisions. In particular, and with respect to changes in business conditions, long-term improvements have a significant impact on investment by manufacturing firms. We also find that the level of business conditions is important for the investment decision. Because our findings indicate that some sentiments affect economic behavior but others do not, our study reveals what kind of perceptions contain useful information on economic fundamentals (or animal spirits).
Factors other than business sentiments, such as perceptions of the availability and conditions of finance and production facilities, also affect investment. If it is easier to finance debt and interest rates decrease, investment is likely to take place. The magnitude of the effects of easier borrowing, which is related to the quantity borrowed, is larger than for an interest rate fall, which in turn is related to the price borrowed. This relates to the fact that in Japan, the reluctance of private banks to lend has been criticized. One interesting finding is that if expectations of a future interest rate suggest a decrease in rates, firms are unlikely to invest. This is because they may adopt a delaying strategy of waiting and investing in the next period. Finally, firms experiencing a labor shortage are likely to invest. This suggests that when firms are unable to obtain an appropriately-sized labor force, they substitute capital for labor. This phenomenon may be peculiar to SMEs.
While our results can reveal the impact of psychological factors on investment choice using data on the business sentiments of SME managers, we make mention of one important issue requiring future research; namely, the data included here only comprise the first quarter in each year. Employing panel data connecting all quarters would allow us to construct expectation errors and to investigate the link between errors and investment, especially given that this link is important in the literature (for example, Nicholson and Souleles, 2005). Therefore, quarterly panel data would provide useful and deeper insights about the formation of business sentiments in firms.
References
Adda, J. and R. Copper, 2003, Dynamic Economics. MIT Press: Cambridge, MA.
Barsky, R. B. and E. R. Sims, 2010, Information, animal spirits, and the meaning of innovations in consumer confidence. NBER Working Paper No. 15049.
Berger, A. N, L. F. Klapper, and G. F. Udell, 2001, The ability of banks to lend to informationally opaque small businesses. Journal of Banking and Finance, 25, pp. 2127–2167.
Berger, A. N, N. H. Miller, M. A. Petersen, R. G. Rajan, and J. C. Stein, 2005, Does function follow organizational form? Evidence from the lending practices of large and small banks.
Journal of Financial Economics, 76, pp. 237–269.
Carroll, C. D., J. C. Fuhrer and D. W. Wilcox, 1994, Does consumer sentiment forecast household spending? If so, why? American Economic Review, 84, pp. 1397–1408.
Cooper, R. W. and J. C. Haltiwanger, 2006, On the nature of capital adjustment costs. Review of Economics Studies, 73, pp. 611–633.
Das, M. and A. van Soest, 1999, A panel data model for subjective information on household income growth. Journal of Economic Behavior and Organization, 40, pp. 409–426.
Denis, J. D, 2004, Entrepreneurial finance: an overview of the issues and evidence. Journal of
Corporate Finance, 10, pp. 301–326.
Dixit, A, 1992, Investment and hysteresis. Journal of Economic Perspectives, 6, pp. 107–132.
Dominitz, J, 1998, Earnings expectations, revisions, and realizations. Review of Economics and Statistics, 80, pp. 374–388.
Edwards, W, 1968, Conservatism in human information processing. In B. Kleinmutz (Ed.), Formal Representation of Human Judgment, pp. 17–52, New York: John Wiley and Sons.
Hancock, D. and J. A. Wilcox, 1998, The “credit crunch” and the availability of credit to small business. Journal of Banking and Finance, 22, pp. 983–1014.
Hayashi, F, 1982, Tobin’s marginal Q and average Q: A neoclassical interpretation. Econometrica, 50, pp. 215–224.
Jappelli, T. and L. Pistaferri, 2000, Using subjective income expectations to test for excess sensitivity of consumption to predicted income growth. European Economic Review, 44, pp.
337–358.
Lucas, R.E. Jr. and E. C. Prescott, 1971, Investment under uncertainty. Econometrica, 39, pp.
659–681.
Nicholson, S. and N. S. Souleles, 2005, Income prediction errors; sources and implications for physician behavior. Mimeo.
Petersen, M. A. and R. G. Rajan, 1994, The benefits of lending relationships: Evidence from small business data. Journal of Finance, 49, pp. 3–37.
Souleles, N. S, 2004, Expectations, heterogeneous forecast errors, and consumption: Micro evidence from the Michigan Consumer Sentiment Surveys. Journal of Money, Credit, and Banking, 36, pp. 39–72.
Tversky, A. and D. Kahneman, 1974, Judgment under uncertainty: Heuristics and biases. Science, 185, pp. 1124–1131.
Vuchelen, J, 2004, Consumer sentiment and macroeconomic forecasts. Journal of Economic Psychology, 25, pp. 493–506.