A comparative study on biotechnology companies in Sweden and Denmark: Why do they perform
differently?
著者(英) Yumiko Okamoto
journal or
publication title
Doshisha University Policy Studies
number 4
page range 139‑157
year 2010‑03‑08
URL http://doi.org/10.14988/pa.2017.0000012112
139
A Comparative Study on Biotechnology Companies in Sweden and Denmark: Why Do They Perform
Differently?*
岡本 由美子
Yumiko Okamoto
Abstract
Over the past decade, the biotechnology industry has grown substantially in Europe. The report of the European Commission (2007) identified both Sweden and Denmark as among the four best-performing countries in Europe. There exist many similarities between Sweden and Denmark, particularly in terms of their policy focus and scientific performance in the area of life science; however, Sweden lags behind Denmark in creating fast-growing and dynamic biotech SMEs. The present study investigates the cause of the divergence between these two countries, using the multi- level theory of the growth of the firm.
1. Introduction
Biotechnology has been identified as a priority by many European governments, because it is considered one of the key technologies that will contribute to economic performance in the twenty-first century. Moreover, in the coming years, biotechnology is expected to stay a priority area in national research & development (R&D) and in innovation policy for most European countries (European Commission 2007:94, 109).
Among European nations, Nordic countries such as Sweden and Denmark are some of the most active promoters of this emerging field. Life science and biotech- nology have been and will remain top priorities in the science and technology (S&T) policies of both countries (VINNOVA 2007, Valentin et al. 2006). This is because, as the European Commission (2007:92) found, measuring the knowledge base perfor- mance in terms of publication output and publication impact identifies Sweden and Denmark as two of the four1) best-performing countries in Europe. The same report also found that these top-performing European countries achieve even higher perfor- mance scores than the United States when it comes to scientific performance in biotechnology.
Many similarities exist between Sweden and Denmark in terms of their policy focus and their scientific performance in the areas of life science and biotechnology.
However, a couple of recent studies demonstrate the nations’ divergent performance
140
in the business and industrial development of the biotechnology sector (Valentin et al.
2006; Valentin et al. 2008; Gestrelius 2008; VINNOVA 2008). These studies showed that a relatively large number of biotech firms are established in Sweden but tend to stay small, while in Denmark a relatively small number of firms are created but tend to grow quickly.
The purpose of the study is, therefore, two-fold. One purpose is to investigate the extent to which Sweden and Denmark show the divergent evolutionary pattern of the biotech industry, including more recent data. The other purpose is to find out the causes for this divergence. A point of departure for this paper is to distinguish firm- internal factors from firm-external factors.
A comparative study of biotech firms in Sweden and Denmark seems to be important for a couple of reasons. First, so far Swedish researchers have found little support for the emergence of fast-growing and high-technology small and medium- sized enterprises (SMEs) in Sweden, regardless of the sector (Henrekson and Rosenberg 2001:216). The so-called gazelle/flyer hypothesis2) is not supported in Sweden. Instead, the SME contribution to net job creation is found to be the result of many micro start-up companies. On the other hand, Denmark is well-known for the mode of innovation dominated by fast-growing SMEs.3) It is very interesting to pinpoint the source of divergence between the two countries, using the life science and biotechnology sector as a case study.
Second, Danish biotech firms have successfully attracted unprecedented levels of attention in the globalizing biotech industry, especially within the past three or four years (Moran 2006, Ernst & Young 2008). Moran (2006) emphasizes a significant disparity between Denmark and Sweden in terms of the level of global attention. A comparative study between Sweden and Denmark may clarify the source of diver- gence and uncover a policy implication for the development of a science-based industry such as biotechnology.
Section 2, first of all, shows the similarities and the differences that exist between Sweden and Denmark in the pattern of their biotechnology industrial evolution.
For this, the author identifies Swedish and Danish biotechnology R&D-intensive companies that were newly established after 1980 and succeeded in possessing drug candidates in their pipelines by 2009, using an online database called the PharmaProjects v.5.2 on the Web.4) Then, the performance of these firms is compared between two countries both in terms of their ability to originate and advance pipeline projects, and in their ability to create jobs.5)
Section 3 reviews the theoretical literature concerning the growth of the firm, which is followed by empirical examination (Section 4). Section 5 draws conclusions regarding policy implication.
141 2. A Comparison of the Growth Performance of Biotechnology
Companies in Sweden and Denmark 2.1. Product pipeline in 2000 and 2009
Although some recent studies tend to emphasize the differences that exist between Swedish and Danish drug discovery and development firms,6) there are some similarities between these two countries. First, the number of product pipelines originating from biotechnology start-up companies increased sharply both in Sweden and in Denmark during the period of 2000-2009. As Table 1 shows, the number of biotech- nology firms possessing pipeline projects and the total number of pipeline projects themselves have expanded at all stages7) in both countries for the past decade.
Second, large molecule drug candidates as a percentage of total pipeline projects increased in both countries. Specifically, the percentage increased from 17.4 to 18.6 percent in Sweden and from 28.6 to 38.4 percent in Denmark. This is also important because the growth rate for biopharmaceuticals, or large molecule drugs, is three times higher than that for the industry as a whole.8) In other words, in the pharma- ceutical industry, demand for biopharmaceuticals is increasing more rapidly than is demand for traditional, small molecule drugs.
Swedish and Danish biotechnology companies actively engaged in drug discovery and development are also similar in their periods of establishment. Table 2 shows the number of companies by the period of establishment. Most Swedish and Danish biotechnology companies were established between the mid-1990s and the mid- 2000s.9) In both Sweden and Denmark, the biotechnology industry has grown substantially for approximately the last ten years.
Sweden 2000 18 3 1 1 23 6 3.8 17.4
Denmark 2000 11 2 8 0 21 4 5.3 28.6
Sweden 2009 81 12 25 11 129 43 3.0 18.6
Denmark 2009 84 19 29 6 138 24 5.8 38.4
Table 1 Product Pipeline in 2000 and 2009 Year Pre-
clinical
PI Total
(A)
Number of firms
(B) (A/B)
Share of biotech drugs (in percentage terms) PII PIII
Source: Author’s own calculations based on data obtained from the PharmaProjects v5.2 available online; downloaded on May 31, 2009.
142
2.2. Different pattern of industrial evolution between Sweden and Denmark The industrial structure, however, differs significantly between Sweden and Denmark in several important ways. Tables 3 and 4 compare Swedish and Danish drug discovery and development companies by the number of pipeline projects and by the size of employment, respectively.
Year Sweden Denmark
1980-1989 3 1
1990-1994 3 3
1995-1999 11 5
2000-2004 22 14
2005-2008 4 1
Total 43 24
1 Includes only firms possessing pipeline projects in 2009.
Source: Author's own calcula ons based on data from thePharmaProjects v5.2 available online, companies'
homepages, and the databases of Sweden Biotech (the largest life science news service in Scandinavia)
and Medicon Valley Alliance.
Table 2 Drug Discovery and Development
Companies1 by Period of Establishment
ti
Table 3 Biotech Companies by the Number of Pipeline Projects and Share in Total
Number of pipeline projects
Number of companies Share in total (in percentage terms)
Sweden Denmark Sweden Denmark
1 2 3 4 5 6 7 8 9 10 or above
18 5 10 2 3 2 0 0 0 3
3 4 2 4 1 0 0 4 0 6
41.9 11.6 23.3 4.7 7.0 4.7 0.0 0.0 0.0 7.0
12.5 16.7 8.3 16.7 4.2 0.0 0.0 16.7 0.0 25.0 43
Total 24 100.0 100.0
Source : See Table 2.
Table 3 shows that, in Sweden, the number of pipeline projects each firm 143 possesses is very small. Nearly 77 percent of the firms active in drug discovery and development have 3 or fewer pipeline projects, on average. In fact, Swedish biotech start-up companies possessing only one pipeline project comprise almost half of the total (42 percent). Excluding two large Swedish companies,10) almost all of the Swedish biotech firms possess six or fewer pipeline projects, on average.
Danish biotechnology firms, on average, tend to possess a significantly higher number of pipeline projects than do their Swedish counterpart. According to Table 3, more than 40 percent of total Danish biotech firms possess as many as 8 or more drug candidates in the pipeline.
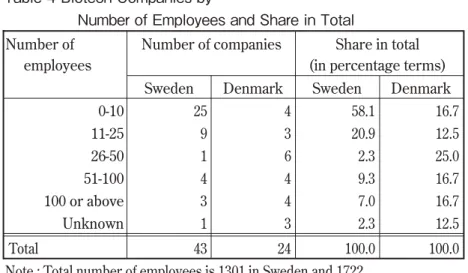
The employment structure, as observed by size of employment, also differs significantly between Sweden and Denmark. As Table 411) reveals, almost 80 percent of Swedish biotech firms concentrate in employment of 25 or fewer in 2009. Among 43 Swedish firms identified, the biggest company in terms of employment is Biovitrum, which employed 427 people in March 2009.12) However, Biovitrum is different from other Swedish firms because it was spun-out from the remains of the Stockholm-based part of Pharmacia in 2001. With the exception of Biovitrum, very few Swedish firms are growing fast. This confirms previous findings of Swedish researchers.13) That is, as of now there is little empirical evidence to support the emergence of fast-growing, high-technology start-up companies in Sweden.
On the other hand, only one-fourth of the total Danish biotechnology firms identified in this paper fall into the category of the smallest employment size (i.e.,
Table 4 Biotech Companies by
Number of Employees and Share in Total Number of
employees
Number of companies Share in total (in percentage terms)
Sweden Denmark Sweden Denmark
0-10 11-25 26-50 51-100 100 or above Unknown
25 9 1 4 3 1
4 3 6 4 4 3
58.1 20.9 2.3 9.3 7.0 2.3
16.7 12.5 25.0 16.7 16.7 12.5 43
Total 24 100.0 100.0
Note : Total number of employees is 1301 in Sweden and 1722 in Denmark in 2009.
Source : See Table 2.
144
employment of 25 or fewer). As such, by early 2009, 21 Danish biotechnology companies possessing pipeline projects have come to employ more than 1,722 people.
Those companies’ Swedish counterparts (42 companies) employ around 1,300 people.
Excluding Biovitrum, only around 800 people are employed by the Swedish biotech- nology firms identified. Danish biotech companies tend to expand employment and business opportunities much faster than their Swedish counterparts.
3. Literature Review and Analytical Framework 3.1 The theory of the firm
After long being neglected, the theory of the firm has become a significant growth industry. The industry is, however, also characterized by a substantial prolif- eration of diverse products. Most obviously, the industry is populated by two major groups: the “competence perspective” and the “governance perspective” on the firm (Foss and Mahnke 2000: 1). The former group consists of subgroups such as the
“capabilities,” “core competence,” “knowledge-based,” “resource-based,” and “dynamic capabilities” perspectives on the firm, as well as the evolutionary theory of the firm.
The latter group consists of those perspectives such as transaction cost economics, most notably associated with Williamson (1975, 1985) and such formal contract theory as agency theory and incomplete contract theory (Foss and Mahnke 2000: 1).
Both groups share an important commonality. That is, they diverge from the neoclassical economics view of the firm by rejecting the idea of the firm as a production function. Instead, they emphasize management and organization features of the firm (Williamson 2000: 35). This divergence from the neoclassical economics view is considered to be particularly important in the study of innovation – such as biotechnology – for the reason outlined below.
In standard economics, innovation models are often developed via R&D decision- making, on the basis of an R&D “production function” that entails a “hazard rate” for the incidence of success (Nooteboom 2005:116). Yet, these economic models lack credibility especially such in fields as biotechnology, because in R&D there is a high degree of uncertainty that cannot be modeled with a range of possible outcomes subject to a probability distribution. As Nooteboom (2005: 142) points out, “the crux of innovation is not so much technology as organization.”
Of the two different perspectives on the firm, however, the “competence perspective” came to occupy a central position in the innovation literature for a couple of reasons. First, the “governance perspective” on the firm does not address much of the growth, development, and diversification of firms we currently observe (Geroski 2000: 180-181). In other words, the “governance perspective” on the firm tends to be deficient in the dynamic dimension of its analysis. Second, since the “governance
145 perspective” pays little attention to dissimilar yet complementary competences among
firms, it has a hard time accounting for the spread of inter-firm networking, which is widely observed nowadays among high technology (e.g., biotechnology) firms (Foss and Mahnke 2000:14, Senker 2005:7).
3.2 Determinants of (or Limits to) the growth of the firm
The “competence perspective” on the firm goes back to the work of Penrose (1959). The central point of the perspective is that firms are seen as bundles of resources or competences, which, to a large extent, are specific to the individual firm.
It is precisely such unique competences of firms, in addition to market environment, that yield a profit (Nooteboom 2005:119). Moreover, in this perspective, those critical resources are considered to be internalized and controlled by ownership.
Penrose (1959) contributed not only to the better understanding of the firm as an economics institution, but also to the better understanding of the growth process of the firm; she did this by classifying the growth factor as internal or external to the firm. The growth of the firm may take place as a result of a sequence of changes created by a firm’s own activities. Those activities are enhanced or limited by the own internal resources of a firm, particularly the productive services available from management with experiences within the firm (i.e., internal growth factor).
Penrose (1959) also argues that the growth of the firm may be influenced by the effect of changes that are external to the firm and lie beyond its control, such as product or factor markets (external growth factor). The growth of the firm is most likely to be affected by the firm’s external environment when the firm is still small and relatively more susceptible to market forces.
The idea of the multi-level growth theory of the firm, originating from Penrose (1959), has become widely recognized in the innovation literature. For instance, Nooteboom (2005:144) argues that the study of innovation requires two levels of explanation: firm strategy and institutional environment.
Casper et al. (2005) also argues that the most promising area of innovation research is the one utilizing firm-centered approaches as applied to the comparative analysis of innovation systems. In particular, the link between macro-level institutional environments and the strategic calculus of micro-level actors (i.e., firms) begun to undergo careful examination in the area of innovation and/or institutional research.
This paper, therefore, utilizes the multi-level approach to examine what may cause the divergent growth performance between Swedish and Danish biotech firms.
146
4. Impacts of Differences in Institutional Environments on Firm Growth Performance14)
4.1 Labor market
Despite tendencies toward increasing regionalization and globalization, regions and countries remain, at least in part, institutionally embedded in their overarching nation-states, which shape innovation processes in a country-specific way (Hall &
Soskice 2001). This seems to hold true in the case of Sweden and Denmark. Despite the geographical proximity and the similarities in terms of culture, language, etc., the national innovation systems of Sweden and Denmark remain significantly different in terms of institutional set-up as well as in terms of industrial structure (Moodysson 2007:99).
One of the significant differences between Sweden and Denmark seems to lie in the institutional set-up surrounding the labor market. High participation rates, high mobility in terms of job changes, relatively generous unemployment support, considerable latitude for hiring and firing labor, and basic social security provided by a developed welfare state are some of the important characteristics of Danish labor market institutions (Christensen et al. 2008: 422). The Danish labor market is, indeed, characterized by high mobility between firms – as high or even higher than that in the U.S. (Nielsen and Lundvall 2006:164).
Although Sweden possesses some commonalities with Denmark, the former seems to differ significantly from the latter in terms of the mobility of job changes and the degree of latitude for hiring and firing labor.15)Madsen (2006), for example, showed that Denmark is at the low end of the international scale in terms of average tenure (years) for employees, along with the United Kingdom and the United States.16)
In contrast, Sweden was found to have significantly higher levels of average tenure and is actually situated at the top end of the scale, along with Japan, etc.
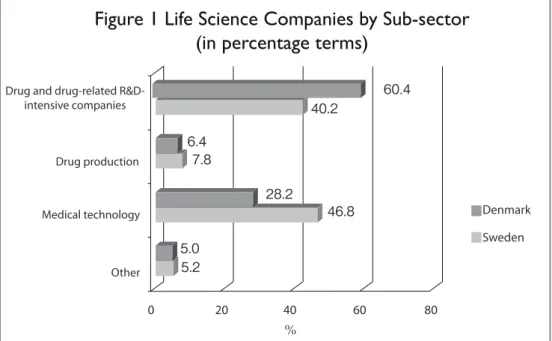
Casper and Whitley (2004) empirically showed that the relative success of high technology firms in different sub-sectors varies between countries with contrasting institutional frameworks. In liberal market economies such as the U.S. or U.K., radically innovative technology start-ups (e.g., therapeutic technologies) became dominant and successful relative to other type of biotechnology firms; this is because when technological uncertainly is high, it is difficult to predict which investments and skills will be effective, meaning firms must be able to change directions on short notice. In other words, “hire and fire” is a virtual prerequisite for the development of radically innovative technologies, such as therapeutic-based biotechnology (Casper and Whitley 2004: 94).
Biotechnology firms developing platform/medical biotechnologies, on the other hand, create a number of engineering and information technology-based applications
147 that have been used to automate many aspects of the discovery process within thera-
peutics. These medical technologies tend to have high appropriability risks created by relatively weak intellectual property regimes. Even when patents for these biotech- nologies exist, “work-arounds” are relatively common once initial innovators establish proof of principle (Casper and Whitley 2004: 94). Numerous firms end up competing within these markets. Those companies generally create complementary organiza- tional capabilities that can be protected by the firm, including assets necessary for customizing general technology platforms for specialized product niches. These platform/medical biotechnologies, therefore, tend to develop in coordinated market economies such as Germany and Sweden (Casper and Whitley 2004: 90).
Figure 1 compares the shares of biotechnology firms, by sub-sectors, between Sweden and Denmark. As the comparative institutional theorists predict, Swedish biotechnology firms are most highly concentrated in the field of medical technology, while their Danish counterparts are concentrated in the field of therapeutic or therapeutic-related technology. This empirical result indicates that Sweden has a comparative institutional disadvantage vis-à-vis Denmark in the field of therapeutic technology, as observed in Section 3.
148
4.2 Capital market
The behavior of investors seems to reinforce the Swedish comparative institu- tional disadvantage in the field of therapeutic technology or drug discovery and devel- opment. Figure 2 compares the allocation of financial resources by venture capitalists between Sweden and Denmark. The two countries show a distinctly different pattern of investment.
According to Figure 2, Denmark concentrates venture capital investment in the field of health/biotechnology,17)which is regarded as the sector with the highest uncertainty. On the other hand, Sweden invests the most in conventional, non-high technology sectors (others).18)All the more, unlike Denmark, Sweden tends to distribute more equally among three high-technology sectors (such as health/
biotechnology, IT, and communications).
The venture capital firms handle risks either by having a diversified portfolio or by developing deep industry-/technology-specific competence in a narrow field (Karaomerlioglu and Jacobsson 2000: 64). The latter strategy is particularly important for firms involved in financing at an early stage, where much of the uncertainty is related to the potential of the technology (as with therapeutic technology).
The above comparison of the pattern of venture capital investment in Sweden and Denmark seems to suggest that Swedish venture capital firms tend to take the
149 former strategy, while their Danish counterparts utilize the latter strategy. That may
put Swedish drug R&D firms at an even greater disadvantage vis-à-vis their Danish counterparts.
Somewhat paradoxically, the overall volume of venture capital in Sweden notably exceeds that of Denmark (Valentin et al. 2008:460). In fact, OECD (2008) ranks Sweden third in terms of venture capital investment as a percentage of GDP in 2006 (0.227 percent), trailing only Israel and the U.K. Denmark is ranked as the 14th among the OECD countries in the same year (0.082 percent). The comparison between Sweden and Denmark demonstrates that the volume of the venture capital industry alone does not ensure the growth of high-technology firms, such as biotech- nology firms.
5. Determinants of the Growth Internal to a Firm 5.1 The firm’s managerial resources
Penrose (1959) argued that the limit to the growth of a firm is set by the capacity of the firm’s managerial resources, as well as by the factors external to a firm mentioned above. The capacity of management in each firm, in turn, depends on the human resources and the knowledge that members of the management team possess.
This collection of resources and knowledge is the foundation for identifying business opportunities and pursuing them in a profitable manner, which then leads to growth (Saemundsson and Dahlstrand 2005: 115).
Central management of the firm, which is the highest authority within the framework of the company, is made up of some combination of the board of directors or committees thereof, the president, and the firm’s general managers (Penrose 1959: 16). Unlike the U.S. and the U.K., in which the total management of the firm’s activities is under the control of a board with a very powerful chairman (who is often also the firm’s CEO (a one-tier system)), in the case of Scandinavian countries and in almost all continental Europe, the total responsibility of the firm’s activities is delegated from the board to the executives (i.e., a two-tier system) (Mansouri 2008:
23). Thus, the current paper compares the characteristics of the board members of Swedish and Danish biotechnology firms.
5.2 A comparison of the board members in Sweden and Denmark
A comparison is made mainly from two aspects. One is the degree to which foreign members participate in a board. Since the biotech industry has been substan- tially globalized, the participation of foreign board members could play an instru- mental role in the firm’s establishment of a global network and its expansion of business opportunities.
150
The other is to identify the sector each board member represents. As the business opportunities that board members can identify are mainly based on their prior knowledge, it is important to identify what sort of knowledge is sought in each firm.
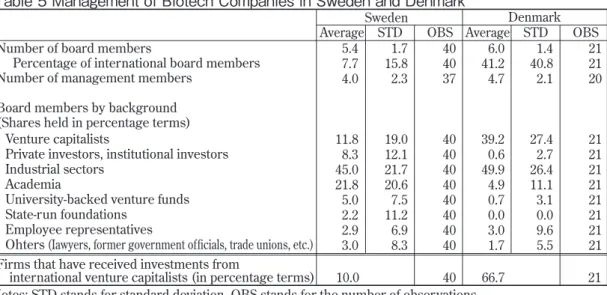
Table 5 compares the board members of Swedish and Danish drug discovery and development firms identified in Section 2. First of all, it is important to point out that there are several commonalities between the two countries. That is, in both nations, 5 to 6 members sit on the board and 4 to 5 people are delegated as executive managers from the board. Second, industrialists with extensive managerial experi- ences comprise most of the board-member positions in both countries (45 percent in Sweden and 50 percent in Denmark on average).
Three distinct differences, however, exist between Swedish and Danish board members of biotechnology firms (Table 5). First, more than 41 percent of the board members are international in Danish biotech firms: 56 out of 126 total board members are foreign; in other words, on average, 2 out of 6 board members in each firm are non-Danish.19) On the other hand, very few foreign members sit on the board of Denmark’s Swedish counterparts (only 17 out of 222 total board members are foreign).
The composition of the board members is also very different between the two countries. The venture capitalists comprise the second largest share of the board Table 5 Management of Biotech Companies in Sweden and Denmark
Number of board members
Percentage of international board members Number of management members
Board members by background (Shares held in percentage terms)
Firms that have received investments from
international venture capitalists (in percentage terms)
Notes: STD stands for standard deviation, OBS stands for the number of observations.
Source: Author’s own calculations based on information and data obtained from the web-site of each company.
Information about several companies was also obtained through personal interviews.
Venture capitalists
Private investors, institutional investors Industrial sectors
Academia
University-backed venture funds State-run foundations
Employee representatives
Ohters (Iawyers, former government officials, trade unions, etc.)
Sweden
Average STD OBS Average STDDenmark OBS 5.47.7
4.0
11.88.3 45.021.8 5.02.2 2.93.0
15.81.7 2.3
19.012.1 21.720.6 11.27.5 6.98.3
4040 37
4040 4040 4040 4040
41.26.0 4.7
39.20.6 49.94.9 0.70.0 3.01.7
40.81.4 2.1
27.42.7 26.411.1 3.10.0 9.65.5
2121 20
2121 2121 2121 2121
10.0 40 66.7 21
151 members in Denmark (39.2 percent on average). Additionally, two thirds of the total
number of Danish biotechnology firms are invested in by international venture capital firms (Table 5).
On the other hand, representatives from academia occupy the second-largest share in Sweden. The venture capitalists occupy only 11.8 percent of the board of Swedish biotechnology firms on average. Moreover, only 10 percent of total Swedish biotechnology firms are invested in by international venture capitalists. Also, board members of the Swedish biotech firms tend to originate from much wider sectors of the society than do their Danish counterparts.
The above analysis seems to suggest that Danish firms tend to grow quickly primarily or partly because they learn and develop new knowledge through resources available internationally in the field of biotechnology, by both actively engaging inter- national expertise on the board and by actively seeking international venture capital investment. The international business strategy seems to have put Danish drug discovery and development firms at an advantage over their Swedish counterparts.
Swedish biotech firms are also considered to be at a disadvantage vis-à-vis their Danish counterparts because members with very different backgrounds tend to sit on the board. The Herfindahl-Hirschman Indexes (HHI)20) of the share of board members by their background are 0.28 in Sweden and 0.41 in Denmark, respectively.
This reveals that the board members of Swedish biotech firms tend to represent the wider interests of the society. That may create some difficulties in reaching a consensus in the process of building a business strategy among board members, especially at the early stage of development.
6. Conclusion and Policy Implication
The biotechnology industry has grown substantially in Europe during the last decade. The report of the European Commission (2007) identified both Sweden and Denmark as among the four best-performing countries in Europe. They were found to achieve even higher performance scores than the United States in terms of scientific performance in biotechnology.
Despite so many similarities between Sweden and Denmark in terms of policy focus and scientific performance in the area of life science, a couple of recent studies pointed out the divergent business development of their biotechnology industries.
Using more recent data, the author investigated the degree to which they diverge in their pattern of industrial evolution. She also examined the causes of their diver- gence. The point of the departure for this paper was to use the multi-level approach to examine the growth process of the firm.
The author found, first of all, that Sweden lags behind Denmark in creating
152
fast-growing and dynamic biotech SMEs. A larger number of drug discovery and development firms tend to be established, but a large percentage of firms remain micro-level in Sweden. Moreover, Danish biotech SMEs show a higher capability for generating jobs in the biotechnology sector than do their Swedish counterparts.
The author argued that the institutional set-ups surrounding the labor and capital markets tend to turn against the growth of Swedish drug discovery and development companies in favor of their Danish counterparts, especially in the field of therapeutic technology. This implies that, in contrast to the implication of neo-classic economic theory, it may not be possible to develop a model of an optimal innovation system.21)
Some growth factors internal to the firm such as business strategy, however, could be an important lesson for Swedish biotechnology firms. The author showed that firm-internal factors seemed to have made a significant difference in the subse- quent firm performances of Sweden and Denmark. In this respect, Sweden could learn from Denmark in generating a more vibrant biotechnology sector.
References
Alligator Bioscience AB (2008), “Description of activities 2008,” a company report.
Casper, Steven and Richard Whitley (2004), “Managing competences in entrepre- neurial technology firms: a comparative institutional analysis of Germany, Sweden and the UK,” Research Policy 33: 89-106.
Casper, Steven; J. Rogers Hollingsworth and Richard Whitley (2005),
“Varieties of capitalism: comparative institutional approaches to economic organi- zation and innovation,” in Steven Capster and Frans van Waarden, (eds), Innovation and Institutions: A Multidisciplinary Review of the Study of Innovation Systems.
Cheltenham: Edward Elgar.
Christensen, Jesper Lindgaard; Birgitte Gregersen; Bjorn Johnson; Bengt-Ake Lundvall and Mark Tomlinson (2008), “An NSI in transition? Denmark,” in Charles Edquist and Leif Hommen (eds), Small Country Innovation Systems: Globalization, Change and Policy in Asia and Europe. Cheltenham: Edward Elgar.
Davidsson, Per and Frederic Delmar (2006), “High-growth firms and their contribution to employment: the case of Sweden 1987-96,” in Per Davidsson;
Frederic Delmar; and Johan Wiklund (eds), Entrepreneurship and the growth of firms.
Cheltenham: Edward Elgar.
153 Ernst & Young (2008), Biotech in Denmark 2008: Growing stronger. Copenhagen:
Ernst & Young.
European Commission (2007), Biopolis: Inventory and analysis of national public policies that stimulate biotechnology research, its exploitation and commercialization by industry in Europe in the period 2002-2005:Final Report. Belgium: European Communities.
Foss, Nicolai, and Volker Mahnke (2000), “Advancing Research on Competence, Governance, and Entrepreneurship,” in Nicolai Foss and Volker Mahnke, (eds), Competence, Governance, and Entrepreneurship: Advances in Economic Strategy Research. Oxford: Oxford University Press.
Geroski, Paul A. (2000), “The Growth of Firms in Theory and Practice,” in Nicolai Foss and Volker Mahnke, (eds), Competence, Governance, and Entrepreneurship:
Advances in Economic Strategy Research. Oxford: Oxford University Press.
Gestrelius, Stina (2008), Why is Danish Life Science Thriving? A case study of the life science industry in Denmark. Stockholm: VINNOVA.
Hall, Peter A. and David W. Soskice (2001), “An Introduction to Varieties of Capitalism,” in Peter A. Hall and David Soskice (eds), Varieties of Capitalism: The Institutional Foundations of Comparative Advantage. Oxford: Oxford University Press.
Henrekson, Magnus, and Nathan Rosenberg (2001), “Designing Efficient Institutions for Science-Based Entrepreneurship: Lesson from the US and Sweden,”
Journal of Technology Transfer 26: 207-231.
Karaomerlioglu, Dilek Cetindamar and Staffan Jacobsson (2000), “The Swedish venture capital industry: an infant, adolescent or grown-up?,” Venture Capital 2 (1):
61-88.
Madsen, Per Kongshoj (2006), “How Can It Possibly Fly? The Paradox of a Dynamic Labor Market in a Scandinavian Welfare State,” in John L. Campbell; John A.
Hall; and Ove K. Pedersen (eds), National Identity and the Varieties of Capitalism: The Danish Experience. McGill-Queen´s University Press.
Mansouri, Zia (2008), Governing Innovation: Internet and Renewal in Swedish Banks.
154
Molndal: PR-Offset AB.
Moodysson, Jerker (2007), Sites and Modes of Knowledge Creation: On the Spatial Organization of Biotechnology Innovation. Lund: Lund University Press.
Moran, Nuala (2006), “Danish biotech outperforms its European counterparts,”
Nature Biotechnology 24 (12): 1460-1461.
Nielsen, Peter and Bengt – Ake Lundvall (2006), “Learning Organizations and Industrial Relations: How the Danish Economy Learns,” Edward Lorenz and Bengt-Ake Lundvall, (eds). How Europe´s Economies Learn: Coordinating Competing Models. Oxford: Oxford University Press.
Nooteboom, Bart (2005), “Innovation, Organizational learning and institu- tional-economics,” in Steven Capster and Frans van Waarden (eds), Innovation and Institutions: A Multidisciplinary Review of the Study of Innovation Systems.
Chelthenham: Edward Elgar.
OECD (2008), OECD Science, Technology and Industry Outlook. Paris: OECD.
Penrose, Edith (1959), The Theory of the Growth of the Firm. Oxford University Press.
Saemnndsson, Rognvaldur and Asa Lindholm Dahlstrand (2005), “How Business Opportunities Constrain Young Technology-Based firms from Growing into Medium-Sized Firms,” Small Business Economics 24: 113-129.
Senker, Jacqueline (2005), “Biotechnology Alliances in the European Pharmaceutical Industry: Past, Present and Future.” SPRU Electronic Working Paper Series. No.137.
Valentin, Finn; Henrich Dahlgren; and Rasmus Lund Jensen (2006), “Structure, Employment and Performance in Biotech Firms: Comparison of Danish and Swedish Drug Discovery Firms,” Biotech Business Working Paper No. 05-2006.
Valentin, Finn; Rasmus Lund Jensen; and Henrich Dahlgren (2008), ”How Venture Capital Shapes Emerging Bio-clusters ? A Cross-country Comparison,”
European Planning Studies 16(3): 441-463.
155 VINNOVA (2007), National and regional cluster profiles: Companies in biotechnology,
pharmaceuticals and medical technology in Sweden (VINNOVA Analysis VA 2007:16).
Stockholm: VINNOVA.
VINNOVA (2008), National and regional cluster profiles: Companies in biotechnology, pharmaceuticals and medical technology in Denmark in comparison with Sweden (VINNOVA Analysis VA 2008:10). Stockholm: VINNOVA.
Williamson, Oliver E. (1975), Markets and hierarchies, analysis and antitrust impli- cations: a study in the economics of internal organization. New York: Free Press.
Williamson, Oliver E. (1985), The Economic institutions of capitalism: firms, markets, relational contracting. New York: Free Press.
Williamson, Oliver E. (2000),”Strategy Research: Governance and Competence Perspectives,” in Nicolai Foss and Volker Mahnke (eds), Competence, Governance, and Entrepreneurship: Advances in Economic Strategy Research. Oxford: Oxford University Press.
Notes
1) Sweden, Denmark, Switzerland, and Finland
2)) While most researchers agree on the importance of SMEs, there is some contro- While most researchers agree on the importance of SMEs, there is some contro- While most researchers agree on the importance of SMEs, there is some contro- versy with respect to whether their role in job creation is mainly a result of many small start-ups and incremental expansions, or if a small minority of high growth SMEs contribute the lionʼs share of new employment. The gazelle/flyer hypothesis takes the latter position. See Davidsson and Delmar (2006) for the details.
3) See, for instance, Christensen (2008) for the details.
4) As such, incumbent and established Danish firms such as Novo Nordisk, Lundbeck, ALK-Abello, Leo Pharma, Novozymes and a Swedish firm such as Meda are excluded from the analysis.
5) This paper analyzes only drug discover y and development (R&D) firms possessing product candidates in pipeline, because employment directly related to biotechnology is visible and identifiable in firms that are active and focused on drug and drug-related R&D. This paper, however, examines both biopharmaceu- tical (large molecule drug discovery and development) and non-biopharmaceu- tical (small molecule drug discovery and development) companies because very
156
few pharmaceutical companies develop new drugs without using biotechnological tools these days (VINNOVA 2007).
6) See, for instance, Valentin et al. (2006).
7) Pre-clinical, clinical I, clinical II, and clinical III.
8) See Alligator Bioscience (2008), “Description of activities 2008,”a company report.
9) 77 percent of total Swedish firms and 79 percent of total Danish firms identified were established between 1995 and 2004.
10) Two firms (Biovitrum and Medivir) were established through spin-out from Pharmacia and Astra. These two firms are different from other Swedish biotech- nology companies because they had rights on patents, compounds, and research results transferred from their parent companies from the outset. See their companiesʼ homepages.
11) As for the size of employment, the latest information available as of May 31, 2009 was utilized. If the employment size is not available for the year of 2009, the 2008 year-end size of employment was used instead.
12) See Interim Report 1st January - 31st March, 2009 on http://www.biovitrum.com 13) See, for instance, VINNOVA (2008), Henrekson and Rosenberg (2001).
14) The differences in institutional environments, such as in labor and capital markets, are considered to arise partly from the historical differences between two countries in terms of industrial structure and the degree of ownership concentration. How history matters in shaping the subsequent institutional devel- opment will be left for future research.
15) See Henrekson and Rosenberg (2001: 222-223) for the details of the character-See Henrekson and Rosenberg (2001: 222-223) for the details of the character- istics of the Swedish labor market institutions.
16) See Figure 7 in Madsen (2006:332).
17) 57.7 percent of total venture capital investment.
18) 64.4 percent of total venture capital investment.
19) Interestingly enough, as many as 13 out of 56 foreign members sitting on the board of 21 Danish biotech firms are Swedish and comprise the biggest foreign group.
20) The higher number of HHI means the higher level of concentration. HHI = ∑(S2), where S represents the share of each component.
21) This point is emphasized by Economic Commission (2007) as well.
* Funding from the Japan Securities Scholarship Foundation (Nihon Shoken Shogaku Zaidan) is acknowledged. This paper was written while the author was affiliated with Department of Economics, Gothenburg University, Sweden as a visiting researcher between March 29, 2009 and August 29, 2009. The author would like
157 to express a deep appreciation to Professor Arne Bigsten and to the Department
of Economics, Gothenburg University for her acceptance as a visiting researcher during the above period. The author also would like to thank Professor Arne Bigsten, Professor Johan Lonnroth, Professor Jorgen Lindgaard Pedersen, and Dr.
Jacqueline Senker for useful comments on the earlier draft. But, the remaining errors are entirely the author’s responsibility.