Electric Power Management with Advanced Information Utilization
- For Sustainable Smart Grid Realization with Profitable Business Models -
2015 1
Ken Kuroda
Electric Power Management with Advanced Information Utilization
- For Sustainable Smart Grid Realization with Profitable Business Models -
2015 1
Ken Kuroda
been conducted all over the world for several years. One of major purposes of Smart Grid is to realize optimal electric power system by the transition to the collaborative operation between power supply and demand using information communication technology (ICT). In order to enhance existing power system, which is already one of important social infrastructure, into Smart Grid, enormous and long term investment would be required, however, it looks the benefit of Smart Grid is unclear yet and related markets are not in rapid expansion. Therefore, it is necessary to clarify profitable Smart Grid measures and to promote investments and their recovery by many business enterprises for accelerating Smart Grid realization.
Therefore, this dissertation concerns critical components of Smart Grid including their implementation measures and technologies, provides various benefits and cost quantification methods, and proposes expected business models with these critical components and their evaluation methods. Thorough this study, the profitability of installation measures and effective utilization of ICT were focused to realize, continue and enlarge the critical components of Smart Grid.
As the result of the study, important challenges were clarified and their solutions were discussed. The followings are major clarifications. Firstly, the holistic optimization of power systems in demand-side was considered and proposed quantification methods for holistic and periodical installation effects of Smart Grid components. In addition, evaluation methods of Smart Grid components were proposed for the consideration of the near future power market in Japan. Secondly, two types of evaluation methods for Smart Grid components were proposed. The first one is the method which should prioritize profitability for business sustainability and expansion, and another one is the methods which should choose the best solution considering multi-objectives which have trade-off relations each other such as installation effects versus costs etc. Lastly, a value circulation model between power supply and demand sides was proposed and it was showed that value exchanges between them were possible virtually by the utilization of ICT, and environmental conditions which activated value creation were also provided.
Special thanks are due to my supervisor Professor Ryuichi Yokoyama, at Waseda University Graduate School of Environment and Energy Engineering, for his support, patience, and consistent encouragement throughout my doctorial study. His technical and academic advice was essential to the completion of this dissertation. I also would like to thank the other members of my review committees, Professor Masafumi Katsuta and visiting Professor Yosuke Nakanishi, at Waseda University, for their helpful comments during the thesis review process.
I want to thank Dr. Hideki Magori, invited researcher at the Yokoyama Laboratory.
His expertise and advice have been extremely valuable, and without them this work would not have been possible. I would also like to thank the staff at the Yokoyama Laboratory, Professor Kenji Iba, visiting senior researcher (Meisei University), Dr. Daisuke Yamashita, junior researcher, for their a lot of precious advice, and special thanks to our administrative staff Mrs. Yuko Inaba and Mrs. Hiroko Kano for their support of this three year research work and guidance of the doctoral review procedures. I am also grateful to Mr. Yasuo Sato, ARK Information Systems for giving me his recommendations to the doctor course in Yokoyama Laboratory and many supports.
Over the past three years I have been extremely fortunate to receive both technical and financial support from Fujitsu Limited. I would like to thank Mr. Kenichi Yamagishi, the former head of Smart City & Energy Promotion Unit, and Teruyuki Sato, vice president of Smart City & Energy Promotion Unit, for giving me their recommendation of the doctor course entrance and this research opportunity in parallel with ordinary business activities.
My profound gratitude goes to Dr. Tomiyasu Ichimura, senior director at Smart City &
Energy Promotion Unit, for allowing me the opportunity to discuss research topics, problem definitions and solution methodologies in this work and without his support and lead, this work would not have been completed. I also wish to thank my colleagues in Fujitsu Limited and Fujitsu Laboratories Limited, Dr. Zhou Yicheng, Dr. Hideyuki Kikuchi, Mr. Yuichi Matsufuji, Mr. Tetsuya Kashiwagi, Mr. Yuji Mezaki and Mr. Daisuke Kobayashi.
Finally, my special thanks go to my friends and family, all of whom have given me endless encouragement and support throughout. This dissertation is dedicated to them.
Ken Kuroda January 2015
Abstract... ii
Acknowledgements ...iii
Table of Contents... iv
List of Tables ... ix
List of Figures ... xi
Abbreviations ...xiv
Chapter 1 Introduction ... 1
Background and Context to This Study... 1
1.1. Smart Grid and Advanced Power System ... 2
1.2. Aims of This Study... 5
1.3. Structure of This Paper ... 6
1.4. Chapter Reference... 9
Chapter 2 Critical Components to Realize Smart Grid and Contribution of Information Communication Technology...10
Smart Grid as Future Power Systems...10
2.1. 2.1.1. Smart Grid Demonstration Projects...10
2.1.2. Smart Grid and ICT Solutions ...11
Clarification of Smart Grid Critical Components...12
2.2. 2.2.1. Clarification Approach of Smart Grid Critical Components...12
2.2.2. Definition of Smart Grid Benefits and Beneficiaries...14
2.2.3. Technological Measures to Realize Smart Grid Benefits...16
2.2.4. Creating Actions in Smart Grid Projects ...20
ICT Contribution Areas for Smart Grid ...21
2.3. 2.3.1. ICT Value Provision Model...21
Base ICT Smart Grid Technologies ...25
2.4. 2.4.1. AMI Solution as Smart Grid Infrastructure...25
2.4.2. CEMS as a Smart Grid Infrastructure ...30
Key Technical Research Topics for Realizing Smart Grid...34
2.5. 2.5.1. Key Research Topics...34
2.5.2. The Stance of This Study for Business Profitability...35
Summary...36
2.6. Chapter References...38
Chapter 3 Demand-side Optimal Power Supply ...40
Expectations for Demand-side Optimal Power Supply Technologies...40
3.1. Optimal Power Asset Allocation in Demand-side for Advanced 3.2. Power Supply...41
3.2.1. Studies and Approaches for Power Loss Reduction ...42
3.2.2. Approach to Recognize Optimal Location and Sizing of DG Installation ...42
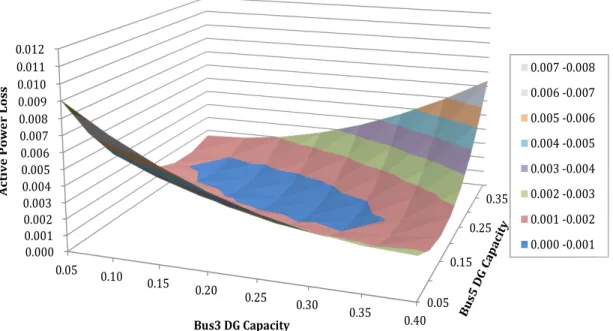
3.2.3. Simulations and Consideration of the Simulation Results...48
3.2.4. Simulation of Power Loss Reduction Effects by Multiple DGs Allocation...52
3.2.5. Solution Method of Optimal Allocation of DG Problem for a Real-size Distribution System ...54
Impact Quantification of Renewable Energy Sources Using 3.3. Stochastic Approach ...62
3.3.1. Studies and Approaches for Quantifying the Impact of RES...63
3.3.2. Impact Quantification Using Stochastic Approach...63
3.3.3. Simulation Results and Discussion...66
Summary...73
3.4. Chapter References...75
Chapter 4 Demand-side Optimal Power Utilization...78
Demand-side Energy Management Systems ...80
4.2. 4.2.1. Overview of Energy Management Systems and Studies for Energy Saving ...80
4.2.2. Studies of Energy Saving Using EMS...82
4.2.3. Current Status of Consumer-side EMS...83
4.2.4. Approach for Benefit Quantification of Consumer-side EMS Installation ...85
4.2.5. Challenges for the Expansion of Consumer-side EMS...89
4.2.6. Consideration of Evaluation Method for Effective Consumer-side EMS Installation...92
4.2.7. Information Communication to Promote Consumer-side EMS ...94
Demand Response (DR) ...96
4.3. 4.3.1. Previous Studies and Systematical Reorganization of DR Programs...96
4.3.2. Current Status of DR Penetration...99
4.3.3. Effects of DR Programs... 101
4.3.4. Approach for Effective DR Programs in Japan ... 105
4.3.5. Information Communication to Promote DR Programs for Small Size Consumers... 107
Summary... 109
4.4. Chapter References... 111
Chapter 5 Optimal Supply and Demand Collaboration for Power Service Provision... 113
Expectations for Collaborative Operation between Supply and 5.1. Demand sides... 113
Collaborative Operation for Low Carbon Society in Japan... 114
5.2. 5.2.1. Characteristics of Japanese Distribution Systems and Their Challenges... 115
5.2.2. Voltage Issues in Distribution Systems and Their Previous Studies ... 116
5.2.4. Consideration of Implementing Functions for Distribution Systems Voltage Management through Prototype System
Development... 121
5.2.5. Assumed Business Cases Using the Proposed Distribution Systems Voltage Management ... 126
Outage Management System and Metering Data Utilization ... 128
5.3. 5.3.1. Definition of Outage Management and Procedures... 128
5.3.2. Utilization of Metering Data for Outage Management... 129
5.3.3. Consideration of New Approaches for Outage Management Utilizing Metering Data... 130
5.3.4. Simulations for Effective Outage Management Utilizing Metering Data... 132
5.3.5. Simulation of Visualization Support Approaches and Discussions ... 137
Summary... 142
5.4. Chapter References... 144
Chapter 6 Evaluation Methods of Smart Grid Components Considering Business Profitability... 146
Quantification Method for Periodical Benefits of Smart Grid 6.1. Realization Activities ... 146
6.1.1. Quantification of Annual Power Loss Reduction Benefit by Demand Reduction... 146
6.1.2. Benefit Quantification of PV Installations ... 150
Optimization Method Focusing on Profitability ... 153
6.2. 6.2.1. Studies for the Relation between Energy Consumption and Productivity ... 153
6.2.2. Formulation of Earning Structure... 153
6.2.3. Simulation Approach... 153
6.2.4. Simulation Execution and Results Evaluation ... 157
Multi-objective Optimization Methods Considering Optimization 6.3. Problems in Power Distribution Systems ... 162
6.3.2. Single Objective Optimization Problems and Their Studies... 162
6.3.3. Multi-objective Optimization Problems and Their Studies ... 165
6.3.4. Effective Optimization Method in Power Distribution Systems ... 168
6.3.5. Simulation of Single-objective Optimization ... 172
6.3.6. Multi-objective Optimization Problems in Power Systems... 176
Summary... 181
6.4. Chapter References... 182
Chapter 7 Conclusions... 185
Achievements of This Study... 185
7.1. 7.1.1. Topics Covered in This Dissertation... 185
7.1.2. Smart Grid Added-value Circulation Model and Their Optimal Evaluation Method... 186
7.1.3. Summary of Achievements and Contributions... 188
Avenues of Future Research ... 190
7.2.
APPENDICES... 193
APPENDIX A Publications and Presentations ... 193
Refereed Papers... 193
Oral Presentation... 195
Other Papers... 195
APPENDIX B Smart Grid Definition by METI (in Japanese)... 197
APPENDIX C Distribution System Model Parameters in [3-12] ... 197
APPENDIX D Meter Property Data Used in the Simulation in 5.3 ... 199
Table 2-1 Summary of Reorganized Smart Grid Benefits Defined in [2-1]...14
Table 2-2 Actions for Critical Components in Smart Grid Projects and Their Objectives...21
Table 2-3 Challenges for the Network Establishment in AMI ...25
Table 2-4 Major RF Mesh Routing Methods ...27
Table 2-5 Proposed Ad-hoc Technology ...28
Table 2-6 Ad-hoc Technology Applicable Areas ...30
Table 2-7 CEMS Required Functions ...31
Table 2-8 Rapid Data Processing Methods in CEMS...33
Table 2-9 ICT Contribution Topics for Critical Technological Measures for Smart Grid ...35
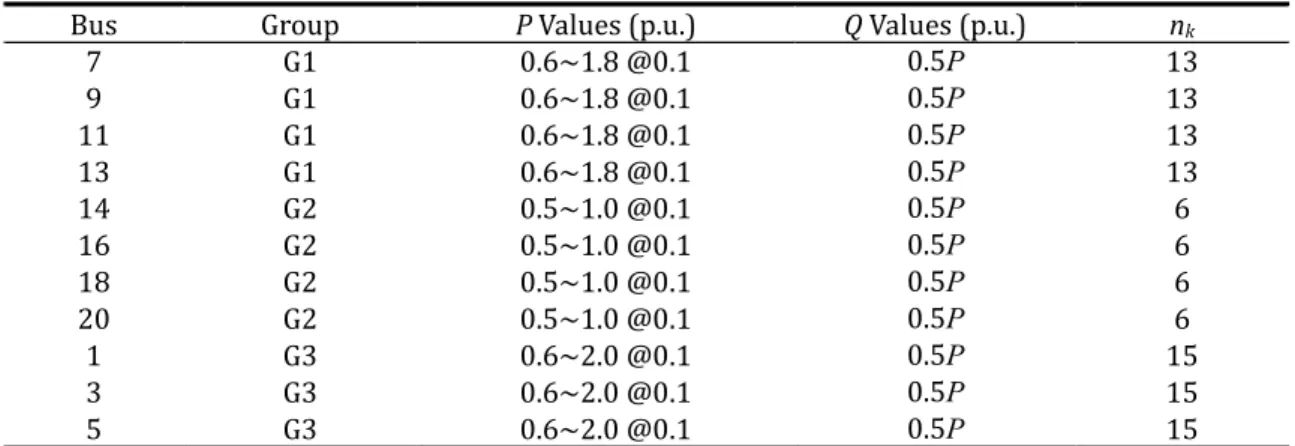
Table 3-1 Types and Capacity of DGs...45
Table 3-2 Bus Data ...47
Table 3-3 Branch Data ...47
Table 3-4 Power Flow Calculation Result without DG ...47
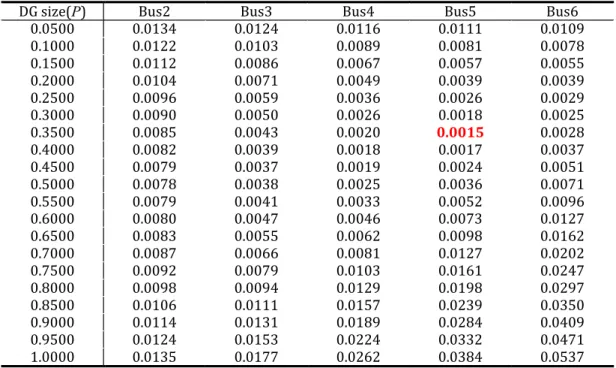
Table 3-5 Power Loss Calculation Result with DG Capable of Injecting Active Power...48
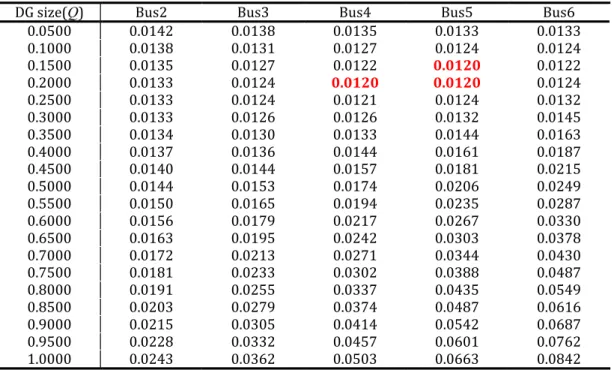
Table 3-6 Power Loss Calculation Result with DG Capable of Injecting Reactive Power...50
Table 3-7 Power Loss Calculation Result with DG Capable of Injecting Both Active Power and Reactive Power (P&Q)...51
Table 3-8 Combinations of Two DGs location in the Simple Distribution System Model ...53
Table 3-9 Power Loss Calculation Result with Two DGs Installation at Bus3 and Bus5 (p.u.×10-2) ...54
Table 3-10 DG Location Candidates Group...57
Table 3-11 DG Location Candidates andPQCapacity Values for Case 1...58
Table 3-12 DG Location Candidates andPQCapacity Values for Case 2...58
Table 3-13 DG Location Candidates andPQCapacity Values for Case 3...58
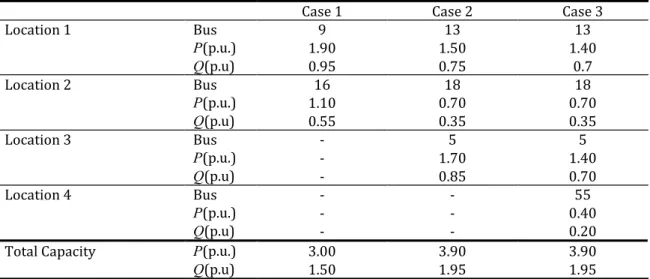
Table 3-14 Summary of the Simulation Result...59
Table 3-15 DG Locations and Capacity Values in the Optimal Solution in Each Case ...60
Table 3-16 PV Installation Bus Number...65
Table 3-17 Summary of Simulation Result (1) ...67
Table 4-2 Information and its Infrastructure Promoting DR Programs for Small Size
Consumers... 108
Table 5-1 Linkage Data between Three Concepts in the Proposed Approach ... 120
Table 5-2 Summary of Power Flow Calculation Speed Test ... 123
Table 5-3 Parameters for the Distribution System Model... 133
Table 5-4 Partial Meter Property Data ... 134
Table 5-5 Basic Simulation Data... 138
Table 5-6 Possibilities of Outage Range for One Metering Data Collection Fault ... 140
Table 6-1 Simulation Result of One Day Power Loss Reduction Effect by Demand Reduction ... 147
Table 6-2 Simulation Result of Accumulated Power Loss Reduction Effect by Demand Reduction... 149
Table 6-3 Summary of PV Capacity Deviation ... 151
Table 6-4 Summary of Slack Power Deviation ... 151
Table 6-5 Summary of Active Power Loss Deviation... 152
Table 6-6 Setting Parameters for Simulations... 155
Table 6-7 Stochastic Variables and Base Distributions ... 156
Table 6-8 Simulation Scenarios Setting Parameters... 157
Table 6-9 Simulation Results ... 158
Table 6-10 Simulation Results ... 159
Table 6-11 Simulation Results ... 160
Table 6-12 Capacity Constraint for Each DG and Slack Bus... 171
Table 6-13 Installed DGs and Cost Parameters... 171
Table 6-14 Results of OPF by PSO... 172
Table 7-1 Actions for Critical Components in Smart Grid Projects and Their Objectives... 186
Figure 1-1 Smart Grid Overview by METI [1-4]... 3
Figure 1-2 Structure of This Dissertation... 8
Figure 2-1 ICT Based Smart Grid Solution Concept...11
Figure 2-2 Clarification Procedures of Critical Components to Promote Smart Grid ...13
Figure 2-3 Total Smart Grid Cost [2-6] ...15
Figure 2-4 Value Provision Model of ICT ...22
Figure 2-5 Relation between Smart Grid Critical Areas and ICT Contribution ...24
Figure 2-6 Ad-hoc Network Technology in AMI...26
Figure 2-7 Major Features of the RF Mesh Technology...28
Figure 2-8 Supply-side EMS Concept Overview...34
Figure 3-1 Simple Distribution System Model...43
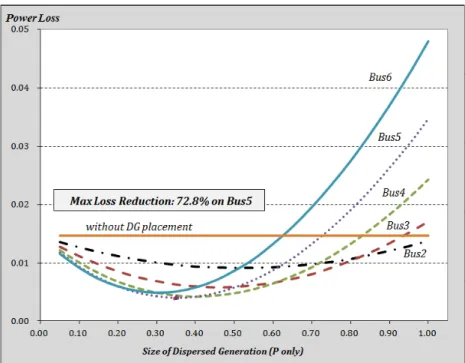
Figure 3-2 Loss Reduction Effect by the Size of DG for Each Installation Bus (Injecting Active Power Only) ...49
Figure 3-3 Loss Reduction Effect by the Size of DG for Each Installation Bus (Injecting Reactive Power (Q) only) ...50
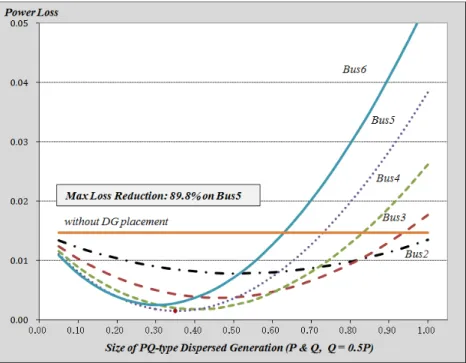
Figure 3-4 Loss Reduction Effect by the Size of DG for Each Installation Bus (Injecting Both Active and Reactive Power (P&Q)) ...52
Figure 3-5 Profile of Active Power Loss for Simple Distribution System Model with Two DGs Installation at Bus3 and Bus5...53
Figure 3-6 Wiring Diagram of Grid. [3-14]...55
Figure 3-7 Voltage Magnitude Improvement by DG Placements in 126 Bus Distribution System ...61
Figure 3-8 Voltage Angle Changes by DG Placements in 126 Bus Distribution System ...61
Figure 3-9 Slack Bus Power Injection, 10 PVs and 20% Penetration Level ...70
Figure 3-10 Slack Bus Power Injection, 50 PVs and 20% Penetration Level...70
Figure 3-11 Slack Bus Power Injection, 50 PVs and 0% Penetration Level ...71
Figure 3-12 Slack Bus Power Injection, 50 PVs and 10% Penetration Level...71
Figure 3-13 Power Loss Reduction by PV Penetration Level...72
Figure 3-14 Power Loss Reduction at PV Penetration Level 20% by the Number of PVs...73
Figure 4-1 Categorization of Energy Management Systems ...81
Figure 4-3 Revenue of BEMS in the world [4-6] ...83
Figure 4-4 BEMS Installation Target and Result...85
Figure 4-5 Benefit Realization Concept of Consumer-side EMS...87
Figure 4-6 Cost Function of Consumer-side EMS Installation and Operation...88
Figure 4-7 State of Action on Energy Conservation by Size of Workforce [4-10]...89
Figure 4-8 Reason for not Engaging in Energy Conservation Through Investment [4-10] ...90
Figure 4-9 DR Program Types Based on the Viewpoints of Incentive Provision...99
Figure 4-10 Reported Potential Peak Load Reduction by Customer Class in 2006, 2008, 2010 and 2012 FERC Surveys [4-17]...99
Figure 4-11 Reported Potential Peak Load Reduction by Program Type and by Customer Class FERC surveys [4-17] ... 100
Figure 4-12 Benefit Curve for DR Programs Categorized in Economic Program and Price Menu Based Program. ... 103
Figure 5-1 Typical Distribution System in Japan... 115
Figure 5-2 Distribution System Model Using the Proposed Approach... 120
Figure 5-3 Active Route Structure Search Procedure... 121
Figure 5-4 Functional Structure of the Prototype System... 122
Figure 5-5 Visualized Comprehension Method of Voltages in Distribution Systems... 124
Figure 5-6 Voltage Distribution in a Distribution Line ... 125
Figure 5-7 Comprehension of the Voltages Violation Time Slots and Substation Bus Voltage Control Simulation... 125
Figure 5-8 Simulation Images of the Prototype System ... 126
Figure 5-9 Procedures for Outage Management 0... 129
Figure 5-10 Distribution System Model ... 133
Figure 5-11 Smart Meters, Pole Transformers and Load Buses... 135
Figure 5-12 Visualization Method of Data Collection Status for Smart Meters Connected to the Same Transformer... 136
Figure 5-13 Visualized Distribution System Model... 136
Figure 5-14 Data Collection Status Transition in an Outage... 139
Figure 5-15 Procedures for Outage Prediction ... 141
Figure 6-1 Power Demand Curve for Each Month using Data of [6-1]... 148
Temperature Difference from Average... 156 Figure 6-3 Pareto Optimal Solutions ... 166 Figure 6-4 Simulation Results for the Convergence Status of Optimal Value by
-PSO- ... 173 Figure 6-5 Simulation Results for the Convergence Status of Optimal Value by
-PSO- ... 173 Figure 6-6 Simulation Results for the Convergence Status of Optimal Value by
- ... 174 Figure 6-7 Simulation Results for the Convergence Status of Optimal Value by
- ... 175
Figure 6-8 S -
- ... 176 Figure 6-9 Pareto Front of the Multi-objective Optimization Problem Considering
Variable Cost Only ... 178 Figure 6-10 Pareto Front of the Multi-objective Optimization Problem Considering
Both Fixed and Variable Cost... 179 Figure 6-11 Pareto Front of the Multi-objective Optimization Problem Considering
Variable Cost Only ... 180 Figure 6-12 Pareto Front of the Multi-objective Optimization Problem Considering
Both Fixed and Variable Cost... 180 Figure 7-1 Added-value Circulation Model in Smart Grid ... 187
ADE: Adaptive Differential Evolution AODV: Ad hoc On-demand Distance Vector AMI: Advanced Metering Infrastructure AMR: Automated Meter Reading
BEMS: Building Energy Management System B/F: Backward and Forward
CBM: Condition Based Maintenance
CEMS: Community Energy Management System CEP: Complex Event Processing
CFA: Constriction Factor Approach C&I: Commercial and Industrial CPP: Critical Peak Pricing CPU: Central Processing Unit CT: Current Transformer DA: Distribution Automation DE: Differential Evolution DFS: Depth First Search
DG: Dispersed Generation (Distributed Generation) DMS: Distribution Management System
DOE: the United States department of Energy DR: Demand Response
DSM: Demand Side Management DSO: Distribution System Operator EMA:Energy ManagementApplication EMS: Energy Management System
EPRI: The Electric Power Research Institute ETP: European Technology Platform
EV: Electric Vehicle
FEMS: Factory Energy Management System GA: Genetic Algorithm
GIS: Geographic Information System HEMS: Home Energy Management System
ICT: Information Communication Technology IHD: In-Home Display
I/O: Input and Output
IPESA: Improved Pareto Envelope based Selection Algorithm ISO: Independent System Operator
ISONE: Independent System Operator New England IT: Information Technology
IWA: Inertia Weight Approach JIS: Japan Industrial Standard JRC: Joint Research Centre
KCL: Current Law
KVS: Key Value Store LED: Light Emitting Diode LV: Low Voltage
MDMS: Meter Data Management System MEMS: Mansion Energy Management System METI: Ministry of Economy, Trade and Industry
NEDO: New Energy and Industrial Technology Development Organization MOEA: Multi-Objective Evolutional Algorithm
MOPSO: Multi-Objective Particle Swarm Optimization NIST: National Institute of Standards and Technology NYISO: New York Independent System Operator OLSR: Optimized Link State Routing
OMS: Outage Management System OPF: Optimal Power Flow
PAES: Pareto Archived Evolution Strategy PBP: Price Based Program
PCS: Power Conditioning System
PESA: Pareto Envelope based Selection Algorithm PEV: Plug-in Electric Vehicles
PJM: Pennsylvania New Jersey Maryland Interconnection PLC: Power Line Communication
PSO: Particle Swarm Optimization PTR: Peak Time Rebate
PV: Photovoltaic PX: Power eXchange
RES: Renewable Energy Source RF: Radio Frequency
ROI: Return On Investment
RTO: Regional Transmission Organization RTP: Real Time Pricing
SAIDI: System Average Interruption Duration Index SAIFI: System Average Interruption Frequency Index SCADA: Supervisory Control And Data Acquisition SME: Small and Medium Enterprises
SPEA: Strength Pareto Evolutionary Algorithm SVC: Static Var Compensator
SVR: Step Voltage Regulator TBM: Time Based Maintenance TOU: Time Of Use
UPS: Uninterruptible Power Supply U.S./US: United States
VAR: Volt-Ampere Reactive VT: Voltage Transformer
(Unit of Measurement) GB (Byte): GigaByte GHz (Hertz): GigaHertz min.: minute
p.u.: per unit sec.: second
USD: United States Dollar V, kV (Volt): Volt, kilo-Volt
kW, MW (Watt): kilo-Watt, Mega-Watt
Wh, kWh, GWh (Watthour): Watthour, kilo-Watthour, Giga-Watthour
Chapter 1 Introduction
In this chapter, the background and the goal of this dissertation are described. In the description, Smart Grid , which is the subject of this study, is defined because there is no unique common definition and many definitions by various organizations exist. Then the direction and the investigation flow of this dissertation are described by showing the structure of this dissertation.
Background and Context to This Study 1.1.
the world, and many pilot and/or demonstration Smart Grid projects have been conducted.
In addition, some incentive plans or subsidy systems have been implemented to promote Smart Grid in many countries or regions.
However, it looks that only a few verified and commercially deployed Smart Grid technologies with clear benefits exist. The reason might be Smart Grid benefit is still unclear because Smart Grid realization requires restructurings of various existing power supply systems and their components, and these should need a large scale expense, while many expectations by Smart Grid realization exist, such as improvement of power supply reliability, reduction of environmental burdens and expansion of the number of employees working for new energy related businesses etc. One of the reasons might be major Smart Grid expected achievements such as advanced demand control and a large scale installation of small size renewable energy sources (RESs) are mainly on technology improvements in demand-side. Because most current Smart Grid technologies are based on the existing technologies for large size and small number of equipment, and these would require high cost if such technologies would be deployed to small size and large number of equipment in demand-side. In addition, many new technologies in demand-side are proposed such as power selling using photovoltaic (PV) generation systems, power saving by energy management systems (EMSs) and dynamic pricing and demand response (DR) programs. However it is difficult for most of them to recover their installation and operation costs at present. For example, electric power selling using RES generation is not profitable without subsidies, and various support programs are required to recover their service installation and operation cost only with their small cost reduction effect in most
countries and regions.
In order to solve these challenges, high value production Smart Grid components should be developed with their quantification method. Moreover, it is necessary to clarify the profitability of Smart Grid measures as businesses, and many business organizations should join to various Smart Grid projects and make investment continuously. Expansion of information communication technology (ICT) utilization is one of expected areas for these challenges and it should contribute not only to efficiency improvement of existing power system technologies but also to value production using various and huge information, which can be collected by the recent information technology evolution.
However the fact is that ICT applied areas to power systems are limited at present.
On the above mentioned background, it should be necessary to clarify critical component technologies and measures to realize Smart Grid, to quantify their installation effects and to propose evaluation methods of their optimal implementation into Japanese market in the aspect of business profitability and effective utilization of ICT for these technologies and measures.
Smart Grid and Advanced Power System 1.2.
Firstly, Smart Grid definition in this dissertation is described because Smart Grid is a wide-ranging concept and a unique definition does not exist.
Smart Grid concept is defined at various organizations all over the world and such various definitions of Smart Grid reflect individual characteristics and constraints of organizations, regions or countries these Smart Grid concepts defined. For example, the National Institute of Standards and Technology (NIST), which is United States (U.S.) standard setting organization, defines Smart Grid as follows [1-1].
-way communication and control capabilities that will lead to an array of new functionalities and applications. Unlike today's grid, which primarily delivers electricity in a one-way flow from generator to outlet, the smart grid will permit the two-way flow of both electricity and
As another example, European Technology Platform (ETP) defines Smart Grid as follows. [1-2]
connected to it - generators, consumers and those that do both - in order to efficiently deliver sustainable, economic and secure electricity supplies. A smart grid employs innovative products and services together with intelligent monitoring, control, communication, and self-healing technologies in order to:
Better facilitate the connection and operation of generators of all sizes and technologies
Allow consumers to play a part in optimising the operation of the system
Provide consumers with more information and better options choosing their energy supplier
Significantly reduce the environmental impact of the whole electricity supply system
Maintain and improve the existing high levels of system reliability, quality, and security of supply
Maintain and improve the existing services efficiently Foster the development of a
On the other hand, in Japan which is the targeted market of this study, the Ministry of Economy, Trade and Industry (METI) defines the Smart Grid as follows [1-3] and Figure 1-1 is the Smart Grid overview by METI [1-4].
Figure 1-1 Smart Grid Overview by METI [1-4]
Next generation energy system, as it is called Smart Grid is the concept of next
generation power systems corresponding to challenges related to power supply and demand using state-of-art information technologies (IT). Generally, for large scale installation of dispersed generations such as renewable energy, it is aimed to realize high efficiency, high quality and high reliability power systems by the integration and utilization of information from dispersed generations, energy storages and demand side using high-speed communication network technologies, as well as combined operation with existing large scale power sources and transmission and distribution networks.1
In addition, various standard setting organizations and industries define their own Smart Grid and they are organized in [1-5]. Referring to these various Smart Grid definitions, it is found that the following words are used commonly.
Intelligent Power Supply Network ICT Utilization
Two-way (bidirectional)
These three features are outlined as follows.
Intelligent Power Supply Network (1)
Smart Grid is a power supply network and not existing power supply system but is composed of new equipment which has advanced technologies from power generation assets to power consumption appliances. In addition, this power supply network has
recovery in case of failure etc.
ICT Utilization (2)
1.2(1) by the utilization of all information which are generated at all points from power generations to power utilization points which compose Smart Grid. Therefore, information transferring, processing and utilizing mechanisms which can treat huge amount of data from a large number of equipment should be essential.
Two-way (Bidirectional) (3)
Smart Grid is two-way power supply network. Two-way has two means and the first is power flow direction and the second is information utilization flow direction. As for the
1 Original definition is in Japanese and attached as Appendix B
power flow aspect, power flow direction would be two-way from existing one-way power flow from centralized large generators to consumers, because consumers would have their own generators and excess generated power should be injected into power supply network for selling. As for the information utilization flow aspect, the supply and demand balancing method would be two-way. While power companies are adjusting their supply electric power corresponding to electric power demand in the current power supply system, in the Smart Grid, consumers would control their demand considering power supply capacity, or power companies
using information of both supply and demand sides.
Because the targeted market of this study is the power market in Japan, this dissertation adopts the METI s Smart Grid definition as the base definition and detailed discussions will be conducted focusing on above mentioned three features of Smart Grid definitions.
Aims of This Study 1.3.
This study aims to contribute to the realization of Japanese Smart Grid which is an improved power system in all aspects of security, safety, ecology and economy compared with existing power systems. In order to realize Japanese Smart Grid, many Smart Grid related projects have been conducted and various new technologies such as dispersed generations (DG) including RES generations, electric storages, smart meters and so on also have been installed. However, it is not Smart Grid yet but just a power systems limited number of above mentioned new technologies connected. Because new technologies such as PV and wind turbine are environment friendly but unstable in the aspect of generation capacity, roughly speaking the same amount of reserved power such as power storages would be required if there are no any control mechanisms. Therefore, the collection of power systems state information and optimal controls of new technologies using such information are essential in order to increase RES amount and reduce the number of power storages. However ICT utilization in power systems is still very limited at present and this might be one of the reasons why the amount of RES would not be expanded while power quality is very high. Therefore, the expansion of ICT adapted areas in power systems maintaining power quality is one of most important topics in the study, as well as clarification of critical new Smart Grid technologies and measures. Although power
storage and its effective management are also important topics to realize Smart Grid, these topics are out of the scope because the consideration of effective ICT utilization is focused in this study.
In addition, while installation effect of these Smart Grid technologies such as DG, EMS etc., have been studied, most are stand-alone effects estimation and earning models as business models have not been considered. As mentioned in 1.1, the realization of Smart Grid requires installations of various technologies and measures, and these require a lot of investment. That means it is necessary that many companies should enter the new electricity market and provide many investments to the market continuously. In order to realize such situations, clear benefit is essential and thus this dissertation focus on profitability of Smart Grid business models and another important objective is to clarify these effective business models for Smart Grid elemental technologies and measures.
The followings are major items what this study should clarify.
Critical component technologies and measures to realize Smart Grid
To clarify areas where especially ICT application increases production values
Business profitability and sustainability by the quantification of installation effect for critical technologies and measures for Smart Grid
To provide versatile evaluation methods and tools for the first stage of Smart Grid activities in order to support potential entrants into this new power market
Evaluation methods of technologies and measures installed into Japanese power market in the aspect of business profitability.
To propose sustainable model without dependence on subsidies because most of subsidy projects are evanescent and ended with demonstration projects
Structure of This Paper 1.4.
In order to achieve aims of this study, the dissertation is composed of seven chapters as follows.
Here, the background and the goal of this study are defined and provides the direction and the investigation flow of this study by showing the structure of this
dissertation.
Chapter two explores critical components of Smart Grid by researches, analyses and reorganization of activities in Smart Grid demonstration projects worldwide. In the consideration, candidates of Smart Grid critical component technologies and measures are extracted focusing on their benefit in order to consider profitability of these technologies and measures. In addition, selected candidates are evaluated whether ICT utilization can contribute effectively and then Smart Grid critical component technologies and measures in this study are selected.
From chapter three to chapter five, reorganizations of component measures, effect quantifications of countermeasures and proposals of effective business models are conducted for Smart Grid critical components defined in chapter two.
Chapter three deals with optimal power generation technologies and measures in demand-side and explores effect evaluation and quantification methods of DG installations.
In the chapter, optimal location and size of DGs for the power loss minimization are considered and also an evaluation method of installation effect of PV generation systems which are expected as future main RES generation system is considered and proposed.
Chapter four deals with optimal power consumption technologies and measures in demand-side and explores EMS and DR which are receiving big attention in Japan recently.
In the chapter, implementation effect formulation and evaluation of these measures are conducted and also effective business models are proposed.
Chapter five deals with optimal power supply and demand balancing in demand-side, and effective information utilization models for power distribution area are proposed. As the first model, a distribution network monitoring system considering a large number of PV installed environment, which is one of important issues in the near future power systems in Japan. As the second model, outage detection system using smart meter data is proposed because data sensing devices in low voltage distribution systems are not installed sufficiently at present. In the system, the fault information of smart meter data transfer is used because data transfer would be faulted in case of outage.
Chapter six, evaluation methods for the installation effect of technologies and measures which are considered from chapter three to chapter five are proposed. Firstly, value converting methods for periodical amount and equivalent monetary value are proposed because business profitability should be evaluated on periodical basis such as month, quarter, half year and year with same comparable units. Then, two types of
evaluation methods for the installation effect of Smart Grid critical technologies and measures are proposed. The first one is a method of profitability priority approach and the second one is a method of multi-objective optimization approach because most power system optimization problems are constrained multi-objective optimization problems which includes trade-off relation multiple objectives such as measure implementation effects versus their cost etc.
Chapter seven describes overall conclusion of this study with regard to the Sustainable Smart Grid Realization which means advanced power systems in aspects of safety, economy, environment and security and has effective business models with profitability. Firstly the coverage of research topics in this study for critical components of Smart Grid selected in chapter two are reviewed and then the value circulation model is provided because produced values of technologies and measures explored in this study are related among each other and the relation should be considered when effects and expenses of these technologies and measures would be evaluated.
Figure 1-2 shows the structure of this dissertation.
Figure 1-2 Structure of This Dissertation
Chapter Reference
[1-1] Smart Grid: A Beginner's Guide, National Institute of Standards and Technology's (NIST) web site. Available at:
http://www.nist.gov/smartgrid/beginnersguide.cfm
[1-2] What is Smart Grid?, The European Technology Platform (ETP) web site. Available at:
http://www.smartgrids.eu/ETPSmartGrids
[1-3] (International
Standardization on Next Generation Energy System), Report by the Study Group on International Standardization for Next Generation Energy Systems, January 2010 (in Japanese) [Online]. Available at Ministry of Economy, Trade and Industry web site:
http://www.meti.go.jp/report/downloadfiles/g100129d01j.pdf
[1-4] T. Goda, Japan's Challenge for a Standardiszation of Inverter Technology, NEDO High Penetration PV Workshop, October 2012 [Online] Available at:
http://iea-pvps.org/index.php?id=153&eID=dam_frontend_push&docID=1487 [1-5] M. Shabanzadeh and M. P. Moghaddam, What is the Smart Grid? - Definitions,
Perspectives, and Ultimate Goals, The 28th International Power System Conference, November 2013
Chapter 2 Critical Components to Realize Smart Grid and Contribution of Information Communication
Technology
In this chapter, critical components of Smart Grid are considered by surveys, analyses and reorganizations of activities in Smart Grid demonstration projects mainly in the United States (U.S.). In the consideration, candidates of Smart Grid critical component technologies and measures are extracted focusing on their benefit to consider profitability of these technologies and measures. The extracted technologies and measures are considered and discussed in the aspect of information communication technology (ICT) effectiveness, and then Smart Grid critical component technologies and measures in this study are selected.
Smart Grid as Future Power Systems 2.1.
Firstly, approaches for Smart Grid realization as future power systems are researched and basic ICT roles are considered in this section.
2.1.1.Smart Grid Demonstration Projects
Many and various Smart Grid projects have been conducted all over the world centering on the U.S. and European Union (EU) countries, and their plans, results and effects have been reported in various publications. For major examples, the U.S.
department of Energy (DOE) awarded 9 Smart Grid demonstration projects to promote Smart Grid in 2008 and the Electric Power Research Institute (EPRI) conducted a framework development project to estimate benefits and costs of Smart Grid projects and introduced 10 steps which organized Smart Grid elements, functions, and benefits [2-1].
EPRI also has provided reports for these advan
[2-2][2-3][2-4][2-5]. In addition, [2-6] considers Smart Grid benefits and costs by utility sectors such as transmission, distribution and customers, and Joint Research Centre (JRC) in EU and DOE provided the joint report for assessment of Smart Grid benefits and costs [2-7]. In many of these reports, criteria and metrics to assess Smart Grid benefits and costs are provided. In this chapter, critical components and ICT contribution for accelerating
Smart Grid realization are discussed and selected using these various projects information and their evaluation reports.
2.1.2.Smart Grid and ICT Solutions
In order to realize Smart Grid, various approaches have been tried and verified in many countries and regions for various purposes such as customer benefit improvement, optimal installation of dispersed generation (DG) installation, power grid reliability improvement, efficient power assets operation and new electric power market establishment [2-8].
For the realization of most new services by Smart Grid, establishment of information communication networks between service providers and their customers are essential at first. However many challenges exist in implementation and operation of the access network (as it is called last mile network) which connects power companies and their customers and also power supply and consumption equipment. Therefore, a new network solution for these challenges is required. Secondly, a new energy management functions using ICT is necessary because Smart Grid requires power supply and demand balancing utilizing both sides information at the same time as providing new value-added services such as power demand reduction and leveling (peak cut or peak shift etc.) etc.
Figure 2-1 ICT Based Smart Grid Solution Concept
Therefore, in consideration of Smart Grid from the aspect of ICT, it can be considered that various advanced services by Smart Grid realization are established on
these two base concepts. The former is called advanced metering infrastructure (AMI), composed of smart meters, access networks and data management systems, which is implemented as the first step of typical Smart Grid Project. The latter is called Energy Management Applications (EMA) in this paper, composed of various kinds of energy management systems (EMSs) for the realization of power supply and demand collaboration controls.
Figure 2-1 shows ICT based Smart Grid solutions concept from the viewpoint of power companies referring to the concept in [2-9] to illustrate holistic Smart Grid solutions and the relation between AMI and EMA. Business platform consists of communication networks and their data management systems and the AMI solution is one of platform solutions. Business applications such as energy operation and energy business management are provided on the platform solutions. Energy operation area includes applications for power system operation and control, and is traditionally the area for machine control systems and little ICT contribution area at present. EMS is one of base energy operation solutions for supporting new requirement in Smart Grid. On the EMS solution, solutions for power system reliability such as renewable energy source (RES) management and outage management are provided. Energy business management area includes applications for power companies efficient business management, and service provision business area is for additional diversified service business area for power companies and other service business providers.
Clarification of Smart Grid Critical Components 2.2.
In this section, effective procedures to decide critical components to promote Smart Grid and their measures are proposed. As mention in the introduction, in this study it is assumed that possible reasons which prevent Smart Grid realization might be its necessity of enormous investment under the unclear benefit, and ICT utilization should create new additional values and contribute to clarify these values. The followings are proposed procedures to clarify critical components to promote Smart Grid.
2.2.1.Clarification Approach of Smart Grid Critical Components
Clarification approaches to clarify critical components to promote Smart Grid are provided below.
Analysis of Expected Benefits by the Realization of Smart Grid (1)
Firstly this study describes expected benefits by the realization of Smart Grid through survey analysis of Smart Grid demonstration projects in the U.S. The analysis focuses on benefit of Smart Grid, because it is necessary to generate profits or values for both power companies and consumers to realize Smart Grid which requires enormous investment and cost. Technological measures to realize the Smart Grid benefits are extracted from the demonstration projects, and then extracted measures are grouped.
After that, actions in Smart Grid projects to provide benefits for these groups are considered and created.
Consideration of ICT Contribution Areas for Smart Grid Benefits (2)
Secondly, ICT contribution areas to these Smart Grid benefits and some actual realization measures are discussed. ICT contributions are evaluated by the difference between benefits with and without ICT application. Then, effective actions to promote Smart Grid realization significantly with the expansion of ICT applications are considered and created.
Decision of Critical Components for Accelerating Smart Grid Realization (3)
From the results of above two discussions, critical components and required areas for detailed research and development are discussed and concrete research topics accelerating Smart Grid are provided.
Figure 2-2 Clarification Procedures of Critical Components to Promote Smart Grid
Figure 2-2 shows clarification procedures of critical components to promote Smart Grid which summarize above mentioned three steps. In accordance with the procedures, critical components and their countermeasures are considered in this section.
2.2.2.Definition of Smart Grid Benefits and Beneficiaries
Firstly, benefits and their beneficiaries by the Smart Grid realization are defined.
Although various definitions exist regarding Smart Grid benefits, benefits and beneficiaries defined in [2-1] are used in this study as the base definition because these benefits and beneficiaries are based on actual Smart Grid projects and the definition should obtain the consensus among many Smart Grid project concerned parties.
Table 2-1 Summary of Reorganized Smart Grid Benefits Defined in [2-1]
Benefit Category Benefits Typical Beneficiary
Economic Electricity cost savings Consumer
Reduced generation costs from improved asset
utilization Utility(G)
Utility(G) Deferred Generation
Capacity Investments Utility(G)
Utility(G)
Reduced Ancillary Service Cost Utility(G)
Reduced transmission congestion costs Utility(T) Deferred Transmission
Capacity Investments Utility(T)
Utility(T) Deferred Distribution
Capacity Investments Utility(D)
Utility(D) Reduced Transmission Equipment Failures Utility(T) Reduced Distribution Equipment Failures Utility(D) Reduced Transmission
Equipment Operation & Maintenance Cost Utility(T) Utility(T) Reduced Distribution
Equipment Operation & Maintenance Cost Utility(D) Utility(D)
Reduced Transmission losses Utility(T)
Reduced Distribution losses Utility(D)
Theft reduction Utility(R)
Reduced Meter Reading Cost Utility(R)
Reliability and
Power Quality Reduced cost of power interruptions Utility(D) Reduced costs from better power quality Consumer Reduced Sustained
Outages and Major Outages Consumer
Environment Reduced damages as a result of lower greenhouse gas /carbon emissions
Reduced damages as a result of lower SOx, NOx, and Particulate Matter emissions
Society in general Utility(C)
Energy Security Greater energy security from reduced oil consumption Society in general Utility(C) Reduced widespread damage from wide scale
blackouts Society in general
Consumer Note: Gray colored cells are outside scope of this study.
used as beneficiaries. s G:
Generation, T: Transmission, D: Distribution, R: Retail and C: Common are used in order to clarify targeted business organizations in this study.
Table 2-1 shows reorganized Smart Grid benefits and beneficiaries defined in [2-1]
by above mentioned four categories, and some benefits are divided to define beneficiaries clearly. Although
Table 2-1 shows many benefits to various beneficiaries expected by the realization of Smart Grid, this study focuses on some major areas as the viewpoint of Smart Grid rapid promotion.
One of the big differences in Smart Grid compared with existing power supply systems is small-medium size DGs exist in demand-side (distribution area) and in economic, reliability and environmental aspects, optimal power delivery and consumption would be achieved by collaborated control between supply and demand sides. In order to realize these, various technology improvements are required in demand-side.
Figure 2-3 Total Smart Grid Cost [2-6]
Figure 2-3 shows total costs to enable a fully functioning Smart Gird showed in [2-6], and the report estimates that 309-403 billion U.S. dollars (USD) investment to distribution system area would have been provided for twenty years. This shows center
area of Smart Grid investment is distribution system area (demand-side). Therefore, benefits which beneficiaries are Utility (D) and Consumer and also benefits which contribute to demand-side power source such as DG and batteries are focused on as major objects in this study
philanthropy, business ethics and compliance for regulations etc., these are not adequate benefits considered by their profitability. Therefore, these benefits are out of scope in this study. However, it would be essential to consider environment, safety and security related matters in the discussion of economic and reliability related benefits achievement.
2.2.3.Technological Measures to Realize Smart Grid Benefits
Next, related technologies, methods and approaches to realize Smart Grid are considered for each selected Smart Grid benefits from major demonstration projects and related research reports and papers.
Electricity Cost Savings (1)
This benefit is that electricity price down or rebate receipt in consumers by behavior changes in themselves. It includes contract modification by load leveling, incentives from power companies
operation by smart appliances and cost reduction by changing various electricity price programs [2-7][2-10][2-11]. The followings are Smart Grid technological measures which realize this kind of benefit.
Technologies for EMS in demand-side such as Factory (FEMS), Building (BEMS) and Home (HEMS)
- Visualization of power consumption, appliance and equipment control, demand forecast and simulation etc.
Various electricity price programs including demand response (DR)
- Time of Use (TOU), Real Time Pricing (RTP), Critical Peak Pricing (CPP), Peak time Rebate (PTR) etc.
Smart Equipment, Smart Appliances
Deferred Generation Capacity Investments (2)
Although this benefit means deferred investment for large scale and centralized generation plants generally, the benefit is considered in this study because it might be considered that some demand-side control such as DR programs or DG installation etc.,
can contribute to the deferment of the investment for large scale generation plants [2-10].
Therefore, only demand-side control methods by DG and DR etc., are focused as sources of this benefit.
DG and RES installation
DR and demand-side management (DSM) Peak reduction and energy saving by EMS Reduced Ancillary Service Cost
(3)
In this study, ancillary service cost is defined as the cost which is paid for the power supply stability by power companies connecting their plants with power transmission or distribution systems, to the organization such as independent system operator (ISO). In order to reduce ancillary service cost under the near future environment where a large number of RES generators are installed, highly accurate forecast of generation capacity and power demand in a target area, and also real-time rapid control systems which use the forecasted information might contribute to effective management of distribution systems.
Community EMS (CEMS), which provides power supply and demand balancing functions for a certain area, has been studied and developed and it is expected that CEMS provides advanced supply and demand control functions including efficient ancillary service provision.
CEMS
- High accuracy forecast of generation capacity and power demand - Real-time rapid control system
- Ancillary service provision
Deferred Distribution Capacity Investments (4)
Power demand peak reduction is necessary as a method for deferment of distribution equipment investment. In order to achieve that, similar measurements in 2.2.3(1) and 2.2.3(2) are required. In other word, actions for load reduction in demand-side lead to deferment of distribution asset investment, and demand-side DG installations would make same effect. Therefore, these load reduction effects might lead to price reduction or incentives provision by power companies.
Reduced Distribution Equipment Failures (5)
By the detailed status monitoring of distribution systems, power flow with abnormal current and/or voltage injected into distribution equipment would be
preventable. Also, by the collection of detailed status data from equipment in distribution systems, signs of equipment failure can be detected. The followings are technological measures to realize them.
CEMS
- High accuracy forecast of generation capacity and power demand
- Optimal system control algorithms and simulations using electricity generation and load forecast.
Asset and equipment state monitoring
- For reliable operation and rapid failure detection
- For improved asset maintenance methods such as equipment condition based maintenance.
Reduced Distribution Equipment Operation & Maintenance Cost (6)
The expansion of autonomous control areas contributes to operation and maintenance cost reduction. Also, equipment status monitoring makes condition based maintenance (CBM) possible from conventional time based maintenance (TBM), and CBM can reduce some inspection works which are not necessary from the viewpoint of asset health. This change is beneficial operation not only for the aspect of work volume reduction but also of human error reduction. The followings should be technological measures to realize above these functions.
Autonomous wide area asset monitoring Autonomous asset control
Asset maintenance methodologies such as CBM, TBM etc.
Reduced Distribution Losses (7)
In the conventional power supply model that electric power generated by large-scale centralized power plants is transmitted and distributed to demand areas, one of significant problems is power loss which is caused by impedance of power transmission and distribution lines. Because power loss depends on the distance from a power plant to demand points, adequate DG and other equipment installation and system reconfiguration in demand-side would be key points in order to reduce power loss [2-12][2-13][2-14][2-15]. Therefore, the followings should be technological measures.
Installation and optimal allocation of DGs.
Distribution system reconfiguration
Reactive power and voltage control (Static Var Compensator (SVC) or Step Voltage Regulator (SVR) installation and optimal allocation)
Theft Reduction (8)
Power theft reduction would be achieved by detecting abnormal usage through continuous power consumption monitoring. Generally, theft reduction is one of important benefits of AMI.
AMI (Smart Meter, communication network (last miles network) and data collection and management system (meter data management system (MDMS)) Reduced Meter Reading Cost
(9)
As well as 2.2.3(8), this is one of important benefits of AMI installation. Historically meter reading is operated by metering staffs every month or every year etc. By AMI, efficient, frequent and accurate metering would be achieved.
AMI
Reduced Cost of Power Interruptions (10)
Cost of power interruptions is the expense for countermeasures of power interruptions required in power companies. In order to reduce the cost, reduction of outage, rapid detection and islanding of outage sections are required and also rapid restoration from outage by using autonomous control, remote control and alternatives should be necessary. The followings should be required technological measures.
Wide area distribution system and equipment monitoring Detection of outage section
Autonomous control, remote control (Islanding and restoration)
Collaborative operation with alternatives such as DGs and power storages including electric vehicles (EVs).
Reduced Costs from Better Power Quality (11)
This benefit means cost reduction for damages in demand-side from momentary outage, voltage sag and swelling or harmonics. In order to reduce the cost, some hardware devices such as stationary power battery for short term outages and adaptive protection circuits are required.
Reduced Sustained Outages and Major Outages (12)
Sustained outages and major outages make significant damages to actions in power consumers and it is necessary to avoid. Basically, same actions in 2.2.3(10) are required and also power consumers should corporate peak cuts and peak shifts to avoid wide-area
2.2.4.Creating Actions in Smart Grid Projects
Here, extracted technological measures are grouped by their similarity and actions in actual Smart Grid projects are considered for each group.
a. Selection of Critical Benefits Which Need Further Discussion
Before the grouping, focusing technologies and measures are selected considering the purpose of this study. Countermeasures for 2.2.3(8) 2.2.3(9) autonomous and frequent power consumption data collection using AMI. AMI is one of the base infrastructures for Smart Grid and it also takes important roles from the viewpoint of ICT utilization. However AMI for general purposes such as theft reduction and reduced meter reading cost would be out of scope in this study because some countries and regions have already installed smart meters for these purposes. (Utilization of data collected by AMI for other purposes is scope of this study.) In addition, countermeasures for 2.2.3(11) Reduced Costs from Better Power Quality should be achieved by mainly hardware and thus benefit it is also outside the scope of this study.
b. Categorization of Critical Technologies, Methods and Approaches in Selected Critical Benefits
Here, selected critical benefits are reorganized by the similarity in their characteristics, objectives or required technologies. All countermeasures can be related to improved power supply, power consumption or control between power supply and consumption in a certain region or area. Therefore, extracted technological measures are
supply and demand balancing and these three major categories are defined as critical areas to promote Smart Grid penetration in this study. Table 2-2 shows actions for critical components in actual Smart Grid projects and their objectives which are needed to be achieved. In other word, items in this table show critical elements for the realization of
Smart Grid and it is necessary that this study need to provide effective measures for the realization of these items.
Table 2-2 Actions for Critical Components in Smart Grid Projects and Their Objectives Critical Components
Technological Countermeasures Actions in Smart Grid Projects Objectives (1)Optimal Power Supply
- DG
- Optimal volt- ampere reactive (VAR) control
(SVR, SVC Installation) - Network reconfiguration - Autonomous control
- Optimal DG installation.
- Optimal SVR, SVC installation - Optimal distribution network
reconfiguration
- Generator operation and maintenance optimization (Asset management Asset life cycle cost management)
- Peak power cut/shift - Power loss reduction
- Total generation cost reduction - RES capacity expansion - Stable voltage/current
- Ancillary service cost reduction - Operation and maintenance Cost
reduction
- Life time cost reduction (2)Optimal Power Utilization
- Demand-side efficient energy management
(Visualization, device control, demand forecast,)
- Various electricity price program including DR
- Smart equipment and Smart appliance (Autonomous control)
- EMS (BEMS, HEMS, Mansion EMS (MEMS) and FEMS) - Demand response (DR) and
Various electricity price system - Smart equipment and
appliance Autonomous control -
- Electricity saving - Electricity peak cut - Electricity cost saving
- CO2emission amount reduction - Optimal electricity price program -
(3)Optimal power supply and demand balancing
- Wide area energy management - Wide area system, asset and
device status management - Outage area specification - Distribution automation
(Automatic and remote control) - Supply and demand forecasting
and adjusting
(DG, Battery, Power storage including electric vehicle (EV), Stationary Power storages, Uninterruptible Power Supply (UPS), DR)
- EMS (CEMS, Wide Area EMS) - Outage management - Asset condition monitoring, - Distribution automation - EV integration
- System control
- Aggregator services (BEMS, DR, MEMS etc.)
- Real-time supply and demand balancing
- Outage indexes minimization - Operation and maintenance cost
reduction
- Deferred asset investment - Deferred inspection interval - Efficient management for Small
and many loads and power supply asset such as dispersed generators and power storages.
ICT Contribution Areas for Smart Grid 2.3.
In this section, ICT contribution for challenges in critical components and technological measures selected and categorized in previous section is considered.
2.3.1.ICT Value Provision Model
Figure 2-4 shows the value provision model of ICT which illustrates relationship between Smart Grid realization elements and Smart Grid benefit from the viewpoint of ICT.
ICT should play several important roles in every element in order to provide Smart Grid benefits from data generation to value proposition as follows.
Figure 2-4 Value Provision Model of ICT
From the diagram, the followings are technologies which especially require ICT contribution.
Advanced network technology which communicates data between meters or sensors in demand-side and data center systems in two ways
Advanced data collection technology for enormous and frequently generating data from a large number of smart meters and sensors.
On-memory based rapid data processing technology for real-time data utilization.
Advanced data storage technology for rapid big data analyses for efficient data processing.
Value transformation technology which creates new values and benefits for end users or control devices.
Smart Grid realization should be promoted if above these ICT advantages could be effectively applied to critical Smart Grid elements selected in the previous section.
![Table 2-1 shows reorganized Smart Grid benefits and beneficiaries defined in [2-1]](https://thumb-ap.123doks.com/thumbv2/123deta/9849445.1897472/32.892.145.750.584.968/table-shows-reorganized-smart-grid-benefits-beneficiaries-defined.webp)