<MBA Degree Thesis>
AY 2016
T HE P OTENTIAL OF THE F IN T ECH I NDUSTRY
TO S UPPORT THE G ROWTH OF SME S IN I NDONESIA 35142338-8 R ARAS M INERVA
M ANAGEMENT S TRATEGY AND
I NDUSTRY E VOLUTION
C.E.
P
ROF. S
HIGERUA
SABAD.E.
P
ROF. K
OJIA
IBA D.E.P
ROF. M
ASAAKIH
IRANOSummary
Small and medium enterprises (SMEs) are an important driver of economic activity in most developing and developed economies. In developing countries, SMEs’ role become more crucial since SMEs can in fact become the engines that sustain growth for long-term development in developing countries. SMEs in Indonesia are representing one of model of SME in developing countries. Criteria of SMEs in Indonesia is defined under the Law No. 20 year 2008 on Micro, Small, and Medium Enterprises based on the total net assets (excluding land and building) and annual sales of the firms.
According to the data provided by the Indonesia Ministry of Cooperatives and SMEs, as of 2013, there are around 57million of SMEs in total operated actively in Indonesia with more than 99% of SMEs in Indonesian market are consisting of micro enterprises located in rural/backward areas, and had little knowledge of financial issues. In 2012, SMEs in Indonesia contribute to 59% of the total GDP in the country, 97% of the total workers, and 15.7% of total export values. Similar to SMEs in other developing countries, SMEs in Indonesia experience difficulties to access the financing due to collateral/ guarantee requirement and the high lending rate. As a result, it is negatively affected SME survival and growth rates in general. Commercial banks and traditional financial institutions consider SME as risky and costly to serve, thus, SMEs are largely underserved
when it comes to basic financial services and tend to use the internal fund as source of financing.
The “FinTech” – short for “Financial Technology is a dynamic intersection of the financial services and technology sectors, where technology-focused start-ups and new market entrants innovate the products and services currently provided by the traditional financial service industry.
There are three periods of FinTech evolution based on the period of development, namely FinTech 1.0, FinTech 2.0, and recently FinTech 3.0. The FinTech 3.0, born during 2008 in the market, as the main focus of this study has been driven by the needs of development and the inefficiencies in the existing financial system, combined with the rapid introduction and reach of new technology, particularly mobile communications. One of its product, namely peer-to-peer (P2P) lending platform, provides market place of unsecured lending service which could benefit the most for SMEs who seek alternative financing.
The study is set out to explore whether FinTech industry have potential in Indonesia and also to understand the main factor, in order for the FinTech services, could give utmost support for the growth of SMEs’ business in Indonesia. A case comparison study of China’s FinTech industry is carried in this study to examine how the FinTech industry successfully gain high traction in China’s market and satisfy the financial needs of SMEs in China. China’s case is selected for the purpose of this study because both China and Indonesia as developing countries have some common environment in terms of: (1) population density, (2) number of unbanked population; (3) the importance of the SMEs in economic growth; and (4) the financial constraint by SMEs in each country.
The P2P lending platform, creates an important allocation role, and become solution especially for SMEs in China that have constrained the credit access. It has gained traction and market acceptance from SMEs seeking credit, mainly because: (1) no collateral is required to obtain required amount of working capital; (2) the simplicity of application of lending process on paperless basis; (3) faster lending approval and cash disbursement; (4) competitive lending rate; and (5) no penalty is given in general from early repayment.
By learning from China’s FinTech industry, there are three conditions are observed to be
important as key success factors for the FinTech industry to support the growth of the SMEs: (1) the digital technology adoption level of the SMEs, (2) the financial literacy skills of SMEs as user of FinTech service, and (3) the regulatory frameworks.
<Inside Cover>
T HE P OTENTIAL OF THE F IN T ECH I NDUSTRY
TO S UPPORT THE G ROWTH OF SME S IN I NDONESIA 35142338-8 R ARAS M INERVA
M ANAGEMENT S TRATEGY AND
I NDUSTRY E VOLUTION
C.E.
P
ROF. S
HIGERUA
SABAD.E.
P
ROF. K
OJIA
IBA D.E.P
ROF. M
ASAAKIH
IRANOTable of Contents
CHAPTER 1. INTRODUCTION ... 7
SECTION 1. IMPORTANCE OF SMES FOR ECONOMIC GROWTH ... 7
SECTION 2. SMES IN DEVELOPING COUNTRY ... 8
SECTION 3. FINTECH TREND IN ASIA ... 8
SECTION 4. SIGNIFICANCE OF THE STUDY ... 9
SECTION 5. OUTLINE OF THE STUDY ... 9
CHAPTER 2. OVERVIEW OF SMES IN INDONESIA ... 10
SECTION 1. SMES CHARACTERISTIC IN INDONESIA ... 10
2.1.1. Definition of SMEs in Indonesia ... 10
2.1.2. Growth of SMEs and Contribution of SMEs in Indonesia ... 11
SECTION 2. MAJOR CHALLENGES FOR SMES IN INDONESIA ... 14
2.2.1. SMEs Non-Financial Issues ... 15
2.2.2. SMEs Financial Issues ... 16
SECTION 3. INDONESIAN SMES FINANCIAL SUPPORT SCHEME FROM GOVERNMENT ... 18
CHAPTER 3. INVASION OF FINTECH ... 20
SECTION 1. FINTECH EVOLUTION ... 20
3.1.1 FinTech 1.0 (1866-1967) ... 20
3.1.2 FinTech 2.0 (1967-2008) ... 21
3.1.3 FinTech 3.0 (2008 - present) ... 22
SECTION 2. PRODUCTS OF FINTECH ... 22
3.2.1 The Online Platform-based Alternative Financing Activities ... 23
SECTION 3. ROLE OF FINTECH TO SUPPORT THE GROWTH OF SMES IN DEVELOPING COUNTRIES (CASE STUDY OF FINTECH INDUSTRY IN CHINA) ... 28
3.3.1 History of Financial Market in China ... 28
3.3.2 Growth Factor of China P2P Lending Industry ... 30
3.3.2.1. Characteristic of P2P Lending Platforms Users in China ... 32
CHAPTER 4. FINTECH FOR SMES IN INDONESIA ... 38
SECTION 1. SMES ADOPTION OF DIGITAL TECHNOLOGY IN INDONESIA ... 38
SECTION 2. FINTECHINDUSTRYININDONESIA ... 41
4.2.1. Current Situation of the FinTech Industry in Indonesia ... 43
SECTION 3. FINTECH AS SOLUTIONS OF INDONESIAN SMES ALTERNATIVE LENDING: LEARNING FROM CHINA’S P2P LENDING MARKET ENVIRONMENT ... 46
4.3.1 The Needs of Alternative Financing for SMEs in China and Indonesia ... 46
4.3.1. Digital Technology Adaption of SMEs in China vs. Indonesia ... 47 4.3.3 Knowledge of SMEs on Financial Literacy and FinTech Industry in China vs. Indonesia
48
CHAPTER 5. CONCLUSIONS AND RECOMMENDATIONS ... 51 SECTION 1. CONCLUSIONS ... 51 SECTION 2. RECOMMENDATION ... 54
CHAPTER 1. INTRODUCTION
Section 1. I
MPORTANCE OFSME
S FORE
CONOMICG
ROWTHSmall and medium enterprises (SMEs) are a major driver of economic activity in most developing and developed economies. They account for more than half of the world’s gross domestic product (GDP) and employ almost two-thirds of the global work force (World Economic Forum, 2015).
The total number of SMEs is hard to estimate. More than 95% of enterprises across the world are SMEs, accounting for approximately 60% of private sector employment (Edinburgh Group, 2012).
As cited in the report from World Economic Forum (2015), in emerging markets alone, there are 365 million to 445 million micro, small and medium-sized enterprises exist, out of which 25 million to 30 million are formal SMEs and 55 million to 70 million are formal micro-enterprises, while the rest (285 million to 345 million) are informal enterprises and non-employer firms. In developed markets, approximately 100 million formal SMEs exist. From the study, it shown that the formally registered SMEs account for more than half of the GDP of high-income countries, the impact is even higher if also taking into account “informal” small business.
Report from the Edinburgh Group (2012) also shown that the contribution made by SMEs does vary widely between countries and regions. Nevertheless, although they play particularly key roles in high-income countries, SMEs are also important to low-income countries, making significant contributions to both GDP and employment. Previous study on SMEs by Viral (2012) also mentioned that SMEs play important role in promoting grassroots economic growth and equitable sustainable development. The high rates of economic growth will contribute to economic and social development and poverty reduction. However, it also depends on the quality of growth.
Quality of growth includes the composition of growth, its spread, and distribution and most importantly the degree of sustainability (Viral, 2012).
Section 2. SME
S IND
EVELOPINGC
OUNTRYIn developing countries, the roles of SMEs become more crucial because, other than SMEs have potential to support the improvement of income distribution, employment creation, poverty reduction and national export growth, SMEs also leads to the development of entrepreneurship, industry and the rural economy (Viral, 2012). SMEs can in fact become the engines that sustain growth for long-term development in developing countries. When growth becomes stronger, SMEs gradually assume a key role in industrial development and restructuring. They can satisfy the increasing local demand for services, which allows increasing specialization, and furthermore support larger enterprises with services and inputs (Edinburgh Group, 2012).
SMEs in many developing countries had been strongly restricted in accessing the capital that they needed to grow and expand, including SMEs in Indonesia. Banks do not provide SMEs with adequate capital in many of developing countries (Edinburgh Group, 2012). Due to high costs for transactions and information collection, as well as immeasurable risks, financial institutions generally hesitate to finance the SMEs. However, since SMEs are a critical component of economic and social stability in a country, improving financial access for SMEs is actually important to enhancing production quality, increasing new business opportunities and as final result, stimulating investment and consumption at the national level (Shinozaki, 2012).
Section 3. F
INT
ECHT
REND INA
SIAThe advance of technology integration has revolutionized the various industries, and financial industry is no exception. The approach of financial services from technology background, which currently popular with the term “FinTech”, is rising huge interest all over the world and also in Asian’s market. KPMG (2015) reported that in 2015, investment in Asia’s FinTech firm rising from $1.1 billion to $4.5 billion year-over-year. During 2015, China’s FinTech investment growing significantly, from just above $600 million in investment in 2014 to almost $2.7 billion in 2015 from significant deals (KPMG, 2015).
The local regulators in China were investigating FinTech’s opportunities at the first place in order to see how they can use FinTech to accelerate innovation as financial solution for SMEs that has been underserved by the large banks in past. There exists no regulation for FinTech’s industry at first in China for several years and the FinTech’s market growth exponentially without heavily regulated (Chen and Ernie, 2015). It is also important to highlight that China is the country with most mobile phone users in the world (Statista, 2016) and high internet penetration, reaching the rural area which enable the rapid adoption of new technologies, such as FinTech services.
Section 4. S
IGNIFICANCE OF THE STUDYConsidering the importance of SMEs to support the economic growth in Indonesia as developing country, the financial constraint facing by the SMEs need to be addressed. This study will focus on the potential of FinTech industry in Indonesia to support the growth of SMEs’ business by providing alternative financing support for the SMEs in Indonesia which currently have low access to bank credit and obtain sufficient work capital. The case of China’s FinTech industry will be selected as case comparison study along with literature review on general FinTech industry.
Section 5. O
UTLINE OF THES
TUDYFollowing this introduction chapter, the remaining of this paper is organized as follows.
Chapter 2 describes the overview of SMEs in Indonesia, which elaborates on the SMEs’
characteristic and major challenge for SMEs in Indonesia. Next in Chapter 3 elaborates on invasion of FinTech which consist of explanation of the FinTech evolution, the products of Fintech, the role of FinTech to support the growth of SMEs by learning from China’s FinTech industry. Chapter 4 describes the FinTech for SMEs in Indonesia, including the SMEs adoption to IT and the potential of FinTech industry in Indonesia, together with analysis in comparison to China’s FinTech industry case study. Lastly Chapter 5 presents the final conclusion and some recommendations.
CHAPTER 2. OVERVIEW OF SMES IN INDONESIA
Section 1. SME
SC
HARACTERISTIC INI
NDONESIASME play a major role in economic and social development of countries in world, both in developing and developed countries. As explained earlier, SMEs in Indonesia is representing one of model of SME in developing countries. According to Tambunan (2008), SMEs in Indonesia have historically been the main player in domestic economic activities and an engine for economic development. Although the growth of the Indonesian economy has been slowing since 2011 due to the result of the global financial crisis, the growth of SMEs in Indonesia has remain increased from time to time. It appears that the SMEs operation is not severely damaged from such crisis and could survive from the crisis. (Asia Development Bank, 2015). Moreover, it is also a large provider of employment opportunities, and hence a generator of primary or secondary source of income for many households. The term of SMEs mention going forward in this study is also going to include the micro enterprises in Indonesia.
2.1.1. Definition of SMEs in Indonesia
For firms to be considered as SME may different from one and another country. As for Indonesian SMEs, definition is provided under the Law No. 20 year 2008 on Micro, Small, and Medium Enterprises (“SMEs Law 2008”). Definition for micro enterprises in Indonesia just recently introduced under this SMEs Law 2008. Previously under the SMEs law issued on 1995, there is no definition provided explicitly for micro enterprises.
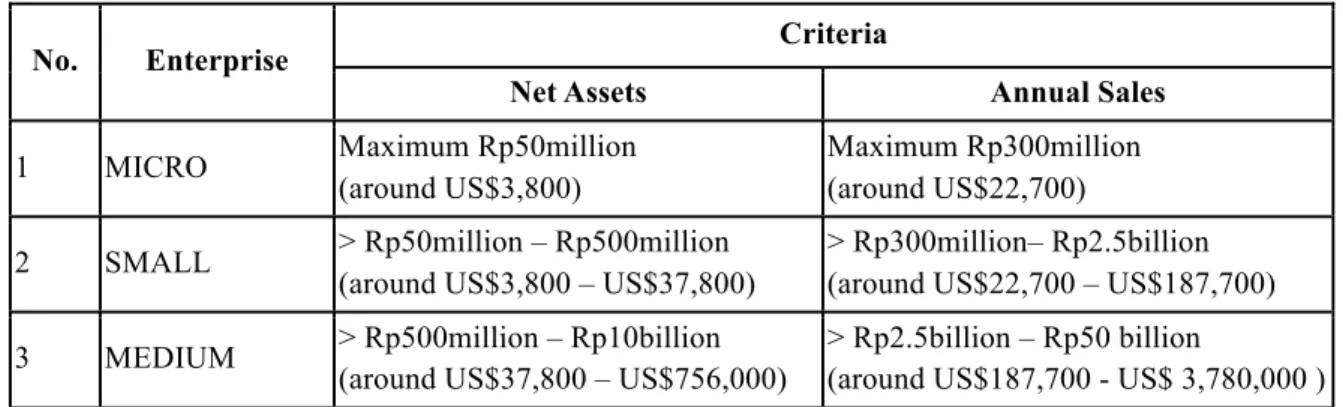
SMEs is productive entity owned by an individual or individual business unit with certain amount of net assets and sales. The foreign-owned entity is not included by SMEs definition. The criteria of SMEs in Indonesia basically divided based on the total net assets (excluding land and building) and annual sales of the firms.
Table 1: SMEs Criteria in Indonesia based on SMES Law 2008
No. Enterprise Criteria
Net Assets Annual Sales
1 MICRO Maximum Rp50million
(around US$3,800)
Maximum Rp300million (around US$22,700) 2 SMALL > Rp50million – Rp500million
(around US$3,800 – US$37,800)
> Rp300million– Rp2.5billion (around US$22,700 – US$187,700) 3 MEDIUM > Rp500million – Rp10billion
(around US$37,800 – US$756,000)
> Rp2.5billion – Rp50 billion
(around US$187,700 - US$ 3,780,000 ) Note: US$1 equivalent to Rp13,230 based on rate from Central Bank of Indonesia
as of 26 June 2016) 2.1.2. Growth of SMEs and Contribution of SMEs in Indonesia
According to the data provided by the Indonesia Ministry of Cooperatives and SMEs, as of 2013, there are around 57million of SMEs in total operated actively in Indonesia. As can be seen in Table 2 below, more than 99% of SMEs in Indonesian market are consisting of micro enterprises.
Deloitte (2015a) further stated in its study that the average years of operation of Indonesian SMEs at approximately 16 years, which considerably high.
Table 2: Data of SMEs vs. Large Enterprise in Indonesia as of 2013
No. Business Category Total Firms Total
Employees GDP Contributions (%)
1.
Micro, Small, and Medium
Enterprises (SMEs) 57.895.721 114.144.082 60.34
Micro Enterprises 57,189,393 104,624,466 36.90
Small Enterprises 654,222 5,570,231 9.72
Medium Enterprises 52,106 3,949,385 13.72
2. Large Enterprises 5,066 3.537.162 39.66
Source: Indonesia Ministry of Cooperatives and SMEs
The economic growth in Indonesia has been sluggish since 2011 however, the SMEs keep
bolster the national economy by constantly increasing the contribution to the GDP in Indonesia.
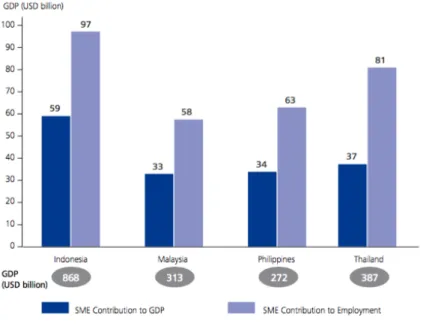
According to report by Deloitte (2015a), in 2012, SMEs contributes to 59% of the total GDP in the country, the highest among others three developing countries such as Thailand (37%), Philippines (34%), and Malaysia (33%). SMEs in Indonesia also noted to have important role as source of employment which stands to contribute at the highest (97%), followed by Thailand (81%), Philippine (63%), and Malaysia (58%).
Figure 1: SME Contribution to GDP and Employment in four Developing Countries
Source: Asia SME Finance Monitor 2013; SME Corporation Malaysia; Department of Statistics Malaysia; Indonesia Ministry of Cooperatives and SMEs; Thailand Office of SME Promotion SME White Paper 2014; APEC Policy Support Unit; DP Information Group
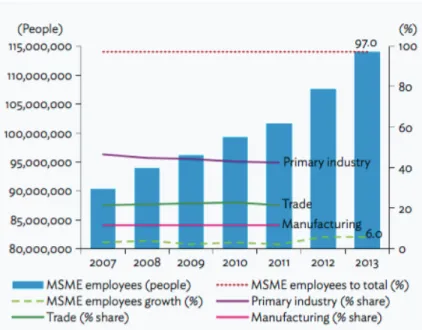
cited by Deloitte, 2015a As reflected in Figure 2, from the total of 114.1million SMEs employees or 97% of the total workers in the country, 42.4% worked in primary industry, while 21.7% work in trade sector (wholesale and retail), 11.7% work in manufacturing, and 10.5% sector work in service sector. This composition claim has not been changed for long time (Asian Development Bank, 2015).
Figure 2: Employment of SMEs in Indonesia, 2007-2013
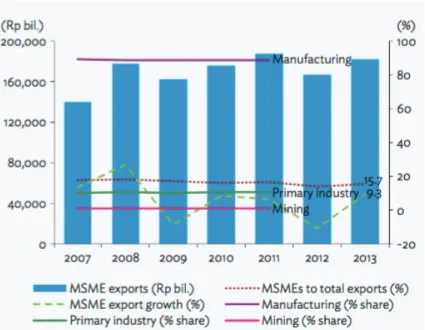
Source: Indonesian Ministry of Cooperatives and SMEs cited by Asian Development Bank, 2015 Most of the SMEs in Indonesia family-owned or self-employed microenterprises with small-scale routine operations within a limited area. Some business especially in traditional handicrafts and wooden furniture industries, traditional fashion industries and food industries, have developed their business models toward global marketplaces. As provided in Figure 3, Indonesian SMEs has accounted for 15.7% of total export values or Rp182 trillion, with 9.3% annual growth in 2013. However, the SMEs export industry remains volatile, affected by demands from foreign countries. SMEs exporters experienced sharply negative growth of –8.9% and –11.1% in 2009 and 2012, respectively, caused by the global financial crisis and the slow recovery of demand from trade partners such as the People’s Republic of China, Japan, and Europe (Asian Development Bank, 2015).
Figure 3: SMEs Export Activities, 2007-2013
Source: Indonesian Ministry of Cooperatives and SMEs cited by Asian Development Bank, 2015
Section 2. M
AJORC
HALLENGES FORSME
S INI
NDONESIASMEs in Indonesia face numerous issues in order for them to grow and expand. Indrayani et al. (n.d.) stated in their research that the common problem is, among others, (1) lack of good quality of human resources; (2) high price of raw material cost; (3) cash flow problem; (4) lack technical skills to promote the product in market; (5) insufficient government support; (6) still using traditional technology; and (7) difficulties in accessing bank facility, especially in rural areas. In brief, the SMEs problem in Indonesia can be divided into two major categories, the non-financial issues and financial issues.
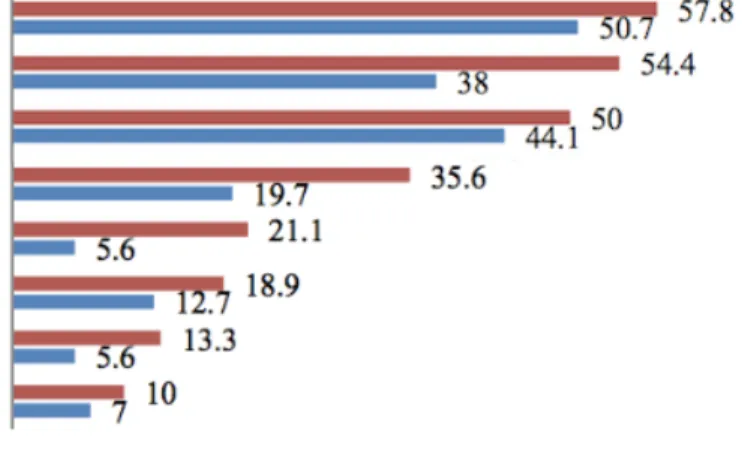
2.2.1. SMEs Non-Financial Issues
Figure 4: Non Financing Challenges of SMEs (in%)
Source: Machmud and Huda, 2011
According to research by Machmud and Huda (2011), both SMEs with and without sufficient access to finance surprisingly have similar main issues as their obstacle to growth. More than 50% express that the rising of business cost as their biggest problem to growth. The remaining obstacle as reflected in Figure 5, are similar varying only in sequence between the SMEs with and without access to finance; (1) the instability of consumer demand, (2) the increasing competition, and (3) difficulties in finding qualified labors.
Due to high competition in market, SMEs should be able to promote their product well in market. However, SMEs in general do not have the resources to explore their own markets. Instead, they depend heavily on their trading partners for marketing of their products, either within the framework of local production networks and subcontracting relationships or orders from customers (Tambunan, 2006).
Although 97% of the Indonesian workforce employed by SMEs, the labor productivity is still 10 times lower than that of large enterprises. Further, in context of of regulations, a complicated and costly licensing process and excessive tax compliance costs are the main challenges faced by
SMEs. These cumbersome and onerous business regulations and restrictions hamper an SME’s business activities. (Deloitte, 2015a). In this context, SMEs are looking for a less regulated business environment, and are high concerned to lowering business costs and improving overall their labor productivity.
2.2.2. SMEs Financial Issues
In terms of financial source, it is reported that the majority of SME investments were financed by internal funds and only 6% of SMEs using bank loan as source of financing (Deloitte, 2015a). Since SMEs in Indonesia are mostly microenterprises that located in rural/backward areas, they had little knowledge of financial issues (Shinozaki, 2012). They depend on their own savings, money from relatives, and credit from informal lenders for financing their daily business operations (Tambunan, 2006). Since they relying on their internal fund, SMEs are in better positioned to avoid the serious shocks from the financial and banking crisis than large firms. However, low access to finance negatively affected SME survival and growth rates in general. (Shinozaki, 2012).
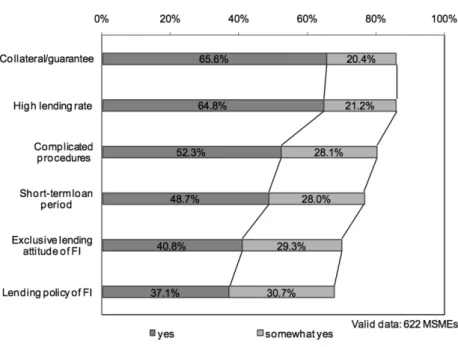
One of the challenges in SME financing is that their financial requirements are too large for microfinance, but are too small to be effectively served by corporate banking models. According to survey conducted in 2010 with 622i microenterprises in Indonesia by Shinozaki (2012), more than 60% of respondents implied that the collateral/ guarantee requirement and the high lending rate are the biggest barriers for SMEs to access the financing. SMEs still considered by commercial banks and financial institutions as risky and costly to serve, as a result SMEs are largely underserved when it comes to basic financial services. SMEs therefore require some form of external financing to cover financing needs.
Figure 5: Barriers to Financial Access
Source: Shinozaki, 2012
Information asymmetry is often quoted as a critical factor in SMEs’ funding difficulties.
Due to high costs for transactions and information collection, as well as immeasurable risks, financial institutions generally hesitate to finance SMEs. To mitigate such risks and reduce the cost burden, financial institutions oblige SMEs to fulfill steep collateral and guarantee requirements, and apply high interest rates. Not surprisingly, SMEs tend to regard these measures as serious supply-side barriers.
Shinozaki (2012) further emphasized that SMEs comprise a variety of firms in terms of sector, scale, and management style. Therefore, a one-size-fits-all approach to SME financing would be useless. The appropriate financing scheme differs by growth stage of the SME and by level of economic development of the host country. Since SMEs are a critical component of economic and social stability in a country, improving financial access for SMEs is expected to bring many benefits, including enhancing production quality, increasing new business opportunities, stimulating investment and consumption at the national level, and mobilizing excess corporate savings.
Section 3. I
NDONESIANSME
SF
INANCIALS
UPPORTS
CHEME FROMG
OVERNMENTIn order to address problems of accessing the financial support, Indonesian government created some credit programs which mainly focus on loan to SMEs which namely the Small Enterprises Development Program (KIK-Kredit Investasi Kecil/ KMKP-Kredit Modal Kerja Permanen), the Small Enterprises Credit Program (KUK-Kredit Usaha Kecil), and the Micro Credit Loan Program (KUR – Kredit Usaha Rakyat).
2.3.1 The Small Enterprises Development Program (KIK/KMKP)
This program was established in 1973 where government provide the loan interest subsidy for small enterprises owned by the local Indonesian people (called pribumi), including the cottage enterprises. The loan mainly purpose for the investment and working capital. The program managed by five state-owned commercial banks, the Indonesian Development Bank (Bapindo – Bank Pembangunan Indonesia), all regional development banks (BPD- Bank Pembangunan Daerah) and other 14 private banks. However, due to high default rate reaching of more than 27%, this credit programs were stopped in 1990.
2.3.2 The Small Enterprises Credit Program (KUK)
After failure in the first program (KIK/KMKP), in 1990 the government initiated new credit program called KUK. This program require all commercial banks in Indonesia to allocate 20%
of their loans to SMEs for helping their investment and working capital. Unlike the KIK/KMKP program previously, the KUK was created to to assign interest at market rate rather than at a subsidized rate. However, repeating experience in KIK/KMKP program, KUK also did not perform successfully. The banks were having difficulties in satisfy the requirement of 20% loans to SME. It appeared that the banks tend to allocate more of their loans to consumption rather than the business purposes.
2.3.3 The Micro Credit Loan Program (KUR)
Under the Presidential Instruction Number 6 of 2007, the government then introduce the government guaranteed loan for micro and small enterprises called KUR. This program established to mitigate risks associated with SME finance and to enhance the bankability of SMEs that lack collateral. This scheme requires project or business activity as the principal collateral for the loan and is intended to provide working capital and investment credit of up to Rp500 million. The loan providers are commercial banks appointed by the government and there is no interest subsidy in this scheme.
Based on a report from the Coordinating Ministry for Economic Affairs (CMEA), it is claimed that during the period January-December 2010, six Indonesian banks (BRI, BNI, BTN, Bank 267 Mandiri, Bank Syariah Mandiri, and Bank Bukopin) and 13 regional development banks (BPD) disbursed approximately Rp17.23trillion to 1.437.650 debtors so it appears that the KUR program has sharply boosted microenterprises’ access to banks. However, some banks are still facing several constraints in distributing the loans under the KUR scheme.
For instance, the first and second screening of guaranteed credits for SMEs may not be well organized due to the banks’ expectation of credit risk mitigation through the guarantee, and the guarantee institution’s insufficient human resources for screening loans. Other than that, the banks are often still demand additional collateral from prospective customers (i.e., 30% of total loan).
Some applicants also found out to request loan for consumption purpose instead of financing their business. Therefore, in general, credit guarantees are considered a difficult business to operate profitably.
CHAPTER 3. INVASION OF FINTECH
SECTION 1. FINTECH EVOLUTION
In this present world of 21st century, technology has reached to each and every segment of people lives. As technology integration advances, the various working industries also has been revolutionized by it, and financial industry is no exception. The technology which enable financial solution is known as “FinTech” – short for “Financial Technology”. FinTech, according to the global report of PWC (2016), is a dynamic intersection of the financial services and technology sectors, where technology-focused start-ups and new market entrants innovate the products and services currently provided by the traditional financial service industry. In recent years, FinTech is gaining its momentum in all over the world. 2015 is considered as year of FinTech entered the mainstream when venture capital firm making enormous number of investment in FinTech.
Although most people just recently heard and get into deep discussion about FinTech, in fact, FinTech is not a new story in financial industry, since financial and technology have been connected one another over long time ago. There are three main eras of FinTech according to the study of FinTech by Douglas, Janos, and Ross (2015). Firstly, it is started with a period which characterize as the FinTech 1.0.
during year 1866 to 1967 then followed by the FinTech 2.0 which started around year 1987 until 2008, and lastly counted since 2008, the FinTech 3.0.
3.1.1 FinTech 1.0 (1866-1967)
In this period of time, the development of digital technology for communications and processing of transactions increasingly transformed finance from an analogue to a digital industry.
The concrete historical example for such correlation are divided further below.
1. Before 19th Century – the earliest example is in the context of Mesopotamia where written records evidence for financial transaction, followed by double entry accounting which also another technology basis to a modern economy emerged from the intertwined evolution of finance and trade in the late Middle Ages and the Renaissance.
2. Late 19th Century – the first age of financial globalization has started until the First World War, where the telegraph, railroads, canals and steamships underpinned financial interlinkages across borders, allowing rapid transmission of financial information, transactions and payments around the world.
3. Early post-war period – the innovation of the code-breaking tools were developed commercially into early computers by firms such as International Business Machines (IBM), and the handheld financial calculator was first produced by Texas Instruments in 1967. One of important development in financial industry is occurred during this time, known as credit cards, which initiated by the Americans.
3.1.2 FinTech 2.0 (1967-2008)
The beginning of FinTech 2.0 is marked by the launch of the first ATM by Barclays in UK on 1967. Followed by the establishment of NASDAQ in US on 1971 which transform the physical trading to fully electronic trading of securities. In consumer area, online banking was firstly introduced in the UK in 1983 by the Bank of Scotland which connecting between the television set and telephone to send transfers and pay billsii. By the end of 1980s, financial services had become largely a digital industry, based on electronic transactions between financial institutions, financial market participants and customers around the world.
Another important momentum of FinTech 2.0 was the application for the Internet of Things (IoT)iii. The emergence of the internet in financial industry is started in the beginning of 1995 when Wells Fargo used the World Wide Web (WWW) to provide the online account checking and then followed in another decade later, the first direct banks without physical branches begin to offer their online services (ie., ING Direct, HSBC Direct), PC Financial, eTrade Bank) (Yodlee, 2012).
As can be seen from the historical event mentioned earlier, financial institution have increased their usage of technology in their operations significantly from time to time. Another example which evidence the urge of utilizing technology in financial institution is a fact that huge number of people hired as technology specialist in mega bank’s workforce such as, Goldmann Sachs, Morgan Stanley, JP Morgan, Citigroup and Bank of America. It is even reported by Business Insideriv that around 9,000
workers in Goldmann Sachs are engineers and programmers which number counted more than programmers and engineers working on Facebook, Twitter, or LinkedIn. Bank has apparently made numerous investments in technology and financial services in the post crisis years. In short, it appears that the era of FinTech 2.0 is limited by the usage of technology innovation by the licensed financial institutions
3.1.3 FinTech 3.0 (2008 - present)
The transition of FinTech 2.0 to FinTech 3.0 happen during 2008, when new start-ups and established technology firms (categorized as non-banking firms) start to deliver financial products and services directly to consumer in public. There are different backgrounds as to what trigger the FinTech 3.0 to be born in economic category wise. In developed countries where countries are more industrialized and have higher per capita income levels, the FinTech 3.0 is driven by public expectations and demands, the movement of technology firms into the financial industry and also political demands for a more diversified banking system. However, in developing countries, particularly in Asia, Fintech 3.0 has been driven by the needs of development and the inefficiencies in the existing financial system, combined with the rapid introduction and reach of new technology, particularly mobile communications.
In 2015, innovations in banking took center stage in the FinTech space. Across the world, investors were drawn to the potential of FinTech firms, not only as a disruptor to big banks, but as an enabler for big banks to kick-start their own innovation instead (KPMG, 2016). The funding of FinTech start-ups according to PWC (2016), has reached US$12.2bn in 2015.
Section 2. P
RODUCTS OFF
INTECHThe term of “FinTech” that referred to, and elaborated further, in this research is limited for the FinTech 3.0, which innovated by non- traditional financial institution. Many financial experts predict that the explosion in the number of FinTech companies might affect some parts of existing traditional financial sector, mainly in consumer banking, fund transfer, and payments. It remains
services.
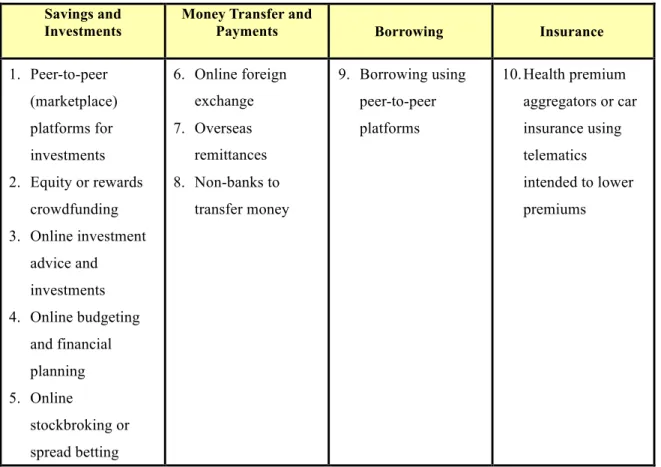
In order to see the potential of disruptor by the FinTechs, firstly it is important to have understanding on what kind of financial services mainly offered by the the FinTechs. Based on the surveyv conducted by Gulamhuseinwala, Thomas, and Steven (2015), it is discovered that there are approximately 10 most used FinTechs services currently available in the industry which can be categorized further into four major categories as set out below.
Table 3: FinTech Products Savings and
Investments
Money Transfer and
Payments Borrowing Insurance
1. Peer-to-peer (marketplace) platforms for investments 2. Equity or rewards
crowdfunding 3. Online investment
advice and investments 4. Online budgeting
and financial planning 5. Online
stockbroking or spread betting
6. Online foreign exchange 7. Overseas
remittances 8. Non-banks to
transfer money
9. Borrowing using peer-to-peer platforms
10. Health premium aggregators or car insurance using telematics intended to lower premiums
Source: E&Y Journal of Financial Perspectives: Fintech, 2015
3.2.1 The Online Platform-based Alternative Financing Activities 4.2.4.1. Crowdfunding
Crowdfunding is one of new model of investment which potentially the most disruptive for traditional financial industry (Terry, Debra and Tina, 2015). According to Gaskell from Forbes, crowdfunding generated an estimated $2.1 billion in investment for startups in 2015, and that is expected to grow considerably in 2016.
Crowdfunding is an emerging trend where entrepreneurs raise capitals from the community to contribute in completing their project. There are mainly two types of crowdfunding, known as rewards-based crowdfunding and equity-based crowdfunding. Rewards-based crowdfunding platforms allow entrepreneurs to raise funds from the community as investor in exchange for their tangible products or service, without incurring debt or sacrificing equity (Johnston, 2015). Therefore, any investment in a rewards-based crowdfunding project even the project turns into a huge financial success, the investor will not receive any of the profits. Two of the most popular rewards-based crowdfunding sites are KickStarter and IndieGogo (Crowdability, 2016).
Meanwhile, in equity-based crowdfunding, the company issues equity – shares of company stock – to participating investors on a proportional basis. Therefore, when a successful company is sold to another firm or launches an IPO, the investor may receive a substantial return on their investment. On the other hand, in unsuccessful case, the investor may stand to lose part or all of their investment. AngeList is one example of the most established equity-based crowdfunding platform (Brian, n.d ).
4.2.4.2. PP2P L2P Lending Platform
According to World Economic Forum (2015), since the first platform launched, the P2P lending has become a global market with a multitude of different business models and high- projected future growth rates. The peer-to-peer (P2P) platform generate revenue from interest management in addition to the loan management. However, the loan management is considered most attractive service and therefore generate revenue the most from this financing business model.
Generally, marketplace lending refers to the practice of lending money to borrowers without going through a traditional financial intermediary such as a bank. These marketplaces have benefitted from low interest rates and low default rates during the economic recovery along with the relatively less availability of consumer credit. Their efficient cost structure and regulatory advantage allow for interest rate arbitrage while they have also improved on the frictions in the existing lending processes (Terry, Debra and Tina, 2015).
In addition, Terry, Debra and Tina (2015) also point out some factors which have enabled the growth of P2P lending in FinTech industry, among others:
1. Favorable macro environment. The marketplace lending model was born as a direct result of tightened regulation stemming from the financial crisis. Since then, a low interest rate environment and historically low delinquencies for consumer loans have attracted inventors searching for yield, therefore amassing years of data supporting credit models. However, this environment has also avoided any real stress testing of the model.
2. Changing demographics and consumer behavior. Millennials are reaching the age of financial independence and are increasingly in need of financial services such as lending.
14% of Millennial small business owners are already using alternative, non-bank financing, according to a Bank of America survey.
3. Data, technology, and automation driving cost advantage and ease of use. The availability of data on an individual loan basis and the technology platform of many of these lenders give them the ability to create a robust credit model, offer a quick loan application, and, relative to traditional lending, approve or reject applications nearly instantaneously.
The data advantage of the marketplace lenders stems from three sources: (1) the online-only data such as IP address and current and historical browsing patterns on the website, (2) real time credit monitoring through the use of social platforms, and (3) tens of thousands of loan performance data at the individual loans level, instead of by tranche. Individual loan-level performance data allows the marketplace lenders to build credit models across a much greater variety of factors that cannot be done with tranche-level performance data alone.
4. Strong network effects and cost advantage drive attractive unit economics. As a result of the strong network effects and technology-enabled cost advantage, these online lenders can target smaller loans in an economically favorable way, enabling them to serve a generally under-banked segment of the market.
5. Regulatory advantage. Because the majority of these lenders operate on a marketplace model and do not take traditional credit risk, they can operate with capital efficiency with no
capital requirements, automatically matched assets and liabilities, and lower regulatory overhead costs. Further, they are not currently directly regulated by the financial bureau, allowing greater flexibility in offering different rates to different types of borrowers, thereby creating additional efficiencies in the marketplace.
Due to the above reason, P2P lending industry has attracted investment from various capital operators including micro-finance, guarantee, venture capital and publicly listed companies, banks and even local governments. It could provide real finance solution for some sectors which underserviced by the banks.
The unsecured lending is the most common form of marketplace lending to date. As such, no collateral is required. Thus, as reported by the World Economic Forum (2015), small businesses benefit the most from this, particularly in the service sector mainly because often such businesses have rather stable cash flows but no tangible collateral that banks could lend against. The P2P lending also applies innovative credit assessment models which semi-automated and leverage nontraditional data points which allows for assessing credit risk where banks have traditionally not been able to do so, especially in markets with limited credit bureau information. However, this situation also trigger potential risk accumulated in P2P industry due to such deficient internal management and loopholes in existing law and regulations (Lufax, n.d.)
There are two types of P2P lending namely P2P consumer lending and P2P business lending. Main factor which distinguish between two is the funding mechanism and the financing purposes (Zhang, et al., 2015).
P2P consumer lending - In this model, individual borrowers acquire mostly unsecured personal loans from a number of other individual lenders (often lending a small amount each) through an online P2P “marketplace”. This model of alternative finance offers access to comparatively low-cost consumer credit for borrowers (often with prime credit ratings) and competitive interest rates (in contrast to bank savings) to lenders and often has the benefit of combining efficiency, speed and a relatively low-risk problem.
P2P business lending – this model is a relatively new alternative finance model in Europe but is
developing rapidly in a number of key markets. It allows predominately small and medium-sized enterprises (SMEs) to obtain growth and working capital directly from a pool of online investors (both individual and institutional), bypassing a sometimes prolonged and uncertain bank-lending processes. For many SMEs, the speed with which they are able to obtain business loans, the often more flexible and attractive terms of financing (e.g., no penalty for early repayments on many platforms), as well as transparency and ease of use, are determining factors that make P2P business lending a viable business funding alternative.
Some example of success deal of P2P lending is the IPO of LendingClub and its notable SME financing partnership with Google, Alibaba and a growing trend of institutional lending.
Crowdfunding and P2P lending exist as well-known financial alternatives model that could help entrepreneurs of small business company to boost up and expand the business. In practice, some people are not really able to identify the basic difference between crowdfunding model and P2P lending platform. This is very important, especially for entrepreneurs, to understand which financing models fits better for the business. Both models are having similarities but also different implications in terms of cash flows and profitability concern. Usually the brand new start up business will look for crowdfunding because they do not need current business cash flow or profitability in order to raise the fund. The fund raising will purely depends on the idea and business model, so as long as the investor believe in it, the fund can be obtained. On the other hand, in P2P lending, investor really concern to see the detailed plan, business history, financial statements (in average within the past 2 years), profitability and any information related to the business. However, when the money has been invested in, on crowdfunding model the regular reporting might require by the investors since they want to keep track on how the business is being run, meanwhile in P2P lending, the investors will not get involvement as long as the loan repaid on time (Lee, 2015). As mentioned in Section 3.2.1.1 above, the investor in crowdfunding is offered with shares or position at the firm so that is the reason why the investor will remain involve in day to day business.
Section 3. R
OLE OFF
INT
ECH TOS
UPPORT THEG
ROWTH OFSME
S IND
EVELOPINGC
OUNTRIES(C
ASES
TUDY OFF
INT
ECH INDUSTRY INC
HINA)
3.3.1 History of Financial Market in China
Before 2000, the Chinese financial industry was lagging behind those of many other countries, and the financial infrastructure was insufficient, and commerce-related fraud was commonplace. In addition, China’s technical capability with regard to information technology (IT) was low, and the key hardware and software used in major banking systems and e-commerce applications came mostly from foreign companies (Yongowoon & Dong-Hee, 2015).
Local internet companies just launched various e-commerce-related businesses in the end of 1990s. Alibaba, now the biggest e-commerce company in China, was established in 1999. Others were 360Buy (online retailer, now Jindong Mall), Dangdang (online book store), and EachNet (online auction platform). However, China’s e-commerce had been involving only information flow and small and medium-sized enterprises (SMEs) could get hardly access to the bank transaction system. Alibaba then started to turn its focus to the business area of small and medium-sized enterprises (SMEs) in China (Yongowoon & Dong-Hee, 2015).
In 2003, Alibaba decided to start its customer-to-customer (C2C) marketplace called Taobao. It operated under the same business model as eBay, providing an online marketplace, payment solutions, and technological infrastructures to match buyers and sellers. However, unlike eBay, Alibaba was merely an e-commerce site for SMEs conducting business online. Moreover in 2005, Alibaba introduced an online escrow payment system, Alipay, that allowed buyers to wire money from their bank accounts to Alibaba. This method was perceived by many Chinese customers to reduce the settlement risk; it ensured that goods were delivered and payments were made between sellers and buyers. Acting like a temporary bank between buyers and sellers, Alipay was a key driver for Taobao’s exponential growth.
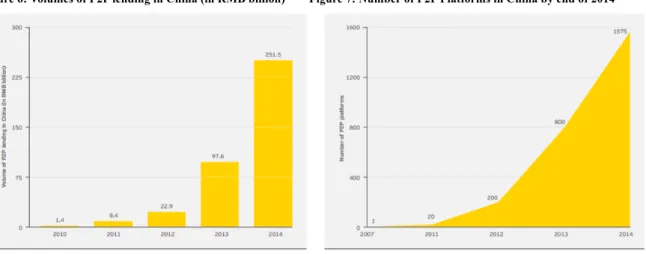
Since 2007, the barriers to entry into China’s financial system have been bypassed by
private individuals and internet finance companies delivering directly to the public and SMEs more than RMB251billion of credit in 2014 with total 1,575 numbers of P2P platforms in the same year.
Figure 6: Volumes of P2P lending in China (in RMB billion) Figure 7: Number of P2P Platforms in China by end of 2014
Source: E&Y Journal of Financial Perspectives: Fintech, 2015
According to report from Accenture (2014), Alibaba then entered into a partnership with the Industrial and Commercial Bank of China and the China Construction Bank in 2009 to help facilitate loans to domestic small business customers in China. Given that 85% of all loans went to other state-owned enterprises (SOEs), leaving little for private companies and particularly SMEs.
Alibaba’s strategy represented a potentially effective way of forming an actor network with SMEs.
SMEs became interested in the solution proposed by Alibaba because Alibaba's interest was not different from those of them. In 2010, Alibaba launched a specialized company serving the SMEs lending segment. Alibaba Alibaba extended its finance business through alliances with banks, insurance companies, funds, securities companies, and so forth. Through these alliances, it created multiple new agreements that have yielded a huge market impact. Alibaba, which started as an e-commerce company, is now one of the biggest FinTech companies in the world. Alibaba has created 2.87 million direct and indirect job opportunities, and providing over 400,000 SMEs with loans ranging from $3000 to $5000 (Arner, Janos, and Ross, 2015).
Other than Alibaba, actually there are some companies which also focus on lending to small business in China. PPDAI was the first online P2P platform in China established by former Microsoft Corp.’s engineer. PPDAI’s primary focus is to lend to online small businesses that sell
through Alibaba with over 80% of all loans going to small businesses. PPDAI uses online data about the small businesses like seller ratings, user ratings, and social networking presence to determine the credit quality of their borrowers (Jason, 2014). PPDAI is facing increased competition from Alibaba which has created its own SME financing arm. There is also RenRenDai which one of the largest and fastest growing P2P lending platforms in China. Similar to PPDAI, RenRenDai offers loan to consumers and small businesses as well. The growth of the company is huge. They grew over 800% in 2012 and grew 342% in 2013.
In 2011, PBC began issuing licenses to qualified third-party online payment platforms to conduct electronic payments, after announcing the program in 2010. The licenses covered Internet payment, mobile phone payment, and bank card acquiring service. In due course, TPP services shifted from a single-platform to a cross- platform service, in partnership with a variety of players, such as mobile platforms, SNSs, and pre-paid cards both online and offline. TPP companies were well qualified to develop various types of innovative business models and services with other industry players.
In 2014, following the government’s approval, a total of 250 companies in China received a payment license, including 90 for online payment and 37 for mobile phone payment with Alibaba as the frontrunner. During this time, more and more Chinese companies inspired by Alibaba’s success established the investment platform and the pace of FinTech innovation has been wildly increasing.
In July 2015, China’s peer-to-peer (P2P) lending platforms counted 2,136, with settlements of about RMB82.5 billion transactions in that single month, making it the country with the most P2P platforms in the world. As the sector went from one platform in 2007 to more than an estimated 2,000 platforms currently It is also reported the platform has delivered directly to the public and SMEs more than RMB251 billion of credit in 2014. (Douglas and Janos, 2015).
3.3.2 Growth Factor of China P2P Lending Industry
The high usage of P2P lending services in China is driven by the rapid Chinese adoption of new technologies which already reaching through the rural areas. As cited by Emarketer (2015),
rural areas nearly quadrupled between 2007 and 2014. It also rose dramatically in urban areas during the same time period, though the rate of penetration in cities less than tripled.
Table: 4 Internet User Penetration in China, by Geographic Locale, 2007-2014 (% of population)
Source: China Internet Network Information Center cited by Emarketer, 2015 As stated by Shrader and Eric (2014), there are more than 1.15 billion mobile phones in China, which has also become the largest global market for smartphones. It is estimated that in China’s biggest cities, smartphone penetration is approaching 50 percent and nearly half of China’s mobile subscribers live in rural areas. As of 2013, there are 624 million internet users (45% of the total population) and 28.9% of China’s population had 3G and 4G connections. However, despite of enormous number of population who acquire mobile technology in China, there are 432 million population in China who do not have any bank account, which represent 36% of population (Douglas, et.al., 2015). The total of physical bank also relatively low compare to the number of population in China itself, unlike in the western country such as USA and UK. Chinese unbanked populations may have a comparative advantage over many unbanked in the world in its ease of access to and rapid adoption of technology.
This mismatch situation between the technology readiness and the number of physical bank in china provides the high opportunity of penetration in FinTech industry in China. China’s credit market also has suffered from allocation inefficiencies that affect its SMEs. Meanwhile, SMEs represent 80% of the economic output in China (Douglas and Janos, 2015). The penetration of P2P lending platform in China therefore is considered as one perfect solution to address the issue of
credit facility in China.
According to white paper issued by Lufaxvi (n.d.), the P2P platforms in China generate most revenues through loan management, interest management and other value-added services.
However, the loan management charges account for the largest proportion of total platform revenues (over 70%). Not factoring in expenses they incurred in compensating bad debts, gross margin in the P2P lending business is pretty high and may even exceed 20% in some cases This is also why the P2P industry has attracted investment from various capital operators including micro-finance, guarantee, venture capital and publicly listed companies, banks and even local governments, and why the number of P2P platforms in China has gone through explosive increases in recent years.
3.3.2.1. Characteristic of P2P Lending Platforms Users in China
In October 2015, the Association of Chartered Certified Accountants (ACCA), conducting survey on the China’s P2P lending market which surveyed over 935 borrowers and lenders as user of one of leading P2P platform in China, PPDAIvii. The findings are divided into four categories of users:
(1) The individual borrowers (342 respondents)
52% of the individual borrowers reported a low-income range and 63% worked in private business (but does not reveal how many of these respondents were employees or business owners). 51% purpose of the loan made by the individual borrowers is to accumulate their credit worthinessviii and only 7% utilize the loan for working capital.
(2) The individual lenders (515 respondents)
Lenders reported to be more highly educated than borrowers. 56% having completed the university-level degrees. Most of lenders stated that they were carrying out investment on their own behalf. As for the reason for investing through PPDAI, 65% claim they want to get higher returns of investment compare to the bank interest rate. About 10% of lenders make investment to support the SME financing.
(3) The business borrowers (35 respondents)
The findings showed that business borrowers tend to have higher incomes than the individual borrowers and have no previous experience of borrowing from other financial institution but they had some trade credit lineix with, for instance, AliFinancex. The largest proportion (40%) of the business borrowers are small and micro business. 74% of the business borrowers are tertiary educated, of these, 52% had completed college and 22% had university-level qualifications.
Their loan purpose is mainly for daily short-term cash flow and as for the common reason choosing the P2P platform for financing 87% responded because it has the low threshold and simple borrower audit process. Most of them also had a formal written business plan and most had financially trained or qualified person in charge of business finances.
(4) The dual borrower and lender (43 respondents)
Most dual borrowers and lenders had their own business enterprises. 27% reported that their business had been operating for between 5 and 10 years. Most reported a very low business sales revenue. The main reason for borrowing is similar as individual borrower, 77%
responded to accumulated credit worthiness, and followed by meeting daily short-term cash flows needs.
They pick P2P platform because bank loan usually has strict loan qualifications and shallow relationship with the banks.
3.3.1 FinTech Regulatory Framework in China for P2P Lending Platform
Regulators face a dilemma since SMEs are the main engine of economic growth in China today, and it seems that P2P lenders are almost the only financial institutions still willing to make loans to SMEs in China in the current economic climate. Therefore, the growth rate of P2P lending industry in China is unavoidably overwhelming. However, these recent years, there are also numerous cases of illegal financing, illegal fundraising, and fake investment occurred through P2P
lending platform in China. Since the existence of first P2P lending platform in 2007, until it has reached more than 1,500 platforms in 2014, there is no regulation directly govern this industry in China. The absence of formal regulation in P2P lending industry in China had the effect of removing any barriers to entry which allowed that platform operators, lenders, borrowers quickly to enter the market, and as a result, the P2P lending industry has grown significantly in China. However, it leads to increase the number of fraud and default P2P lending firms operated in China as the negative implication of the absence of regulation.
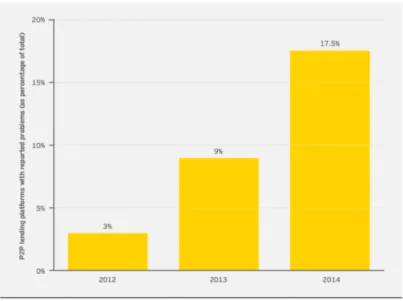
Figure 8: P2P lending platforms with reported problems (as percentage of total 1,575 platforms)
Source: E&Y Journal of Financial Perspectives: Fintech, 2015
Starting in mid-2014, Chinese regulators has increased the consultation activity to gradually consider the imposition of rules for P2P platforms in China, which will cover on regulatory capital, licensing obligations as well as better loan origination and credit scoring mechanisms so as to avoid excessive problems in P2P platform industry in China (Douglas and Janos, 2015). In 2015, the China Banking Regulatory Commission (CBRC) finally released the P2P lending regulations. However, whether or not the regulation is actually effective to address the issues on P2P platform, it is essential to know the problem related to the P2P platform before the issuance of the regulation.
Based on report by Lufax (n.d.), risks related to P2P lending platform in China are mainly, among others:
1. Risk related to the fund management. There is no escrow account set up in most P2P platform business. So basically funds of lenders and borrowers are directly credited from the account of P2P platform company which trigger higher risk of funds being abused, as well as risk of “self-financing” and “false financing”. Only some P2P platforms engage certain banks to open the escrow account.
2. Risk related to credit checks. Many P2P platforms do not have specialized risk controls and credit check team. Therefore, there is a potential risk of bad debt prevention failures. The majority of them still have not set up standards for regularly assessing, tracking and disclosing the sources of funds for loan repayment on the part of fundraisers (borrowers).
Hence, the investors do not have direct access or tools to judge and track the reliability of loan repayments they receive.
3. Operational risks. In a bid to increase liquidity for lenders by matching yields with loan maturities, many platforms develop capital pooling so impossible to track capital movements.
4. Information safety risk. Some P2P platforms – particularly those “missing” platforms – bought “semi-finished” websites directly from third-party companies developed with open source codes, and even outsourced website backend operations to third parties, resulting in exposure of company and user information. In the case of a website access technical issue, the resulting psychological impact on investors may spark a run on the platform due to information asymmetry.
China’s government introduced the non-bank providers of online payments services regulation to address problems occurred in P2P lending industry in China on December 2015. The regulation will become effective as of 1 July 2016 (Jingui, 2016). However, China’s government has previously released the first regulation in July 2015 regarding the guidelines on the promotion of the healthy development of internet finance (Internet Finance Guidelines) which also govern the P2P
lending therein.
As reported by ACCA (2015), some important highlight of the regulations are, among others:
1. minimum registered capital requirements will be imposed for internet finance companies;
2. capital pooling will not be allowed (only direct one-to-one lending allowed, no fund pools);
3. loan guarantees will not be allowed (on principle or interest); and
4. providers must have experienced management and credit-risk management teams.
In addition to the above highlights, Li (2016) also added some requirements for P2P platform providers, among others:
1. platform should register with local financial regulators and local regulators will rate and categorize platforms after displaying the information publicly;
2. platforms should report loan data to an online lending central database established by the central government;
3. platform should disclose the basic borrower information, loan information, and platform loan statistic publicly;
4. platforms should use fund custodianship services offered by qualified banking financial institutions; and
5. platforms should conduct annual third-party audits and submit the audit report to local regulators within four months of their fiscal year-ends,
and as for some restricted activities are among others:
1. conducting business offline at physical locations, with the exception collecting loan information, loan review, debt collections, and management of loan collateral as well as other risk management activities;
2. making investment decisions for investors, so any automated investing will be forbidden even if the investor grants permission to the platform;
3. using the platform for self-financing or financing of related-parties;
4. selling bank wealth management products, mutual funds, insurance annuities and other
financial products;
5. collaborating with other investment or brokerage businesses to bundle, sell or broker investment products, or directly making loans to borrowers, unless stated otherwise by applicable laws and regulations
6. Providing false loan information or create unrealistic return expectation; and 7. Facilitating loans for the purpose of making investments in the stock market.
From the above brief summary on the regulation, it seems to sufficiently address the recent problems occurred through the various illegal activity of P2P platform in China. The regulation most likely to promote risk management and establish much-needed ground rules to limit the prevalence of unsound practices and illegal activity which keep happening recently in the industry. China’s regulators are more interested in controlling undesired activities rather than setting legal barriers to entry. Any violations on the platform activities will likely result in a complete shutdown of operations and possible prosecution by law enforcement. (Li, Spencer, 2016).