九州大学学術情報リポジトリ
Kyushu University Institutional Repository
Study on novel functional activated carbon and composites for adsorption heat pump systems
アニメシュ, パル
http://hdl.handle.net/2324/1959153
出版情報:九州大学, 2018, 博士(学術), 課程博士 バージョン:
権利関係:
Study on novel functional activated carbon and composites for adsorption heat pump
systems
Dissertation
Animesh Pal
(M. Eng. (KU, Japan), M. Sc. (DU, Bangladesh))
Department of Energy and Environmental Engineering Interdisciplinary Graduate School of Engineering Sciences
Kyushu University, Japan
June 2018
Study on novel functional activated carbon and composites for adsorption heat pump
systems
A dissertation submitted in partial fulfilment of the requirements for the award of the degree of
Doctor of Philosophy
By
Animesh Pal
(M. Eng. (KU, Japan), M. Sc. (DU, Bangladesh))
Supervisor: Professor Bidyut Baran Saha Co-supervisor: Associate Professor Kyaw Thu Chief examiner: Professor Takahiko Miyazaki
Examiner: Professor Yukihiro Higashi
Department of Energy and Environmental Engineering Interdisciplinary Graduate School of Engineering Sciences
Kyushu University, Japan
June 2018
Dedicated to My Parents
&
Wife
Page | i
Summary
Conventional heat pump systems are responsible for the carbon footprints from the usage of considerable amount of electricity and chemical refrigerants having ODP and high GWP. Owing to the energy crisis and imposing of international regulations on the production and use of environmentally harmful refrigerants, research on adsorption heat pump (AHP) systems have been greatly intensified worldwide. Adsorption heat pump (AHP) systems being driven by industrial waste heat or solar heat offer as a promising alternative to tackle the energy crisis and environmental issues. However, their widespread adoption is hindered by advancements in the adsorbent material.
Among the various adsorbents studied so far, activated carbon (AC) has been proven potential adsorbents for AHP applications due to its high surface area and pore volume. It is also proven that adsorption uptake of ethanol and CO2 onto AC increases with the increase of pore volume. However, the pore volume of AC found in open literature is not promising to increase the adsorption uptake at the preferred level for its commercial dissemination. Furthermore, thermal conductivity of AC is relatively poor because of its powder form and low packing density. As a result, AHP systems are bulky and low performance, which hinders for spreading this novel technology.
From the above perspective, this thesis emphases towards the development of high performance ACs from relatively cheap and renewable precursors and consolidated AC composite adsorbents. The research strongly stresses on two factors, firstly, on the synthesis and characterization of the highly porous ACs from the two precursor biomasses (waste palm trunk and mangrove). Secondly, it includes the synthesis and characterization of composite adsorbents to enhance the thermal conductivity into the adsorbent material.
Finally, this thesis presents the feasibility study of newly developed promising biomass- derived ACs and composites from the viewpoint of AHPs application using ethanol and CO2 as the refrigerants. Apart from the synthesis, characterization, and adsorption characteristics of ethanol and CO2 onto biomass-derived ACs and AC composites, the thesis provides the equilibrium thermodynamic analysis of adsorbents/ethanol and adsorbents/CO2 pairs for adsorption cooling applications.
Three types of adsorbents are synthesized; i) waste biomass-derived activated carbons (ACs), ii) AC composite adsorbents using expanded graphite (EG) and graphene
Page | ii nanoplatelets (GNPs), and iii) AC composite using polymerized ionic liquid (PIL) as a binder. Experimental investigations on the surface characteristics including surface area, pore volume, and pore size distribution of all synthesized adsorbents have been furnished.
The thermal diffusivity and conductivity of all developed adsorbents are measured and promising are selected for the measurement of adsorption characteristics. Surface morphology of studied biomass-derived ACs is also presented. Finally, the porous properties and thermal conductivity data are compared with the hitherto commercial adsorbent Maxsorb III.
Ethanol and CO2 adsorption characteristics of biomass-derived ACs and AC composites have been carried out using a gravimetric method at adsorption temperatures ranging from 20 to 70ºC and pressures ranges corresponding to the working conditions of adsorption cooling cycle. The experimental data are modeled for CO2 and ethanol vapor adsorption isotherm and kinetics for the comparison. The adsorption models’ parameters are optimized and accordingly their sensitivity is discussed. A comparative study between the synthesized AC based adsorbents and other ACs are also presented. It is found that the biomass-derived ACs are excellent potential adsorbent than that of any other ACs so far.
A theoretical analysis of an equilibrium adsorption cooling cycle employing the biomass- derived ACs and composite adsorbents/refrigerant (ethanol and CO2) pairs is presented using a time-independent model. The comparisons of specific cooling effect and coefficient of performances under various desorption and evaporation temperatures have been presented. The calculated SCE for ethanol and CO2 is compared with Maxsorb III.
The pore volume of biomass-derived ACs surpasses all other ACs hitherto, which makes the benchmark. It possesses the highest pore volume is 2.87 cm3 g-1 whereas Maxsorb III has only 1.70 cm3 g-1. WPT-AC can adsorb up to 1.9 kg ethanol vapor per kg of adsorbent and shows 35% higher than net uptake of Maxsorb III/ethanol. Furthermore, WPT-AC (WC500)/CO2 pair shows the adsorption uptake 2.6 cm3 g-1, which is also 73%
improvement compared to Maxsorb III/CO2. It is the current benchmark. Expanded graphite (EG) contained AC composite possesses 11 times whilst GNPs contained AC composite shows 23.5 higher thermal conductivity than parent AC. Polymerized ionic liquid (PIL) binder based composite has 11% and 18% higher surface area and pore volume than that of any other conventional synthetic binders based composites. WPT-AC/ethanol adsorption cycle shows 36% higher SCE whilst M-AC/ethanol pair gives about 32% higher SCE compared to Maxsorb III/ethanol. In addition, biomass-derived ACs/CO2 pair provides about 55 to 92% higher SCE compared to Maxsorb III/CO2.
Page | iii
Acknowledgements
This thesis is an outcome of an exciting journey at Kyushu University, which was made possible by the support, care, advice, supervision, and encouragement from several individuals. It is an extremely pleasant opportunity for me to elicit my heartfelt thanks and gratefulness to all of them.
To begin with, I express my deepest sense of gratitude and indebtedness to my supervisor Professor Bidyut Baran Saha for his precious guidance and inspiration throughout my doctoral work. Success of this thesis work is due to his astute guidance and timely counsel on prioritizing the tasks. He provided me with a pleasant environment at laboratory and much required liberty to conduct my research work. His friendly demeanour and kind nature made my stay in Japan a thoroughly enjoyable experience. Interactions with him have facilitated broaden my perception in manifold aspects of life. I anticipate continuing these interactions and getting opportunities to work with him in the future as well.
I am indebted to my co-supervisor Associate Professor Kyaw Thu for his guidance and advice at various stages of my doctoral study. An expert in the field of adsorption, his proficient inputs on research work and writing manuscript helped me lot. Thank you for your kind support.
I would like to express my gratefulness to Professor Takahiko Miyazaki and Professor Shigeru Koyama for their valuable assistance, guidance and encouragement in my research.
I am also indebted to Prof. Bidyut Baran Saha, Associate Prof. Kyaw Thu, Prof.
Takahiko Miyazaki, and Prof. Yukihiro Higashi for evaluating this work and for their valuable comments and questions.
I am grateful to Dr. Kutub Uddin and Dr. Sourav Mitra for their valuable assistance and providing me the opportunity to discuss technical results of this work any time. I express my gratitude to Dr. Ibrahim I. El-Sharkawy and Dr. Skander Jribi for their valuable support at the beginning of my journey. I would like to acknowledge Professor Seong-Ho Yoon for providing me a great chance to discuss and do some experiments in his lab. His wise guidance and support helped me a lot during my doctoral study. I express my gratitude to Dr. Hyun-Sig Kil for assisting me to do experiments and analyzing data.
Page | iv I express my heartiest gratitude and thanks to TherMAT project team members of Calsonic Kansei Corp. (CK) for the opportunity to acquire the hand-on-experience and their support.
I am grateful to Assoc. Prof. Muhammad Moniruzzaman of Universiti Teknologi PETRONAS for his help during the internship and research guidance. I also thank to Prof.
Mahfuza Sharifa Sultana, Asst. Prof. Harish Sivasankaran and Prof. Yukihiro Higashi for giving suggestions during my study. Special thanks to Mr. Shoji Hirano and Ms. Yoko Hara for helping me in various ways during my stay in Japan.
I wish to express my heartfelt indebtedness Advanced Graduate Program in Global Strategy for Green Asia (GA), IGSES, Kyushu University for providing scholarship and all other facilities required in this study. I would like to acknowledge I2CNER in Kyushu University for the access of their experimental facilities. I am also grateful to all staff of Green Asia and IGSES staff for supporting me in various way during my stay in Kyushu University. I consider myself fortunate to have enjoyed the opportunity of working in Kyushu University under supervision of honorable Professor Bidyut Baran Saha.
I am thankful to all of my present and former laboratory members and staff for their help and kind cooperation. In particular, I must thank to Mr. Amirul Islam, Mr. Mahbubul Muttakin, Mr. M L Palash, Mr. Mohamed Younes, Mr. Sampad Ghosh, Mr. Kaiser Ahmed Rocky, Mr. Matiar Rahman, Mr. Tahmid Hasan Rupam, Ms. Yang Jiahui, Ms.
Mahua Jahan Alam, Mr. Hayato Imamura, Mr. Nobuo Takata, and Ms. Yuri Yamato for making me feel comfortable in the lab and for supporting me in various ways.
I would also like to special thanks to Mrs. Tandra Bhuiyan Saha, wife of my supervisor, for giving advice, suggestions and taking care during my stay in Japan. Because of her wise suggestions, my Japan life was very smooth, funny and enjoyable. Thank you very much for the quality times.
I express my humble obligation to my affectionate and loving Father, Mother, Brothers, Sisters and In-Laws for their love, inspiration and prayers for me. In particular, I am thankful and would like to express my gratitude to my father Krishna Chandra Pal, mother Anjana Rani Pal, elder brother Tapos Pal, and elder sister Maloti Rani Pal for everything they have done for me.
Finally, I wish to thank my beloved wife Aporupa Dash for the understanding, quiet patience and encouragement during my study.
Animesh Pal Kyushu University, Japan
Page | v
List of Publications
Awards:
1. Young researcher award on energy research: Part of my research proposal was awarded for "Bronze Award" with a research grant of 0.3 Million Yen. The award was given by the president of Kyushu University under the "Kyushu University Platform of Inter-/Transdisciplinary Energy Research", Japan, January 31, 2017.
2. “Best paper award” for conference paper entitled “Adsorption uptake of ethanol onto WPT and Mangrove-derived ACs” presented at IMPRES 2016, Oct. 23-26, 2016, Sicily, Italy.
Journal papers:
1. A. Pal, A. Kondor, S. Mitra, K. Thu, B.B. Saha, On surface energy and acid-base properties of highly porous parent and surface treated activated carbons using inverse gas chromatography, J. Ind. Eng. Chem., Accepted (July 2018).
2. A. Pal, K. Uddin, K. Thu, B.B. Saha, Environmental assessment and characteristics of next generation refrigerants, Evergreen, Joint Journal of Novel Carbon Resource Sciences & Green Asia Strategy 5 (02) (2018) 58-66.
3. A. Pal, M.S.R. Shahrom, M. Moniruzzaman, C.D. Wilfred, S. Mitra, K. Thu, B.B.
Saha, Ionic liquid as a new binder for activated carbon based consolidated composite adsorbents, Chem. Eng. J. 326 (2017) 980-986.
4. A. Pal, H.-S. Kil, S. Mitra, K. Thu, B.B. Saha, S.-H. Yoon, J. Miyawaki, T.
Miyazaki, S. Koyama, Ethanol adsorption uptake and kinetics onto waste palm trunk and mangrove based activated carbons, Appl. Therm. Eng. 122 (2017) 389–
397.
5. A. Pal, K. Thu, S. Mitra, I.I. El-Sharkawy, B.B. Saha, H.-S. Kil, S.-H. Yoon, J.
Miyawaki, Study on biomass derived activated carbons for adsorptive heat pump application, Int. J. Heat and Mass Trans. 110 (2017) 7-19.
6. S. Jribi, T. Miyazaki, B.B. Saha, A. Pal, M.M. Younes, S. Koyama, A. Maalej, Equilibrium and kinetics of CO2 adsorption onto activated carbon, Int. J. Heat and Mass Trans. 108 (2017) 1941–1946.
Page | vi 7. A. Pal, I.I. El-Sharkawy, B.B. Saha, S. Jribi, T. Miyazaki, S. Koyama, Experimental
investigation of CO2 adsorption onto a carbon based consolidated composite adsorbent for adsorption cooling application, Appl. Therm. Eng. 109 (2016) 304–
311.
8. A. Pal, I.I. El-Sharkawy, B.B. Saha, K. Habib, T. Miyazaki, S. Koyama, Thermodynamic analysis of adsorption cooling cycle using consolidated composite adsorbents - ethanol pairs, J. Eng. Appl. Sci. 11 (2016) 12234–12238.
9. I.I. El-Sharkawy, A. Pal, T. Miyazaki, B.B. Saha, S. Koyama, A study on consolidated composite adsorbents for cooling application, Appl. Therm. Eng. 98 (2016) 1214–1220.
Conference proceedings/symposium presentations:
1. A. Pal*, K. Thu, B.B. Saha, Effect of adsorbent layer height on instantaneous adsorption capacity, Proceedings of International Forum for Green Asia 2017, pp.
26-29, Fukuoka, Japan, Nov. 29, 2017
2. A. Pal*, S. Mitra, K. Thu, B.B. Saha, Improved adsorption uptake of ethanol and CO2 onto biomass based activated carbons, Proceedings of 3rd International Exchange and Innovation Conference on Engineering & Sciences (IEICES2017), pp. 127-128, Fukuoka, Japan, Oct. 19-20, 2017. Presentation style: Oral.
3. A. Pal*, S. Mitra, K. Thu, B.B. Saha, Enhanced CO2 adsorption onto biomass based activated carbon, Proceedings of International Sorption Heat Pump Conference 2017 (ISHPC2017), Paper No. AD-YR1-1147, Tokyo, Japan, Aug. 7-10, 2017.
Presentation style: Oral.
4. M. M. Younes, I.I. El-Sharkawy, A.E. Kabeel, A. Pal*, K. Thu, B.B. Saha, Thermo- Physical Properties of Silica Gel Composites for Adsorption Cooling and Desalination Applications, Proceedings of International Sorption Heat Pump Conference 2017 (ISHPC2017), Paper No. AD-MA-1141, Tokyo, Japan, Aug. 7- 10, 2017. Presentation style: Oral.
5. A. Pal*, S. Mitra, K. Thu, B.B. Saha, Study on high performance adsorbents for adsorption cooling applications, Kyushu University Educational Reform Symposium 2017, Kyushu University, Japan, July 10, 2017. Presentation style:
Poster.
Page | vii 6. S. Mitra*, A. Pal, K. Thu, B.B. Saha, Transient numerical study of novel composite
adsorbent for cooling applications, Thermal and Fluid Engineering Conference (TFEC2017), pp. 37-46, Las Vegas, USA, Apr. 2-5, 2017. Presentation style: Oral.
7. A. Pal*, S. Mitra, K. Thu, B.B. Saha, Development of high performance adsorbents for renewable energy powered adsorption heat pump (AHP), Q-pit Energy week, I2CNER Kyushu University (Ito Campus), Japan, Jan. 31, 2017. Presentation style:
Poster.
8. S. Mitra*, A. Pal, B.B. Saha, “Thermally driven adsorption system for sustainable energy technology”, JSPS-DST Asian Academic Seminar, Dec. 14–20, 2016 Tokyo, Japan. Presentation style: Poster.
9. M.T. Kibria*, A. Pal, T. Nakagawa, S. Mizuno, B.B. Saha, Effect of binders onto adsorption characterization of activated carbon based composites, Proceedings of 18th CSS-EEST, Shanghai, China, Dec. 4-6, 2016. Presentation style: Poster 10. A. Pal*, S. Mitra, K. Thu, B.B. Saha, H.–S. Kil, S.-H. Yoon, J. Miyawaki,
Mangrove based activated carbon: Synthesis and characterization, Proceedings of International Forum for Green Asia 2016, pp. 47-48, Kyushu University, Japan, Dec. 1st, 2016. Presentation style: Poster.
11. A. Pal*, B.B. Saha, H.–S. Kil, J. Miyawaki, S.-H. Yoon, S. Mitra, K. Thu, T.
Miyazaki, S. Koyama, Adsorption uptake of ethanol onto WPT and Mangrove- derived ACs, Proceedings of IVth International Symposium on Innovative Materials for Processes in Energy System (IMPRES2016), pp. 39-40, Italy, Oct. 23- 26, 2016. Presentation style: Oral.
12. H.-S. Kil, A. Pal, B.B. Saha, I. Mochida, K. Nakabayashi, S.-H. Yoon, J.
Miyawaki*, Preparation and ethanol adsorption properties of activated carbons from biomass for adsorption heat pumps, Proceedings of IVth International Symposium on Innovative Materials for Processes in Energy System (IMPRES2016), pp. 289-290, Italy, Oct. 23-26, 2016. Presentation style: Oral.
13. A. Pal*, I.I. El-Sharkawy, B.B. Saha, K. Habib, T. Miyazaki, S. Koyama, Thermodynamic analysis of adsorption cooling cycle using consolidated composite adsorbents-ethanol pairs, International conference on production, energy &
reliability (ICPER2016), Malaysia, Aug. 15-17, 2016. Presentation style: Oral.
14. A. Pal*, I.I. El-Sharkawy, B.B. Saha, T. Miyazaki, S. Koyama, Preparation and characterization of consolidated composite adsorbents for cooling application,
Page | viii Proceedings of 53rd National Heat Transfer Symposium, Japan, May 24-26 2016.
Presentation style: Oral.
15. A. Pal*, I.I. El-Sharkawy, B.B. Saha, T. Miyazaki, S. Koyama, Adsorption characteristics of consolidated adsorbents + ethanol pairs, Proceedings of 8th Asian Conference on Refrigeration and Air Conditioning (ACRA2016), Paper No.
SO_099, Taiwan, May 15-17, 2016. Presentation style: Oral.
16. A. Pal*, I.I. El-Sharkawy, B.B Saha, T. Miyazaki, S. Koyama, Experimental investigation of consolidated composite adsorbents/ethanol pairs for cooling application, I2CNER Annual Symposium, Kyushu University (Ito Campus), Japan, Feb. 2, 2016. Presentation style: Poster.
17. A. Pal*, H.–S. Kil, B.B. Saha, S.-H. Yoon, T. Miyazaki, S. Koyama, J. Miyawaki, Preparation and characterization of activated carbon from waste Palm trunk by chemical activation with KOH for adsorption cooling application, Proceedings of International Forum for Green Asia 2015, pp. 69-72, Kyushu University, Japan, Nov. 27, 2015. Presentation style: Poster.
18. A. Pal*, Experimental Investigation of Consolidated Adsorbent/Ethanol Pairs for Cooling Application. Global Strategy for Green Asia-Mahidol University joint Seminar, Mahidol University, Thailand, Mar. 12, 2015. Presentation style: Oral.
19. A. Pal*, I.I. El-Sharkawy, T. Miyazaki, B.B. Saha, S. Koyama, Experimental investigation of consolidated adsorbents/ethanol pairs for cooling application, Proceedings of the 16th Cross Straits Symposium on Energy and Environmental Science and Technology (16th CSS-EEST), pp. 267-268, Korea, Nov. 13-15, 2014.
Presentation style: Poster.
20. A. Pal*, I.I. El-Sharkawy, K. Uddin, T. Miyazaki, B.B. Saha, S. Koyama, T.
Maruyama, S. Maeda, T. Nakamura, A study on adsorption of ethanol onto consolidated composite adsorbents for cooling application, Proceedings of the JSRAE Annual Conference, pp. A313-1-3, Japan, Sept. 10-13, 2014. Presentation style: Oral.
*presenting author
Page | ix
Table of Contents
Summary ... i
Acknowledgements ... iii
List of Publications ... v
Table of Contents ... ix
List of Figures ... xiv
List of Tables ... xxii
Nomenclature ... xxiv
Chapter 1 Introduction... 1
1.1 Background ………..1
1.2 Historical development of refrigerants ... 3
1.3 GWP and ODP of commonly used refrigerants ... 4
1.4 Assessment of global warming potential ... 6
1.5 Motivation ……….10
1.6 Aims and objectives of the thesis ... 11
1.7 Organization of the thesis………..12
Chapter 2 Literature review ... 15
2.1 Adsorption cooling system ... 15
2.1.1 Adsorption process ... 15
2.1.2 Working principle of adsorption cooling systems ... 17
2.1.3 Adsorbent ………19
2.1.4 Adsorbate ………22
2.2 Fundamental characterization ... 23
2.2.1 Porous properties ... 23
2.2.2 Uptake and kinetics measurement techniques ... 24
2.2.3 Adsorption isotherms and kinetics ... 25
2.2.4 Thermal properties ... 26
2.2.4.1 Thermal conductivity of ACs... 26
Page | x
2.2.4.2 Isosteric heat of adsorption ... 27
2.2.4.3 Specific heat capacity of ACs ... 29
2.3 Activated carbon based adsorption cooling systems ... 30
2.3.1 Activated carbon/ethanol pair ... 30
2.3.2 Activated carbon/methanol pair ... 31
2.3.3 Activated carbon/carbon dioxide (CO2) pair ... 32
2.3.4 AC based consolidated composites ... 33
2.4 Scope of this thesis……..………35
2.5 Approaches to this thesis……….37
2.5.1 Effective uptake improvement approach ... 38
2.5.2 Thermal conductivity improvement approach ... 39
Chapter 3 Development of adsorbent material ... 41
3.1 Introduction………41
3.2 Synthesis and characterization biomass-derived functional ACs ... 43
3.2.1 Precursor materials ... 44
3.2.2 Experiments………..45
3.2.2.1 Carbonization ... 45
3.2.2.2 Activation ... 49
3.2.3 Characteristics of synthesized AC samples ... 51
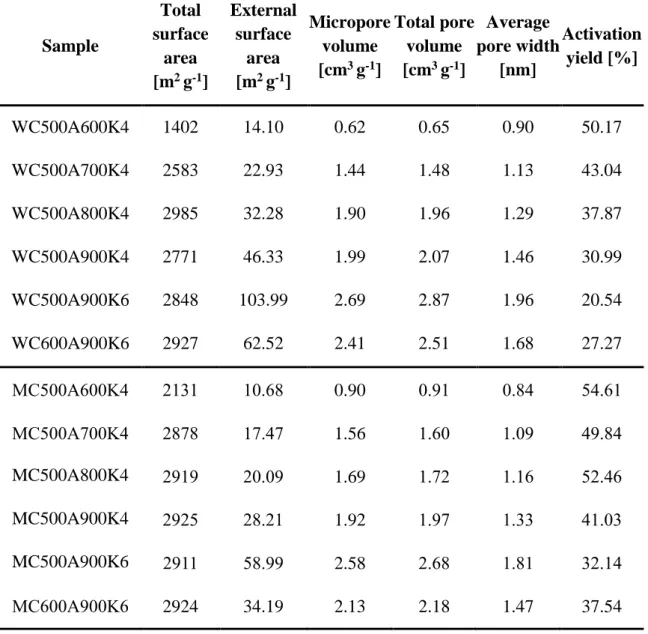
3.2.3.1 Porous properties ... 52
3.2.3.2 Scanning electron microscopy (SEM) observation ... 58
3.2.3.3 Thermal conductivity of biomass-derived ACs ... 60
3.2.3.4 Choice of optimal AC ... 61
3.3 Synthesis and characterization of AC based composite adsorbents ... 62
3.3.1 Materials………...62
3.3.1.1 Activated carbon (Maxsorb III) ... 62
3.3.1.2 Expanded graphite (EG) ... 63
3.3.1.3 Graphene nanoplatelets (GNPs) ... 64
3.3.1.4 Polyvinyl alcohol (PVA)... 65
3.3.2 Composite adsorbents using EG as a thermal conductivity enhancer ... 66
3.3.3 Composite adsorbents using GNPs as a thermal conductivity enhancer ... 68
3.3.4 Experiments………...………69
3.3.4.1 N2 adsorption ... 69
Page | xi 3.3.4.2 Thermal diffusivity and conductivity measurement of composites
………70
3.3.5 Characteristics of synthesized composites ... 73
3.3.5.1 EG contained composites ... 73
3.3.5.2 GNPs contained composites ... 78
3.3.6 Polymerized amino acid based ionic liquid (PAAIL) as a binder ... 86
3.3.6.1 Chemicals ... 86
3.3.6.2 Synthesis of PAAIL ... 86
3.3.6.3 Characteristics of polymerized AAIL (PAAIL) ... 87
3.3.6.4 Poly IL [VBTMA][Ala] as a binder for AC composite ... 90
3.3.6.5 Characteristics of composites ... 92
3.4 Conclusions………...………….96
Chapter 4 Application to low pressure adsorption systems ... 99
4.1 Introduction………99
4.2 Experiment for adsorption characteristics ... 100
4.2.1 Test rig for adsorption uptake measurement ... 100
4.2.2 Gravimetrically adsorption uptake measurement ... 102
4.3 Theory of adsorption isotherm and kinetics models ... 104
4.3.1 Adsorption isotherms ... 104
4.3.2 Adsorption kinetics... 105
4.4 Biomass-derived AC/ethanol pairs ... 106
4.4.1 Adsorption isotherm ... 106
4.4.2 Adsorption kinetics... 109
4.5 Composites/ethanol pairs………119
4.5.1 EG contained composites/ethanol pairs ... 119
4.5.1.1 Adsorption isotherms ... 119
4.5.2 GNPs contained composites/ethanol pairs ... 123
4.5.2.1 Adsorption isotherms ... 123
4.5.2.2 Adsorption kinetics ... 127
4.5.3 PAAIL binder based composite ... 129
4.5.3.1 Adsorption isotherms ... 129
4.6 Conclusions………..133
Page | xii
Chapter 5 Application to high pressure adsorption systems ... 136
5.1 Introduction………..136
5.2 Experiment of adsorption characteristics ... 137
5.2.1 Instrumentation ... 137
5.2.2 Procedure………138
5.3 Theory of adsorption isotherm models ... 139
5.4 Excess and absolute adsorption ... 141
5.5 Biomass-derived ACs/CO2 pairs ... 141
5.5.1 Adsorption isotherm ... 141
5.5.2 Adsorption kinetics... 150
5.6 Composites/CO2 pairs………152
5.6.1 EG contained composites/CO2 pairs ... 152
5.6.2 GNPs contained composites/CO2 pairs ... 156
5.6.2.1 Adsorption isotherms ... 156
5.6.2.2 Adsorption kinetics ... 159
5.7 Conclusions………..161
Chapter 6 Thermodynamic analysis of an adsorption cooling cycle ... 163
6.1 Introduction………..163
6.2 Thermodynamic cycle………..164
6.3 Effect of operating temperature on SCE and COP ... 169
6.3.1 Ethanol as a refrigerant... 169
6.3.1.1 Biomass-derived ACs ... 169
6.3.1.2 Composite adsorbents ... 174
6.3.2 CO2 as a refrigerant ... 178
6.3.2.1 Biomass-derived ACs ... 178
6.3.2.2 Composite adsorbents ... 181
6.4 Comparison of thermodynamic parameters ... 183
6.5 Conclusions………..184
Chapter 7 Overall conclusions and recommendations ... 185
7.1 Overall conclusions………185
7.2 Recommendations………191
References ... 192
Page | xiii Appendix A. Uncertainty analysis ... 210 Appendix B. Surface characterization analyzer (3Flex™) ... 212 Appendix C. Thermal diffusivity analyzer (LFA457)-laser flash method ... 215 Appendix D. C-Therm TCi thermal conductivity analyzer- modified transient plane source method... 219 Appendix E. Experimental uptake of WPT-AC/ethanol ... 221 Appendix F. Experimental uptake of composite C/CO2 ... 223
Page | xiv
List of Figures
Fig. 1.1 Schematic diagram of a conventional heat pump system. ... 3 Fig. 1.2 Refrigerant progression [19]. ... 4 Fig. 1.3 Specific charge amount in complete systems for different applications using
different refrigerants [24]. ... 8 Fig. 1.4 Direct emission amount of CO2 per kW/year from the residential air- conditioner. ... 9 Fig. 1.5 Comparison of direct emission amount of CO2 per kW/year from the various
system... 9 Fig. 2.1 a) Schematic of adsorption process b) Adsorption isotherms ... 16 Fig. 2.2 Schematic diagram of basic adsorption cooling system. ... 17 Fig. 2.3 Thermodynamic cycle (P-T-W diagram) of a basic adsorption cooling system.
... 19 Fig. 2.4 Equilibrium ethanol and CO2 adsorption uptake onto various activated carbon
based adsorbent as a function of pore volume [14–16,18,36,37,39,52]. ... 24 Fig. 2.5 Manufacture processes of consolidated composite AC.. ... 34 Fig. 2.6 Consolidated composite adsorbents, (a) density of 249 kgm-3 with cracks, (b)
density of 388 kgm-3 without cracks, (c) density of 448 kgm-3 with cracks [69].
... 35 Fig. 2.7 Parameters affect the system performance and compactness. ... 38 Fig. 2.8 Schematic representation of effective uptake definition and way to obtain large
pore volume with high surface area ACs. ... 39 Fig. 2.9 Schematic drawing of creating thermal network using additives. ... 40 Fig. 3.1 Pictorial view of two raw biomasses employed for synthesis of functional ACs.
... 45 Fig. 3.2 Crushing and drying (a) WPT and (b) Mangrove. ... 46 Fig. 3.3 Processing steps for preparation of biomass-derived activated carbons [113].
... 47 Fig. 3.4 Schematic diagram of experimental setup for carbonization and KOH
activation reactor. ... 48 Fig. 3.5 Photograph of carbonized (a) WPT and (b) Mangrove ... 48
Page | xv
Fig. 3.6 N2 adsorption/desorption isotherms of WPT-derived ACs at 77 K. ... 53
Fig. 3.7 N2 adsorption/desorption isotherms of M-derived ACs at 77 K. ... 53
Fig. 3.8 Pore size distribution of WPT-derived ACs. ... 54
Fig. 3.9 Pore size distribution of M-derived ACs. ... 55
Fig. 3.10 Influence of activation temperature on surface area. ... 57
Fig. 3.11 Influence of activation temperature on pore volume. ... 57
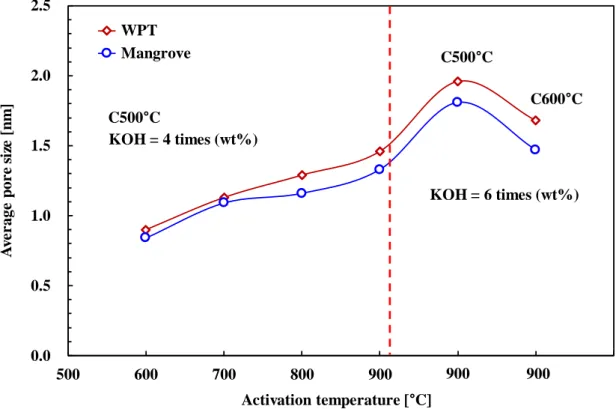
Fig. 3.12 Influence of activation temperature on average pore width. ... 58
Fig. 3.13 SEM images of WPT-derived ACs (a) WC500A600K4; (b) WC500A700K4; (c) WC500A800K4; (d) WC500A700K6; (e) WC500A900K6, and (f) WC600A700K6 ... 59
Fig. 3.14 SEM images of mangrove-derived ACs (a) MC500A600K4; (b) MC500A700K4; (c) MC500A800K4; (d) MC500A700K6; (e) MC500A900K6, and (f) MC600A700K6. ... 59
Fig. 3.15 Thermal conductivity results of all WPT-derived ACs. ... 60
Fig. 3.16 Thermal conductivity results of all M-derived ACs. ... 61
Fig. 3.17 SEM photograph of activated carbon powder (Maxsorb III) [15] ... 62
Fig. 3.18 SEM photograph of EG (EC500). ... 64
Fig. 3.19 SEM photograph of GNPs; (a) H25 and (b) C750 [127]. ... 65
Fig. 3.20 Photograph of Polyvinyl alcohol (PVA). ... 66
Fig. 3.21 (a) Production process of synthesized composite adsorbents, (b) a pictorial view of synthesized composite adsorbents. ... 67
Fig. 3.22 Synthesis procedure and pictorial view of synthesized GNPs contained composites. ... 68
Fig. 3.23 Schematic diagram of 3Flex™ Surface Characterization Analyzer. ... 69
Fig. 3.24 Schematic design of LFA 457 MicroFlash system. ... 71
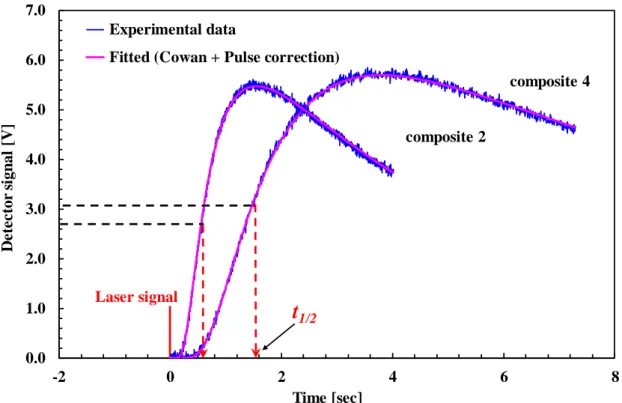
Fig. 3.25 An illustration of detector signal with a fitted model for GNPs contained composite 2 and composite 4. ... 72
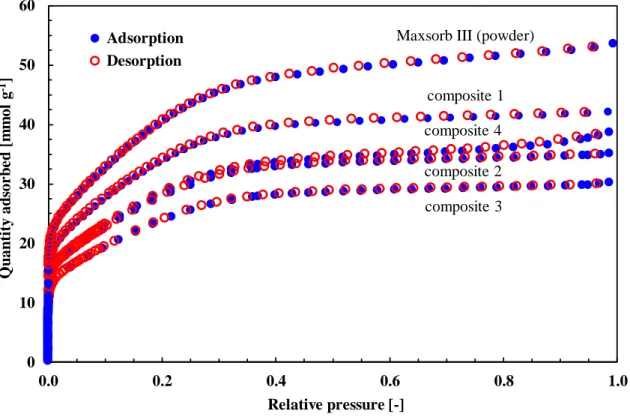
Fig. 3.26 Nitrogen adsorption/desorption isotherm onto various composites. ... 74
Fig. 3.27 The pore size distribution of various consolidated composite samples. ... 75
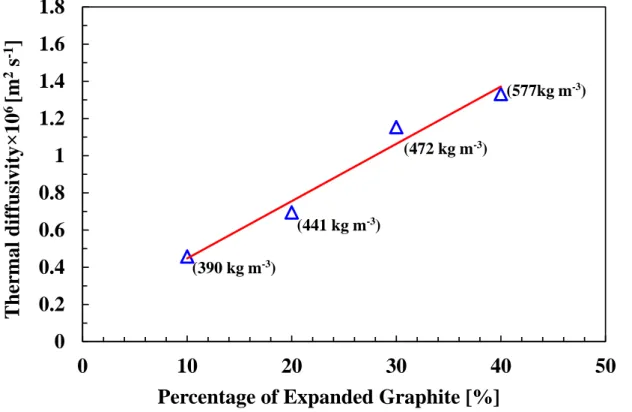
Fig. 3.28 Plots of thermal diffusivity versus the percentage of expanded graphite. ... 76
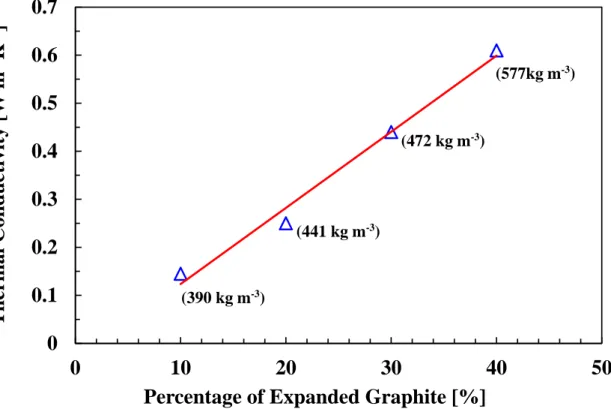
Fig. 3.29 Plots of thermal conductivity versus the percentage of expanded graphite. .. 77
Fig. 3.30 Plots of thermal conductivity of composite A (50% Maxsorb III, 40% EG, 10% binder) versus the packing density. ... 77
Page | xvi Fig. 3.31 N2 gas adsorption/desorption isotherm of parent and studied composite
adsorbents at 77 K. ... 79
Fig. 3.32 The pore size distribution of parent Maxsorb III and composite. ... 79
Fig. 3.33 Thermal diffusivity versus temperature for composite 2, 3 and 4. ... 81
Fig. 3.34 Thermal conductivity versus temperature for Composite_1, 2 and 3. ... 82
Fig. 3.35 Thermal diffusivities versus percentage of graphene (H25) content into the composite. ... 83
Fig. 3.36 Thermal conductivity versus percentage of graphene (H25) content into the composite. ... 83
Fig. 3.37 Thermal diffusivities versus packing density of composite 3. ... 84
Fig. 3.38 Thermal conductivity versus packing density of composite 3. ... 85
Fig. 3.39 Thermal conductivity improvement compared to Maxsorb III. ... 85
Fig. 3.40 Synthesis route of polymerized AAIL (PAAIL). ... 87
Fig. 3.41 Molecular structures of the monomer and polymer forms of amino acid based ionic liquid. ... 88
Fig. 3.42 1H-NMR spectrum of monomer form of [VBTMA][Ala]. The numbers below each signal are the integral values and are used to quantify the proton in [VBTMA][Ala]. ... 89
Fig. 3.43 1H-NMR spectrum of polymer form of [VBTMA][Ala]. The numbers below each signal are the integral values and are used to quantify the proton in Poly IL [VBTMA][Ala]. ... 90
Fig. 3.44 Schematic diagram of the composite synthesis process. ... 91
Fig. 3.45 Comparison of volumetric adsorption uptake of CO2 onto Maxsorb III and composite with PIL as a binder at adsorption temperature 303.15 K. ... 92
Fig. 3.46 Comparison of N2 gas adsorption/desorption between Maxsorb III (90 wt%) + Poly IL [VBTMA][Ala] (10 wt%) and Maxsorb III (90 wt%) + PVA (10 wt%) at 77 K. ... 93
Fig. 3.47 Pore size distribution of Maxsorb III (90 wt%) + Poly IL [VBTMA][Ala] (10 wt%) and Maxsorb III (90 wt%) + PVA (10 wt%). ... 94
Fig. 3.48 Comparison of thermal conductivity of among Maxsorb III, Maxsorb III (90 wt%) + Poly IL [VBTMA][Ala] (10 wt%), and Maxsorb III (90 wt%) + PVA (10 wt%). ... 95
Fig. 4.1 Schematic diagram of the experimental apparatus for measuring adsorption uptake of ethanol onto composite adsorbents. ... 102
Page | xvii Fig. 4.2 Schematic diagram of the experimental apparatus for measuring ethanol
adsorption characteristics. ... 104 Fig. 4.3 Adsorption isotherms of ethanol onto WPT-AC (WC600A900K6) (data are
fitted with Freundlich, Langmuir model, D-A equation, Tóth model). ... 107 Fig. 4.4 Adsorption isotherms of ethanol onto M-AC (MC600A900K6) (data are fitted
with Freundlich, Langmuir model, D-A equation, Tóth model). ... 108 Fig. 4.5 Temporal histories of adsorption uptake and pressure of WPT-AC/ethanol pair
at adsorption temperature 40°C. ... 110 Fig. 4.6 Temporal histories of adsorption uptake and pressure of WPT-AC/ethanol pair
at adsorption temperature 70°C. ... 111 Fig. 4.7 Temporal histories of adsorption uptake and pressure of M-AC/ethanol pair at
adsorption temperature 40°C. ... 111 Fig. 4.8 Temporal histories of adsorption uptake and pressure of M-AC/ethanol pair at
adsorption temperature 70°C. ... 112 Fig. 4.9 Plot of ln (1 − F) versus time for WPT-AC/ethanol pair at 30°C adsorption
temperature and evaporator pressure of 2.18 kPa. ... 113 Fig. 4.10 Plot of ln (1 − F) versus time for M-AC/ethanol pair at 30°C adsorption
temperature and evaporator pressure of 5.12 kPa. ... 114 Fig. 4.11 Fractional uptake versus time for WPT-AC/ethanol pair at adsorption
temperature 30, 50 and 70°C (symbols represent experiments and dash dot lines represent LDF model). ... 114 Fig. 4.12 Fractional uptake versus time for M-AC/ethanol pair at adsorption temperature
30, 50 and 70°C (symbols represent experiments and dash dot lines represent LDF model). ... 115 Fig. 4.13 Arrhenius plot of the WPT-AC/ethanol and M-AC/ethanol pairs. ... 117 Fig. 4.14 Comparison between adsorption uptake difference of adsorption cooling
cycles using WPT-AC/ethanol (solid line) and M-AC/ethanol (dashed line) pairs at evaporator, adsorption and desorption temperatures of 7, 30 and 80ºC, respectively. ... 118 Fig. 4.15 Comparison between adsorption uptake difference of adsorption cooling
cycles using M-AC/ethanol (dashed line) and Maxsorb III/ethanol (solid line) [16] pairs at evaporator, adsorption and desorption temperatures of 7, 30 and 80ºC, respectively. ... 118
Page | xviii Fig. 4.16 Adsorption isobars of ethanol onto composite A (50% Maxsorb III, 40% EG,
10% binder) with packing density of 517 kg m-3 (error bars of uptake is ±5%).
... 120 Fig. 4.17 Adsorption isobars of ethanol onto composite C (70% Maxsorb III, 20% EG,
10% binder) with packing density of 446 kg m-3 (error bars of uptake is ±5%).
... 121 Fig. 4.18 Predicted volumetric adsorption isotherms of composite adsorbent A (50%
Maxsorb III, 40% EG, 10% binder)/ethanol pair with packing density of 517 kg m-3. ... 121 Fig. 4.19 Predicted volumetric adsorption isotherms of composite adsorbent C (70%
Maxsorb III, 20% EG, 10% binder)/ethanol pair with packing density of 446 kg m-3. ... 122 Fig. 4.20 Comparison between volumetric adsorption uptake difference of adsorption
cooling cycles using Maxsorb III/ethanol and composite C/ethanol pairs at the evaporator, adsorption and desorption temperatures of 7, 30 and 80ºC, respectively. ... 122 Fig. 4.21 Experimental data of composite 1 (ρ = 316 kg m-3) fitted with studied isotherm
models. ... 123 Fig. 4.22 Experimental data of composite 2 (ρ = 399 kg m-3) fitted with studied isotherm
models. ... 124 Fig. 4.23 Experimental data of composite 3 (ρ = 498 kg m-3) fitted with studied isotherm
models. ... 124 Fig. 4.24 Experimental data of composite 4 (ρ = 388 kg m-3) fitted with studied isotherm
models. ... 125 Fig. 4.25 Improvement of effective volumetric (kg m-3) adsorption uptake compares to
parent adsorbent (Maxsorb III) at evaporator, adsorption and desorption temperatures of 15, 30 and 85 °C, respectively. ... 127 Fig. 4.26 Dynamic adsorption uptake of all studied adsorbents (a) normalized; (b)
absolute at adsorption temperature 30°C and evaporator pressure 1.8 kPa. 129 Fig. 4.27 Equilibrium adsorption uptake of ethanol onto composite A: Maxsorb III (90
wt%) + Poly IL [VBTMA][Ala] (10 wt%) (fitted with D-A equation). ... 130
Page | xix Fig. 4.28 Temporal histories of adsorption uptake and pressure of Maxsorb III (90 wt%)
+ Poly IL [VBTMA][Ala] (10 wt%)/ethanol pair at adsorption temperature 323.15 K. ... 131 Fig. 4.29 Volumetric adsorption uptake of Maxsorb III (90 wt%) + Poly IL
[VBTMA][Ala] (10 wt%)/ethanol pair at adsorption temperature ranging from 303.15 K to 353.15 K. ... 132 Fig. 4.30 Comparison of adsorption uptake difference of adsorption cooling cycle
between composite A: Maxsorb III (90 wt%) + Poly IL [VBTMA][Ala] (10 wt%)/ethanol (solid line) and Maxsorb/ethanol (dashed line) pairs at evaporator, adsorption and desorption temperatures of 280.15, 303.15 and 353.15 K, respectively. ... 133 Fig. 5.1 Schematic diagram of the experimental apparatus for measuring CO2
adsorption characteristics. ... 139 Fig. 5.2 Adsorption isotherms of WC500 (WC500A900K6/CO2 pair (data are fitted
with (a) Tóth and (b) modified D-A model). ... 143 Fig. 5.3 Adsorption isotherms of WC600 (WC600A900K6)/CO2 (data are fitted with
(a) Tóth and (b) modified D-A model). ... 144 Fig. 5.4 Adsorption isotherms of MC500 (MC500A900K6/CO2 pair (data are fitted
with (a) Tóth and (b) modified D-A model). ... 145 Fig. 5.5 Adsorption isotherms of MC600 (MC600A900K6)/CO2 (data are fitted with
(a) Tóth and (b) modified D-A model). ... 146 Fig. 5.6 Effective uptake (△W) as a function of adsorbent pore volume. ... 149 Fig. 5.7 △W improvement of biomass-derived ACs with the comparison of Maxsorb
III and Norit RB3 at evaporation, adsorption, and desorption temperature are 15, 28 and 85°C. ... 150 Fig. 5.8 Normalized adsorption uptake as a function of time for all biomass-derived
ACs/CO2 pairs along with Maxsorb III/CO2 pair at adsorption temperature 30°C and evaporator pressure about 560 kPa. ... 151 Fig. 5.9 Instantaneous absolute uptake of all biomass-derived ACs/CO2 pairs along
with Maxsorb III/CO2 pair at same condition presented in Fig. 5.8. ... 151 Fig. 5.10 Adsorption isotherms of CO2 onto composite C (data are fitted with Langmuir
model). ... 153
Page | xx Fig. 5.11 Adsorption isotherms of CO2 onto composite C (data are fitted with modified
Dubinin-Astakhov (D-A) equation). ... 153 Fig. 5.12 Adsorption isotherms of CO2 onto composite C (data are fitted with Tóth
model). ... 154 Fig. 5.13 Characteristic curve for the composite C/CO2 pair using modified Dubinin- Astakhov (D-A) equation. ... 155 Fig. 5.14 Comparison of volumetric adsorption uptake of CO2 among studied
consolidated composite, Saha et al. [52] and Himeno et al. [36]. ... 155 Fig. 5.15 Adsorption isotherms of the composite 1/CO2 pair (data are fitted with Tóth
and modified D-A model). ... 157 Fig. 5.16 Adsorption isotherms of the composite 2/CO2 pair (data are fitted with Tóth
and modified D-A model). ... 157 Fig. 5.17 Adsorption isotherms of the composite 4/CO2 pair (data are fitted with Tóth
and modified D-A model). ... 158 Fig. 5.18 Normalized adsorption uptake as a function of time for all composites/CO2
pairs along with Maxsorb III/CO2 pair at adsorption temperature 30°C and evaporator pressure about 560 kPa. ... 160 Fig. 5.19 Instantaneous absolute uptake of all composites/CO2 pairs along with
Maxsorb III/CO2 pair at same condition presented in Fig. 5.18. ... 160 Fig. 6.1 Schematic diagram of basic adsorption cooling system. ... 165 Fig. 6.2 Thermodynamic process of the basic adsorption cooling cycle. ... 166 Fig. 6.3 A representative illustration of P-T-W diagram with adsorption cycle of (a)
composite A (50% Maxsorb III + 40% EG + 10% PVA)/ethanol pair, and (b) composite C (50% Maxsorb III + 40% EG + 10% PVA)/ethanol pair. ... 167 Fig. 6.4 Specific cooling effect (SCE) of WPT-AC (WC600A900K6)/ethanol pair with
a function of desorption temperature. ... 170 Fig. 6.5 Specific cooling effect (SCE) of M-AC (MC600A900K6)/ethanol pair with a
function of desorption temperature. ... 171 Fig. 6.6 Comparison of specific cooling effect (SCE) among biomass-derived
ACs/ethanol and Maxsorb III/ethanol pairs at evaporator temperature 15°C with a function of desorption temperature. ... 171 Fig. 6.7 COP of WPT-AC (WC600A900K6)/ethanol with a function of desorption
temperature... 173
Page | xxi Fig. 6.8 COP of M-AC (MC600A900K6)/ethanol with a function of desorption
temperature... 173 Fig. 6.9 Comparison of COP among biomass-derived ACs/ethanol and Maxsorb
III/ethanol pairs at evaporator temperature 15°C with a function of desorption temperature... 174 Fig. 6.10 A representative illustration of SCE of Maxsorb III (90 wt%) + Poly IL
VBTMA (Ala) (10 wt%)/ethanol pair with a function of desorption temperature... 175 Fig. 6.11 Comparison of specific cooling effect (SCE) among all studied
composites/ethanol pairs at evaporator temperature 15°C with a function of desorption temperature. ... 176 Fig. 6.12 A representative illustration of COP of Maxsorb III (90 wt%) + Poly IL
VBTMA (Ala) (10 wt%)/ethanol pair with the function of desorption temperature... 177 Fig. 6.13 Comparison of COP among all studied composites/ethanol pairs at evaporator
temperature 15°C and adsorption temperature 30°C with the function of desorption temperature. ... 177 Fig. 6.14 Specific cooling effect (SCE) of WPT-AC (WC500A900K6)/CO2 pair with a
function of desorption temperature. ... 178 Fig. 6.15 Specific cooling effect (SCE) of M-AC (MC500A900K6)/CO2 with a function
of desorption temperature. ... 179 Fig. 6.16 Comparison of specific cooling effect (SCE) among biomass-derived
ACs/CO2 and Maxsorb III/CO2 pair at evaporator temperature 15°C with function of desorption temperature. ... 180 Fig. 6.17 Comparison of COP among biomass-derived ACs and Maxsorb III at
evaporator temperature 15°C with function of desorption temperature. ... 181 Fig. 6.18 A representative illustration of SCE of composite 1(90 wt% Maxsorb III + 10
wt% PVA)/CO2 pair with the function of desorption temperature. ... 182 Fig. 6.19 Comparison of volumetric cooling effect (CEv) among all studied
composites/CO2 and Maxsorb III/CO2 pairs at evaporator temperature 15°C with function of desorption temperature. ... 182
Page | xxii
List of Tables
Table 1.1 Features of widely used refrigerants according to IPCC 5th assessment report 2014 [19]. ... 5 Table 1.2 Direct GHG emissions rate by refrigeration and air-conditioning sector [23]. 6 Table 2.1 Porous properties of ACs used for adsorption heat pump application. ... 20 Table 2.2 Comparison of surface area and total pore volume of the activated carbon
derived from various wood based biomass [40]. ... 22 Table 2.3 Thermal conductivity of some commonly used AC reported in literature. ... 27 Table 2.4 Average value of heat of adsorption (Qst) of AC/ethanol and AC/CO2 pairs.
... 29 Table 2.5 Specific heat capacity of ACs [74]. ... 30 Table 3.1 Elemental compositions of waste palm trunk (WPT) and mangrove (M). .... 45 Table 3.2. Elemental compositions of carbonized WPT and mangrove at 500ºC. ... 49 Table 3.3 Series of AC samples are prepared from WPT and M by changing
carbonization and activation conditions. ... 51 Table 3.4 Pore structural parameters of WPT and mangrove-derived ACs that prepared
at various activation conditions. ... 56 Table 3.5 Composition and porous properties of AC powder (Maxsorb III) [31,44,126]
... 63 Table 3.6 Thermo-physical properties of EC500. ... 63 Table 3.7 Technical specifications of graphene H-grade (H25) and C-grade (C750)
[127]. ... 64 Table 3.8 Thermo-physical properties of PVA. ... 65 Table 3.9 List of prepared consolidated composites. ... 67 Table 3.10 List of prepared consolidated composites. ... 68 Table 3.11 Composition and porous properties of the developed consolidated adsorbent
samples. ... 74 Table 3.12 BET surface area and pore volume of Maxsorb III and studied composites. 80 Table 3.13 Porous properties and thermal conductivity of the studied composite. ... 94 Table 4.1 Thermo-physical properties of ethanol. ... 100
Page | xxiii Table 4.2 Fitting parameters of the studied isotherm models for ethanol adsorption onto
WPT-AC and M-AC adsorbents. ... 109 Table 4.3 Adsorption kinetics parameters of WPT-AC/ethanol and M-AC/ethanol pairs.
... 116 Table 4.4 Parameters of Arrhenius equation for studied pairs. ... 117 Table 4.5 Isotherm parameters of ethanol adsorption onto of the studied composites.
... 120 Table 4.6 Fitting parameters of the studied isotherm models for studied
composites/ethanol pairs. ... 126 Table 5.1 Thermos-physical properties of carbon dioxide (CO2). ... 137 Table 5.2 Fitting parameters of the studied isotherm models for biomass-derived
ACs/CO2 pairs. ... 146 Table 5.3 Comparison of effective uptake of the present study with numerous pairs of
literature data at evaporation, adsorption, and desorption temperature are 15, 28 and 85°C, respectively. ... 148 Table 5.4 Fitting parameters of the isotherm models for CO2 adsorption onto the
composite adsorbent. ... 154 Table 5.5 Fitting parameters of the studied isotherm models for biomass-derived
ACs/CO2 pairs. ... 159 Table 6.1 Adsorption uptake and cycle performance of the studied adsorbents using
ethanol and CO2 for cooling applications. ... 183
Page | xxiv
Nomenclature
b
0 equilibrium constant [kPa-1 or MPa-1]Cp specific heat capacity at constant pressure [J g-1 K-1]
d small penetration depth [mm]
D
s surface diffusion coefficient [m2 s-1] E adsorption characteristic energy [kJ mol-1]F
0 geometric parameter for adsorbent particle shape [-]h heterogeneity constant in Tóth equation [-]
hf fluid enthalpy [kJ kg-1]
hfg latent heat of vaporization [kJ kg-1]
k Freundlich constant [-]
k fitting parameter of modified D-A equation [-]
L smaple thickness [mm]
LR leakage rate [%]
M molar mass [g mol-1]
n
exponent of D-A equation [-]N number of observation [-]
P pressure [kPa or MPa]
P
c pressure at critical point [kPa or MPa]P
s saturation pressure [kPa or MPa]Q heat energy [J]
Q
st isosteric heat of adsorption [kJ kg-1] q volumetric adsorption uptake [cm3 g-1]q
0 maximum volumetric adsorption capacity [cm3 g-1] R gas constant [J mol-1k-1]RC refrigerant charge [kg kW-1]
Page | xxv Rp radius of the adsorbent particle [m]
t
time [ms or s or min]T temperature [°C or K]
T
C temperature at critical point [°C or K]V
m molar volume [cm3 g-1]v
m pore volume of the adsorbent [cm3 g-1]V
t specific volume of liquid carbon dioxide [cm3 g-1] W equilibrium uptake [g g-1 or kg kg-1]W
0 maximum equilibrium uptake [g g-1 or kg kg-1] Greek Symbols
thermal diffusivity [m2 s-1]* thermal expansion of the adsorbed gas [K-1]
density [kg m-3]
time constant [ms or s or min]W effective uptake [-]
Subscripts
ad adsorbent
ads adsorption
atm
atmosphericCC Clausious-Clapeyron
c
condensercond condenser
des desorption
e
evaporationevap evaporator
,
e a ending, adsorption
,
e d ending, desorption
max maximum
Page | xxvi
min minimum
ref refrigerant
s
saturationsat
saturationsens
sensible,
s a start, adsorption
,
s d start, desorption
Abbreviations
AC activated carbon
ACs activated carbons
COP coefficient of performance GWP global warming potential PIL polymerized ionic liquid SCE specific cooling effect
Chapter 1
Introduction
Conventional heat pump systems are often considered as one of the major contributors to environmental problems due to the usage of chlorofluoro, hydrochlorofluoro, and hydrofluoro carbon-based refrigerants. Furthermore, it also consumes a considerable amount of electricity. Earlier versions of refrigerants used to have high ODP as well as GWP. However, next generation refrigerants that are environmentally benign with excellent thermos-physical properties are still under development stage. This chapter includes the review of the historical development of refrigerants, their environmental impacts and observes the viewpoint for present options in terms of Montreal Protocol, Kyoto Protocol, and EU F-gas regulation. The direct CO2 emission per year from air-conditioning and refrigeration sectors due to the system leakage is assessed. It also examines the significant contributors of CO2 emission in every year among the various sectors for providing per kilowatt cooling effect. Finally, this chapter explains the motivation of this thesis to adsorption heat pumps systems. The objectives and outline of this thesis are presented in the later part of the chapter.
1.1 Background
Climate change as a consequence of global warming and ozone layer depletion is one of the most serious threats the world is facing today [1]. The greenhouse gas concentration in the troposphere is increasing especially due to the manmade activities, like transportation, industrialization and power generation etc. This gas absorbs the infrared radiation which results in increased atmospheric temperature known as climate change. The radiation energy is measured by global warming potential (GWP) which is defined as the infrared radiation amount that the gas can absorb, relative to carbon dioxide (GWP = 1), integrated over a time interval of 20, 100 and 500 years[2]. Refrigerant used in the conventional heat pump systems is responsible for the global warming and ozone layer depletion. Total equivalent warming impact (TEWI) is a tool for appropriate quantify of a refrigerant impact to global warming. Hwang et al. [3] defined two types of global warming effects. Firstly, the direct global-warming potential which is owing to the leakage
CHAPTER 1 INTRODUCTION
Page | 2 of refrigerants and other pollutants from the systems. Secondly, the indirect global- warming potential which is related to the carbon dioxide emission during combustion of fossil fuels (oil, natural gas, and coal) to generate electricity. The combined effect of direct refrigerant emission and energy consumption of a heat pump system are acknowledged as TEWI [2].
About 11 km above the earth surface ozone layer exist in the atmosphere and acts as a safeguard for earth for thousands of years [2]. Ozone layer consists of ozone (O3) molecules with a high concentration. All the harmful ultraviolet rays of the sun are efficiently absorbed by this layer. Any kind of demolition of this layer can cause significant destruction to the environment and the life on earth[2].
Heat pump technologies play a significant role in our everyday life. It offers not only comfortable and healthy living and working atmospheres but also considered as certainties for preserving food and medicine at extreme weather [2]. With the change of lifestyle and economic solvency, the demand and supply of such systems have gradually increased.
However, conventional air-conditioning (A/C) and refrigeration systems consume huge electricity and use refrigerants like chlorofluorocarbons (CFCs), hydrochlorofluorocarbons (HCFCs), which possesses high global warming potential (GWP) as well as ozone layer depletion potential (ODP) [4]. Currently, Hydrofluorocarbons (HFCs) are considered as an alternative to the CFCs and HCFCs in A/C systems. This refrigerant has no ODP, but it has high GWP. Many studies [5–8]have been focused on hydrofluoro-olefins (HFOs) as it has very low GWP. Fig. 1.1 shows the schematic diagram of a typical vapor compression cycle comprises the following four essential elements: an evaporator, where the refrigerant evaporates by taking heat from the external environment. A mechanical compressor, which sucks the evaporated vapors to compress and expel it at a higher pressure and temperature. The compressor consumes a considerable amount of electrical energy. A condenser, in which the vapor refrigerant condenses by transferring a certain amount of heat to the outdoor environment. An expansion valve, through which the liquid refrigerant returns back to the evaporator, with a lower pressure to repeat the cycle.
CHAPTER 1 INTRODUCTION
Page | 3 Fig. 1.1 Schematic diagram of a conventional heat pump system.
Notable researchers are also focusing natural refrigerants such as water, ethanol, and CO2 for thermally driven adsorption A/C and refrigeration systems [9–18]. This technology with natural refrigerants is considered as an alternative for the conventional systems in the near future.
1.2 Historical development of refrigerants
The refrigerant is the heat transfer fluid in refrigeration and air-conditioning systems.
It absorbs heat from one area, such as space, which needs to be cooled, and reject heat into outdoors, usually by evaporation and condensation, respectively. According to the information available in open literature, Oliver Evans in 1805 suggested using evaporative two-phase fluid in a closed cycle to freeze water into ice. He proposed a system that can produce a cooling effect by evaporating ether. Jacob Perkins and Richard Trevithick are influenced by that idea and proposed an air-cycle system for refrigeration in 1828. Perkins in 1830 invented a vapor the compression machine by using sulfuric (ethyl) ether as a refrigerant. The common refrigerants for the first generation (1830-1930s) were familiar solvents and other volatile fluids whatever worked as a refrigerant at that time. Almost none of those refrigerants were environment-friendly because of flammability, toxicity, or both and some were highly reactive to the heat exchanger material. Some common early refrigerants were ethers, CO2, NH3, SO2, HCs, H2O, CCl4 [19]. The second-generation (1931-1990s) refrigerants were famed by a shift to fluoro-chemicals for safety and
CHAPTER 1 INTRODUCTION
Page | 4 durability. Midgley and Henne invented Freon in 1928 as a refrigerant. Well-known refrigerants in the second generation were CFCs and HCFCs (R11, R12, R22, R502) and NH3. Commercial production of R12 started in 1931 followed by R11 in 1932. Ammonia (NH3) is one of the older types of refrigerant and remains until now, the most prevalent refrigerant in large, industrial systems particularly for beverage, storage, and food. CFCs are responsible to create the hole in the ozone layer. The Vienna Convention and resulting Montreal Protocol designed to phase out the production of ozone-depleting substances (ODSs). Therefore, the primary focused of the third generation refrigerant (1990-2010s) was HCFCs and HFCs for the longer term, such as R123, R134a, R410A, R404A, many blends and also NH3 [19]. Actually, most of the third generation refrigerants had ODP and high GWP. Therefore, fourth generation (from 2010 to now) is mainly focused on zero ODP and low GWP refrigerants. Fig. 1.2 represents the schematic drawing of refrigerant progression.
Fig. 1.2 Refrigerant progression [19].
1.3 GWP and ODP of commonly used refrigerants
The environmental effects and safety classification of widely used refrigerants are shown in Table 1.1. Both CFCs and HCFCs have ODP and GWP. However, HFCs have only GWP. After the Montreal Protocol signed in 1987, the CFCs and HCFCs are gradually banned due to their harmful effect on the ozone layer. Most of the existing refrigerants in
CHAPTER 1 INTRODUCTION
Page | 5 commercialized A/C systems are HFCs. Although HFCs does not have an impact on the ozone layer, they have GWP. Research has been intensified to find alternative refrigerants to conventional HFCs after adopting the above-mentioned international protocols.
Table 1.1 Features of widely used refrigerants according to IPCC 5th assessment report 2014 [19].
Compositional group Refrigerant number
Chemical formula
Ozone depletion potential (ODP)
Global warming potential (GWP)
Safety group
CFCs R11 CCl3F 1 4660 A1
R12 CCl2F2 1 10200 A1
R113 CCl2FCClF2 0.8 5820 A1
R114 CClF2CClF2 1 8590 A1
R115 CClF2CF3 0.6 7670 A1
HCFCs R22 CHClF2 0.055 1760 A1
R123 CHCl2CF3 0.02 79 B1
R124 CHClFCF3 0.022 527 A1
R142b CH3CClF2 0.065 1980 A2
HFCs R23 CHF3 0 12400 A1
R32 CH2F2 0 677 A2L
R125 CHF2CF3 0 3170 A1
R134a CF3CH2F 0 1300 A1
R143a CH3CF3 0 4800 A2
R152a CH3CHF2 0 138 A2
R410A R32 (50%)
R125 (50%)
0 1900 A1
CHAPTER 1 INTRODUCTION
Page | 6 1.4 Assessment of global warming potential
Gschrey et al.[20] mentioned that the impact of fluorinated gases (F-gases) to global warming would rise from roughly 1.3% (2004) to 7.9% (2050) of expected total CO2
emissions [21,22]. Still, most of the refrigerants used in refrigeration and A/C systems are F-gases. Leakage of refrigerant gases from these systems influences the environment in two ways (Koronaki et al.[23]). Firstly, there is a direct effect due to the GWP of the leaked gas, and secondly, there is an indirect effect owing to the energy consumption by the system (Grace et al. [20]). In this study, the direct effect due to high GWP of refrigerants has been considered. The leakage rate of refrigerant is different for different systems. According, UK Greenhouse Gas (GHG) inventory for 2007, Table 1.2 represents the leakage rates for the different types of refrigeration and A/C system [23].
For investigating, the direct GHG emission four cases such as room A/C, domestic refrigeration, commercial refrigeration, and industrial refrigeration are considered.
Furthermore, HCFC (R22), HFCs (R410A, R134a, and R32), HFO (R1234yf, R1234ze) and natural (R600a) refrigerants have been used for the assessment of direct global warming impact. Refrigerant charge into system depends on system type and capacity.
Poggi et al. [24] mentioned the specific charge amount per kW capacity based on the size the heat pump systems. Fig. 1.3 shows the specific charge (kilogram per kilowatt) amount in complete systems for different applications using different refrigerants[25]. It can be observed that initial charging amount of refrigerant in different kinds and sizes are different.
Table 1.2 Direct GHG emissions rate by refrigeration and air-conditioning sector [23].
Type of equipment Annual leak rate
Domestic refrigeration 0.30%
Stand-alone commercial applications 2.00%
Medium & large commercial applications 11.00%
Industrial refrigeration 8.00%
Residential/commercial air-conditioner 8.5%
The direct global warming impact per kW capacity has been calculated using equation (1.1)[25]. Leakage occurs mostly near the compressor side. It is happing when
CHAPTER 1 INTRODUCTION
Page | 7 the pressure of gas increased; it is much higher than atmospheric pressure compressed by the compressor. In this study, condenser temperature has been considered 40°C to calculate the pressure of leakage gas, as it is an isobaric process. Therefore, leakage rate differs from one refrigerant to another, as their operating pressure is different.
direct ref
GWP RC LR GWP (1.1) where GWPdirect denotes the direct global warming impact, RC is the refrigerant charge (kg kW-1), LR is the leakage rate of initial charge (per year), and GWPref represents the GWP of refrigerant.
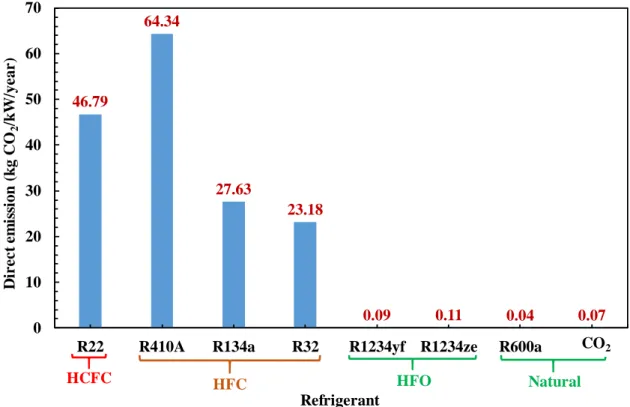
Fig. 1.4 represents direct emission amount of CO2 per kW/year for the residential A/C system. It can be seen that R22 shows high emission rate with contains ODP value.
HFC group (R410A, R134a, and R32) does not contain any ODP, however high GWP emission rate has been observed. It is highlighted that R32 shows quite low CO2 emission compared to other HFCs, which is recently promising worldwide. HFOs and natural refrigerant emit almost zero emission. Therefore, HFOs and natural refrigerants are potential for next generation heat pump technology. However, due to low system performance and flammability, these refrigerants need further study to use in every sector.
A similar trend has been observed for domestic, commercial and industrial refrigeration systems. Fig. 1.5 shows the comparison of direct emission amount of CO2 per kW/year for the various system. It is observed that industrial and commercial refrigeration systems are a significant contributor to direct emission of GHG because of the high leakage rate and high amount of initial charging of refrigerant. It can be concluded here that conventional heat pump technology still emits high rate of CO2 to the environment although current refrigerants possess low GWP. International protocols such as Kyoto protocol are continuously forcing the heat pump industries for using low GWP refrigerants and shift to natural refrigerants.
CHAPTER 1 INTRODUCTION
Page | 8 Fig. 1.3 Specific charge amount in complete systems for different applications using different refrigerants [24].
![Table 1.1 Features of widely used refrigerants according to IPCC 5 th assessment report 2014 [19]](https://thumb-ap.123doks.com/thumbv2/123deta/9880612.1906196/35.892.159.812.324.984/table-features-widely-refrigerants-according-ipcc-assessment-report.webp)
![Table 1.2 Direct GHG emissions rate by refrigeration and air-conditioning sector [23]](https://thumb-ap.123doks.com/thumbv2/123deta/9880612.1906196/36.892.192.802.848.1043/table-direct-ghg-emissions-rate-refrigeration-conditioning-sector.webp)