九州大学学術情報リポジトリ
Kyushu University Institutional Repository
三次元連通気孔構造を有するβ型リン酸三カルシウ ム骨補填材の創製
二階堂, 太郎
Graduate School of Dental Science, Kyushu University
https://doi.org/10.15017/26337
出版情報:Kyushu University, 2012, 博士(歯学), 課程博士 バージョン:
権利関係:
Fabrication of βTCP Foam Bone Replacement with Fully Interconnected Porous Structure
2013
Taro Nikaido
Fabrication of βTCP Foam Bone Replacement with Fully Interconnected Porous Structure
三次元連通気孔構造を有する
β 型リン酸三カルシウム骨補填材の創製
Thesis
Submitted as a partial fulfillment of the requirements for the degree of
Doctor of Philosophy (PhD) in Dental Science
By Taro Nikaido, DDS
Section of Biomaterials, Division of Oral Rehabilitation, and
Section of Oral and Maxillofacial Oncology,
Division of Maxillofacial Diagnostic and Surgical Sciences, Graduate School of Dental Science Kyushu University,
Fukuoka, Japan 2013
Published Paper and Presentations
Publications;
“Fabrication of TCP with Fully-Interconnected Porous Structure”
Key Engineering Materials 2012; 493-494: 166-169.
“Fabrication of TCP foam Using αTCP Foam as a Precursor by Heat Treatment”
Key Engineering Materials 2013; 529-530: 15-18.
Presentations;
*The International Dental Materials Congress 2011, Seoul, May, 2011
*Bioceeramics23, Istanbul, November, 2011
*Bioceeramics24, Fukuoka, October, 2012
*Asian Academy of Osseointegration, Thaipei, November, 2012 and other domestic conferences.
Table of Contents
CHAPTER 1 Introduction
1.1 Bone Grafts………..1
1.2 Calcium Phosphate as Bone Grafts……….2
1.3 βTCP Bone Replacements………...3
1.4 Porous Calcium Phosphate as Bone Grafts……….5
1.5 Fabrication of Cancellous Bone Type Structure Foam………6
1.6 Purpose of βTCP Foam Bone Replacements………...9
CHAPTER 2 Fabrication of βTCP Foam Bone Replacement Using Magnesium Oxide as βTCP Stabilizer 2.1 Introduction………...10
2.2 Materials and Methods………..11
2.2.1 Sample Preparation………..11
2.2.1.1 Preparation of Powder Mixture………...11
2.2.1.2 Fabrication of TCP foam……….11
2.2.2 Characterization………12
2.2.2.1 XRD Analysis………..12
2.2.2.2 Macropore Structure Observation………...13
2.2.2.3 Linear Shrinkage Measurement………...13
2.2.2.4 Microstructure Observation……….13
2.2.2.5 Porosity Measurement……….13
2.2.2.6 Mechanical Strength Measurement……….14
2.3 Results………...14
2.3.1 Macroscopic Structure………..14
2.3.2 Crystal Phase………15
2.3.3 Macropore Structure and Linear Shrinkage……….18
2.3.4 Microstructure………..20
2.3.5 Porosity……….22
2.3.6 Compressive Strength………...23
2.4 Discussion……….24
2.5 Conclusion……….27
CHAPTER 3 Fabrication of Pure βTCP Foam Bone Replacement Based on Phase Transformation of αTCP Foam by Heat Treatment Below α-β Transition Temperature 3.1 Introduction………...28
3.2 Materials and Methods………..29
3.2.1 Sample Preparation ……….29
3.2.1.1 Preparation of αTCP Foam Precursor……….29
3.2.1.2 Heat Treatment of αTCP Foam………...30
3.2.2 Characterization………....30
3.2.2.1 Macropore Structure Observation………..30
3.2.2.2 Linear Shrinkage Measurement………..30
3.2.2.3 Porosity Measurement……….30
3.2.2.4 XRD Analysis………..31
3.2.2.5 Microstructure Observation……….31
3.2.2.6 Mechanical Strength Measurement……….31
3.3 Results………...31
3.3.1 Macropore Structure, Linear Shrinkage and Porosity…………31
3.3.2 Crystal Phase………33
3.3.3 Microstructure………..36
3.3.4 Compressive Strength………...38
3.4 Discussion……….39
3.5 Conclusion……….41
CHAPTER 4 In Vivo Evaluation of βTCP Foam Bone Replacement Using Rabbits. 4.1 Introduction………...42
4.2 Materials and Methods………..42
4.2.1 βTCP Foam Preparation………...42
4.2.2 Surgical Procedure………43
4.2.3 Micro-CT Scan Analysis………..45
4.2.4 Histological Examination……….46
4.3 Results………...46
4.3.1 Micro-CT Images After Implantation of αTCP Foam…………..46 4.3.2 Micro-CT Images After Implantation of HAp Foam…………...47 4.3.3 Micro-CT Images After Implantation of Mg-βTCP Foam……...48 4.3.4 Micro-CT Images After Implantation of HT-βTCP Foam………50 4.3.5 Histological Appearances……….51 4.4 Discussion……….53 4.5 Conclusion……….55
CHAPTER 5
Summary………56
References………..………58
Acknowledgements………64
- 1 -
CHAPTER 1 Introduction
1.1 Bone Grafts
Bone tissue has ability to be repaired by itself when damaged due to a disease or an accident. However, the spontaneous healing cannot be expected when bone defects are large, thus bone graft material is necessary to repair the bone defect. In the dental implant surgery, especially bone graft material is required since the volume of bone in edentulous jaw is smaller than healthy alveolar bone. If implant is placed on the residual alveolar bone, the position and direction of the implant cannot be aligned for suitable arrangement of the teeth because of the limited amount of alveolar bone. Therefore, horizontal and vertical bone formation is required to place the dental implant in the best position of jaw bone.
Autograft, allograft, xenograft and artificial bone graft materials are used as bone grafts at present [1, 2]. Golden standard of bone graft used for the reconstruction of bone defects and building up new bone is autograft which is bone taken from patient’s ilium or fibula, since the bone is equipped with essential properties for the bone regeneration such as osteoconductivity and ostrogenic ability. However an additional surgery is necessary to obtain the autograft from other healthy site, which often results in trauma and pain to the patient. Besides, the shape and amount of
- 2 -
collectable bone is limited [3, 4]. Allograft which is a bone donated from cadavers can also be used for the patient. The use of allograft is popular in the United States. However, several cases of viral infection such as human kind immunodeficiency virus (HIV), viral hepatitis, and human T-lymphotropic virus (HTLV) have been reported [5, 6]. Xenograft which is a bone obtained from species other than human has many obstacles arising from the response of the recipient’s immune system. This immune response generally happens more than allograft [7, 8]. In contrast, artificial bone graft materials are free from these problems. In fact, several kinds of artificial bone graft materials have been developed and used in clinic up to date.
1.2 Calcium Phosphate as Bone Grafts
The bone tissue of human body holds a large amount of calcium ions and phosphate ions. Since calcium phosphate material has similarities to inorganic component of bone, it shows excellent tissue response and good osteoconductivity [9, 10].
Among calcium phosphates, sintered hydroxyapatite (HAp:
Ca10(PO4)6(OH)2) and β-tricalcium phosphate (βTCP: Ca3(PO4)2) have been widely applied because of its excellent tissue response and good osteoconductivity [11, 12]. Especially, HAp shows superior osteoconductivity, which can bond to bone without having fibrous tissue
- 3 -
between HAp and bone when HAp is placed adjacent to bone [13-15]. If HAp behave similar to autograft for the bone tissue reconstruction, autograft is no longer needed. However, it is hardly resorbed and remains in the body for a long period [16, 17]. Remaining sintered HAp could be a possible cause of problems associated with mechanical property or infection [18]. In contrast, βTCP is generally replaced to bone [19- 22].
1.3 βTCP Bone Replacements
TCP has two polymorphs. βTCP is stable below 1,180C with the rhombohedral space group R3c and a room temperature density of 3.07 g/cm. Whereas α-tricalcium phosphate (αTCP) is stable above 1,180C, but can be quenched to room temperature as a metastable phase, with the monoclinic space group P21/a and a room temperature density of 2.86 g/cm [23].
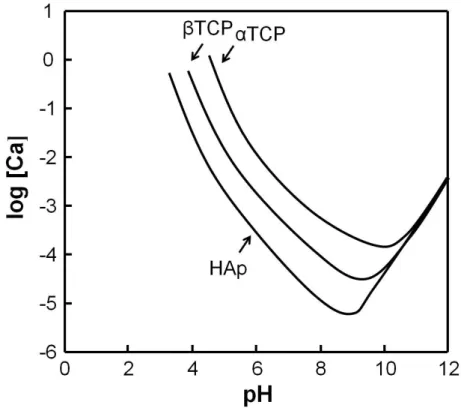
αTCP have been widely applied as a powder component for apatite cements, since αTCP has higher solubility in aqueous solution by referring to Figure 1-1 [24-26]. In contrast, βTCP has been used as bone replacements in clinics due to its tissue compatibility, osteoconductivity and bioresorbability [27-29]. Although HAp and βTCP are different only on the composition of one calcium, βTCP takes the distorted crystal structure as a result of the disconnection of two hydroxyl groups in order to compensate for the charge. Therefore, solubility of βTCP is higher when
- 4 -
compared to that of HAp under room temperature and acidic environment due to the increase of internal energy. The difference of solubility appears as the difference of bioresorbability in the living body [30]. HAp is used to support the structure and intension, while βTCP is used when required to replace to new bone.
Figure 1-1 Solubility phase diagrams of αTCP, βTCP and HAp as function of pH.
TCP promotes bone formation and will be replaced to new bone through a process of absorption-elution. In the early phase, TCP functions as the core to promote the bone formation around it and surround by newly formed bone. Thereafter, TCP goes incorporated in the process of bone
- 5 -
remodeling with time and would be replaced to new bone [31]. It is considered that TCP could be one of the ideal bone replacements due to its osteoconductivity and suitable bioresorbability.
1.4 Porous Calcium Phosphate as Bone Grafts
It has been indicated that not only the chemical composition but also the structure of bone graft materials is important for good clinical results [32, 33]. In clinical fields, fracture from the part of the implanted artificial bone grafts has been experienced after several years from six months after surgery, rather than immediately after surgery. In such case, although the bone and the surface of the filling material are bounded together, inside the bone graft material has less bone tissue and has not been integrated with bone [34]. Therefore, porous calcium phosphates were developed to allow living tissue penetration inside the materials and integrate with bone.
Porous structure with large porosity and number of pores is more advantageous to bone formation [35, 36]. In addition, pore size of 300 to 400 µm have been shown to enhance bone and capillary formation. If pore size is too large, bone formation cannot be enhanced but fibrous tissue would be formed. In contrast, smaller pore results in disorder of bone formation since it cannot allow vascularization and high oxygenation [37].
OSferion® (OLYMPUS Corp., Tokyo, Japan) is one of the porous βTCP bone replacement. Although interconnected porous structure is observed,
- 6 -
some pores are closed pores (Figure 1-2). If artificial bone graft material with fully interconnected porous structure is fabricated, living tissue could invade the inside of grafts, so early integration with bone is expected. In fact, it has been reported that the volume of bone ingrowth at early times is primarily pore interconnectivity dependent [38, 39]. This early integration with bone is also expected to increase the mechanical property at an early period after implantation.
Figure 1-2 Magnified views of OSferion® βTCP bone replacement.
1.5 Fabrication of Cancellous Bone Type Structure Foam
Rate of the bone remodeling is different based on the structure of bone.
Cancellous bone is known to be replaced to new bone ten times faster than cortical bone. Of course faster bone remodeling is thought to be the result of fully interconnected porous structure. Therefore, it is reasonable to fabricate artificial bone graft materials similar to the structure of cancellous
- 7 -
bone [40]. Aside from compositional properties of the material, fully interconnected structure like cancellous bone is necessary to allow cell attachment, proliferation and differentiation and to provide pathways for biological fluids [41].
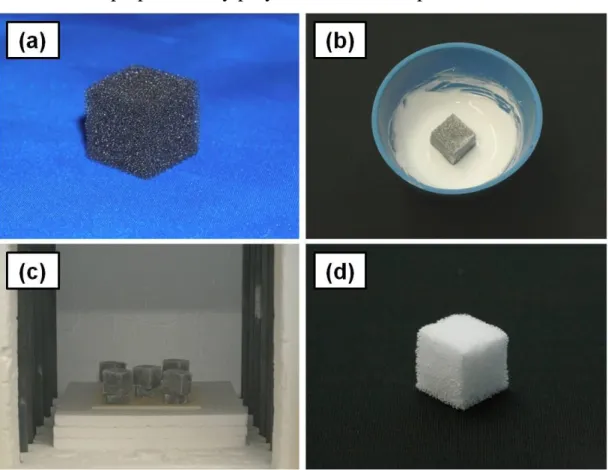
One of the methods to fabricate artificial bone graft materials with cancellous bone type structure is so-called polyurethane foam replica method or ceramics foam method. Figure 1-3 shows the procedure of ceramics foam preparation by polyurethane foam replica method.
Figure 1-3 Procedure of ceramics foam preparation by polyurethane foam replica method: (a) polyurethane foam used as the template, (b) coating with ceramics slurry, (c) sintering in the furnace and (d) ceramics foam obtained after sintering.
- 8 -
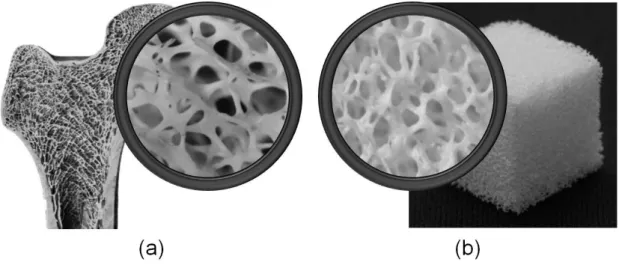
In this method, polyurethane foam used as a template is immersed in ceramics slurry so that the strut of the polyurethane foam is coated with ceramics powder. When the ceramics powder coated polyurethane foam is heated in a furnace, both sintering of ceramics powder and burning out of the polyurethane foam occur simultaneously since polyurethane is a thermosetting plastic. Then ceramics foam similar to cancellous bone structure would be fabricated as shown in Figure 1-4. Fabrication of HAp foam and αTCP foam using the polyurethane foam replica method has been previously reported [42, 43]. According to our preliminary study, ceramics foam was made from polyurethane foam template with an average pore size of 500 µm and pore approximately 300 to 400 µm in size, which was ideal for cell penetration.
Figure 1-4 Structure of (a) cancellous bone and (b) ceramics foam.
- 9 -
1.6 Purpose of βTCP Foam Bone Replacements
As stated above, βTCP foam could be one of the ideal bone replacements, not only the chemical composition but also its fully interconnected porous structure. However, relatively high temperature is required for the sintering process, since compacting process cannot be employed in the polyurethane foam replica method. Actually, TCP foam sintered at 1,150C, below α-β transition temperature, was very fragile so that it cannot be taken out from the furnace even though it kept the fully interconnected porous structure of the polyurethane foam template. Higher temperature sintering is useful to improve the mechanical strength of the foam. However higher temperature sintering results in phase transformation from TCP to αTCP since α-β transition temperature is 1,180C [44].
The objective of this study, therefore, was to investigate the fabrication method of βTCP foam with fully interconnected porous structure. In chapter 2, fabrication of βTCP foam bone replacement using magnesium oxide as βTCP stabilizer will be discussed. In chapter 3, fabrication of pure βTCP foam bone replacement based on phase transformation of TCP foam by heat treatment below α-β transition temperature will be discussed.
In chapter 4, evaluation of the fabricated βTCP foams through in vivo study using rabbits will be discussed.
- 10 -
CHAPTER 2
Fabrication of βTCP Foam Bone Replacement Using Magnesium Oxide as βTCP Stabilizer
2.1 Introduction
In the clinical field of bone reconstruction, there is a requirement to fabricate βTCP bone replacement with fully interconnected porous structure in some clinical cases. That could be achieved by fabrication of βTCP foam. As stated in Chapter 1, βTCP foam with fully interconnected porous structure has not been obtained by polyurethane foam replica method yet, since βTCP converted to αTCP at high temperature required for the sintering.
On the other hand, Ando has reported that addition of magnesium oxide (MgO) as sintering additive is useful for the stabilization of TCP phase at high temperature [45]. It was reported that addition of MgO to TCP could increase α-β transition temperature more than 1,500C [46-49]. If so, TCP foam may be fabricated by sintering at 1,500C using MgO as TCP phase stabilizer. In this Chapter, therefore, the feasibility of βTCP foam bone replacement fabrication was investigated using MgO as βTCP stabilizer.
- 11 -
2.2 Materials and Methods 2.2.1 Sample Preparation
2.2.1.1 Preparation of Powder Mixture
Calcium carbonate (CaCO3) and dicalcium phosphate anhydrous (CaHPO4) were used as starting chemicals for preparing βTCP foam. MgO was selected as source of magnesium (Mg) ions. Each powder of CaCO3, CaHPO4 and MgO (Wako Pure Chemical Industries, Ltd., Osaka, Japan) was measured so that the amount of MgO was 0, 1, 2, 3, 4, 6 and 8 mol
with (CaMg)/P molar ratio of 1.5. These measured powders were mixed with 35 mL of 98% ethanol in a plastic bottle with agate balls in a milling machine (AV-1, Asahi Rika Co., LTD., Chiba, Japan) for 12 hours and dried in a drying oven (DO-300A, AS ONE Corp., Osaka, Japan) at 60C for at least 12 hours to remove the ethanol.
2.2.1.2 Fabrication of TCP Foam
Polyurethane foam replica method was used for the fabrication of the TCP foam. Polyurethane foam (HR-20D, Bridgestone Corp., Tokyo, Japan) with an average pore size of about 500 µm in diameter was cut into square 20×20×20 mm in size and used as a template for the TCP foam fabrication.
Prepared powder mixtures were made into slurry with 5wt polyvinyl alcohol (Ishizu Pharmaceutical Com. Ltd., Osaka, Japan) aqueous solution at a powder/liquid ratio of 8 g/10 mL. The polyurethane foams were
- 12 -
immersed in the prepared slurry and excess slurry was removed by squeezing. Then the slurry coated polyurethane foams were dried in a drying oven at 60C for at least 12 hours, followed by sintering in a programmable electric furnace (SC-2035D, Motoyama, Osaka, Japan). The coated foams were heated at a rate of 1C/min from room temperature to 400C to burn out the polyurethane foam, and then 5C/min from 400C to 1,500C. The foams were kept at 1,500C for 5 hours and allowed to cool down inside the furnace to room temperature. Content of Mg in molar percentage in the foam is stated in the parenthesis when necessary. For example, TCP(3) represent TCP containing 3 mol% Mg in the TCP foam.
2.2.2 Characterization 2.2.2.1 XRD Analysis
Crystal phase of the TCP foams were analyzed using powder X-ray diffraction (XRD). The obtained TCP foams were ground into fine powder and subjected to XRD analysis. XRD patterns of the samples were recorded with an X-ray diffractometer (D8 Advance, Bruker AXS GmbH., Karlsruhe, Germany) with a CuKα radiation (λ=0.1542 nm) operated at 40 kV of tube voltage and 40 mA of tube current. Samples were scanned from 10º to 70º in 2θ (where θ is the Bragg angle) at a continuous mode, and references for αTCP and βTCP identifications were made to JCPDS cards 29-0359 and 55-0898 respectively.
- 13 -
2.2.2.2 Macropore Structure Observation
Macropore structure of the obtained TCP foam was observed under light microscope (SZX2-ILLK, Olympus Corp., Tokyo, Japan).
2.2.2.3 Linear Shrinkage Measurement
Linear shrinkage was determined by comparing the original size of polyurethane foam template with size of the TCP foams after sintering. The average values of linear shrinkage in length and width were used for linear shrinkage measurement and expressed in percentage.
2.2.2.4 Microstructure Observation
Microstructure of the TCP foams was observed by scanning electron microscope (SEM: S-3400N, Hitachi High-Technologies Corp., Tokyo, Japan) at 15 kV of accelerating voltage after gold palladium coating.
2.2.2.5 Porosity Measurement
The porosity of the TCP foams was calculated based on the real density of TCP and the bulk density of TCP foam, and expressed as percentage as shown in the following equation:
Porosity of TCP foam (%) 100×(dTCP dTCP foam)/ dTCP
- 14 -
where dTCP is the real density of TCP and dTCP foam the bulk density of TCP foam. The real density of TCP was calculated based on the weight and volume of ground sintered TCP foam using pycnometer. Bulk density of the TCP foam was calculated based on the weight and volume of the sintered TCP foam.
2.2.2.6 Mechanical Strength Measurement
Mechanical strength of TCP foam was evaluated in terms of compressive strength, which was measured by crashing the foam at a crosshead speed of 1 mm/min using a universal testing machine (Autograph AGS-J, Shimadzu Corp., Kyoto, Japan). Each compressive strength mean value with standard deviation (SD) was calculated from 15 samples.
2.3 Results
2.3.1 Macroscopic Structure
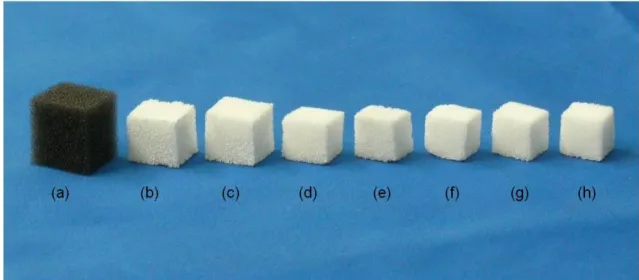
Figure 2-1 shows the typical macroscopic structure of polyurethane foam template and TCP foams obtained in the present study. As shown in this picture, the resultant TCP foams had fully interconnected porous structure almost similar to polyurethane foam template even though obtained TCP foams were smaller than the template. TCP(0) and TCP(1) foam were larger than TCP(2), TCP(3), TCP(4), TCP(6) and TCP(8) foams.
- 15 -
Figure 2-1 Typical macroscopic structure of (b) TCP(0) foam, (c) TCP(1) foam, (d) TCP(2) foam, (e) TCP(3) foam, (f) TCP(4) foam, (g) TCP(6) foam and (h) TCP(8) foam obtained after sintering at 1,500ºC. Typical macroscopic structure of polyurethane foam template (a) was also shown for comparison.
2.3.2 Crystal Phase
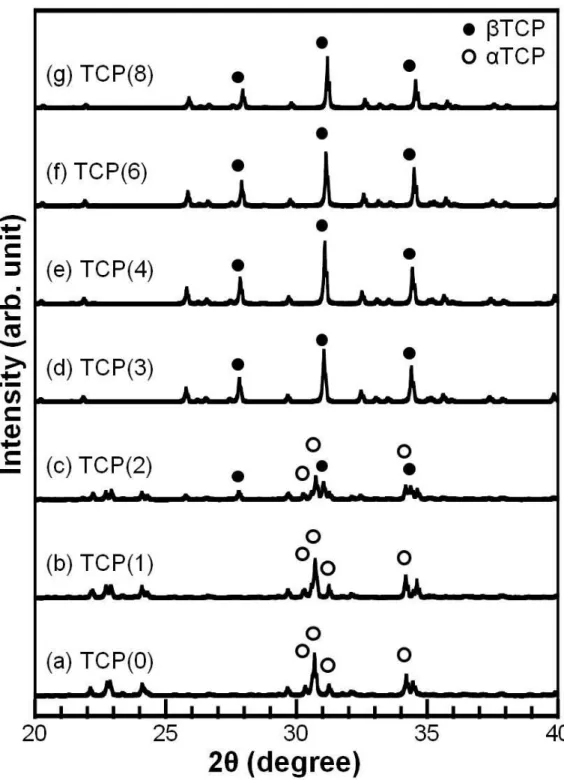
Figure 2-2 summarizes the powder XRD patterns of the TCP foams obtained after sintering at 1,500C. Crystal phase of the TCP(0) and TCP(1) foams was single phase TCP. In contrast, crystal phase of the TCP(3), TCP(4), TCP(6) and TCP(8) foams was single phase TCP. In the case of TCP(2) foam, crystal phase was a mixture of TCP and TCP. No peaks corresponding to MgO was detected in the XRD patterns even for the foam containing 8 mol% Mg.
- 16 -
Figure 2-2 XRD patterns of foams obtained after sintering at 1,500ºC and containing different amount of Mg. Mg content is as follows; (a) 0 mol%, (b) 1 mol%, (c) 2 mol%, (d) 3 mol%, (e) 4 mol%, (f) 6 mol% and (g) 8 mol%. (Open circles: αTCP, Closed circles: βTCP)
- 17 -
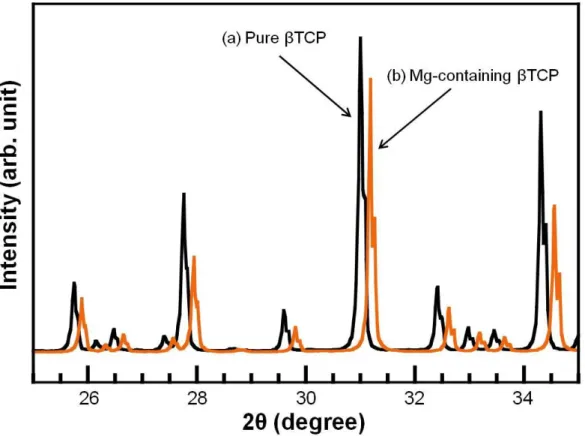
Figure 2-3 shows the powder XRD patterns of the TCP(8) foams and commercially obtained TCP powders were also shown for comparison.
When the TCP contained Mg, peak shift occurred.
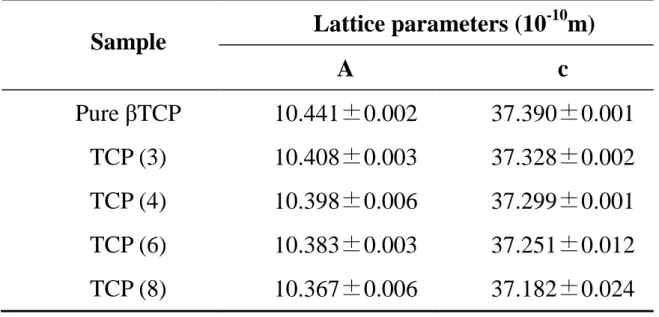
Table 2-1 summarizes the lattice parameters a-axis and c-axis of the βTCP foams. Both a-axis and c-axis became shorter with increasing addition amount of MgO to βTCP. Peak shift and change of the lattice parameters indicated that Mg was incorporated in the lattice of βTCP crystal structure and were in agreement with the previous report [50, 51].
Figure 2-3 XRD patterns of (a) pure βTCP and (b) Mg-containing TCP foam. Mg-containing TCP foam shown was TCP(8) foam. XRD pattern of commercially obtained pure TCP was shown for comparison.
- 18 -
Table 2-1 Lattice parameters (a- and c-axis dimensions) of the TCP obtained after sintering at 1,500ºC and containing different amount of Mg.
Lattice parameters of commercially obtained pure TCP was shown for comparison.
Sample Lattice parameters (10-10m)
A c
Pure βTCP 10.441±0.002 37.390±0.001 TCP (3) 10.408±0.003 37.328±0.002 TCP (4) 10.398±0.006 37.299±0.001 TCP (6) 10.383±0.003 37.251±0.012 TCP (8) 10.367±0.006 37.182±0.024
2.3.3 Macropore Structure and Linear Shrinkage
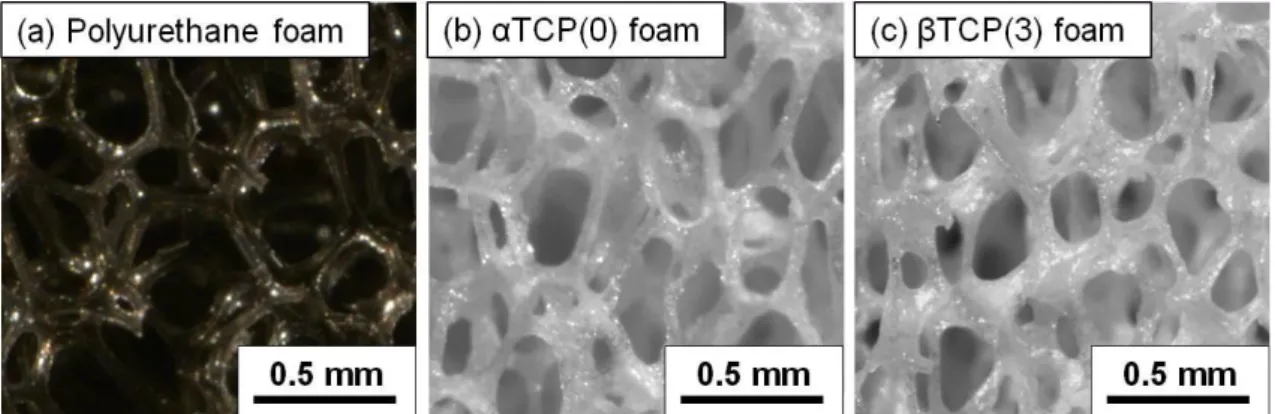
Figures 2-4 shows the magnified views of polyurethane foam used for the template, TCP(0) foam and TCP(3) foam under an optical microscope.
Since the crystal phase of the TCP(0) and TCP(3) foams were found to be
and TCP, they are stated as TCP(0) and TCP(3) foams in the following text and figures. Although optical microscopic observation revealed more detailed structure, findings were basically the same with observation shown in Figure 2-1. TCP(0) and TCP(3) foams demonstrated basically the same interconnected porous structure with that of polyurethane foam. The pore size of TCP foams was smaller than that of
- 19 -
the polyurethane foam due to shrinkage caused by the sintering process, and the pore size of βTCP(3) foam, approximately 330 µm, was smaller than that of TCP(0) foam, approximately 380 µm.
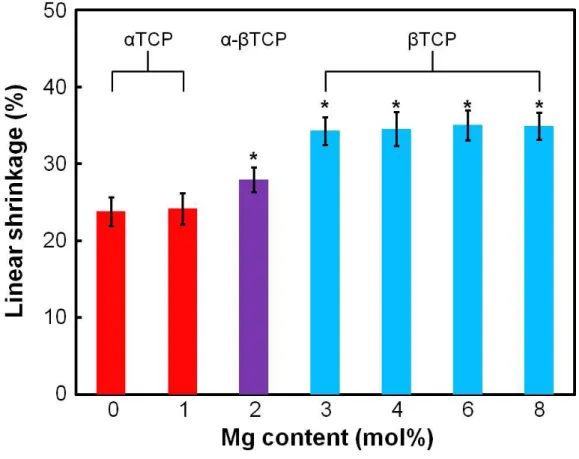
Figure 2-5 summarizes the linear shrinkage of the TCP foams containing different amount of Mg. The linear shrinkage of TCP foam, approximately 35, was significantly larger than that of TCP foam, approximately 24. Linear shrinkage of the -TCP(2) with the mixture crystal phase of TCP and TCP was between those of TCP foam and
TCP foam. There was no significant difference regardless of the amount of added MgO when the crystal phase of the foams was the same.
Figure 2-4 Magnified views of (a) Polyurethane foam template, (b)
TCP(0) foam and (c) TCP(3) foam obtained after sintering at 1,500ºC.
- 20 -
Figure 2-5 Effect of Mg contents on the linear shrinkage of TCP foams obtained after sintering at 1,500ºC. TCP(0) and TCP(1) were TCP foam.
TCP(2) was -TCP foam. TCP(3), TCP(4), TCP(6) and TCP(8) were
TCP foam. * p < 0.01, compared with αTCP(0) foam.
2.3.4 Microstructure
Figure 2-6 shows the typical SEM images of TCP foam, -TCP foam and TCP foam. As can be seen from these images, surface of TCP foams was found to be smoother than that of TCP foams. Smoothness of
-TCP foam was between TCP foams and TCP foams.
- 21 -
Figure 2-6 SEM images of (a) TCP(0) foam, (b) TCP(1) foam, (c)
-TCP(2) foam, (d) TCP(3) foam, (e) TCP(4) foam, (f) TCP(6) foam and (g) TCP(8) foam obtained after sintering at 1,500ºC.
- 22 -
2.3.5 Porosity
Figure 2-7 shows the porosity of the TCP foams containing different amount of Mg. The porosity was as high as 90% for all samples regardless of the amount of added MgO. Porosity of the TCP foams, approximately 93%, was significantly higher the that of TCP foams, approximately 90%.
Porosity of the -TCP foams was higher than that of TCP foams but lower than that of TCP foams.
Figure 2-7 Porosity of TCP foams obtained after sintering at 1,500ºC and containing different amount of Mg. TCP(0) and TCP(1) were TCP foam.
TCP(2) was -TCP foam. TCP(3), TCP(4), TCP(6) and TCP(8) were
TCP foam. * p < 0.01, compared with αTCP(0) foam.
- 23 -
2.3.6 Compressive Strength
Figure 2-8 shows the compressive strength of the TCP foams containing different amount of Mg. The compressive strength was approximately 65 kPa regardless of the amount of added MgO. Moreover there was no significant difference between αTCP foam and βTCP foam.
Figure 2-8 Compressive strength of TCP foams obtained after sintering at 1,500ºC and containing different amount of Mg. TCP(0) and TCP(1) were
TCP foam. TCP(2) was -TCP foam. TCP(3), TCP(4), TCP(6) and TCP(8) were TCP foam.
- 24 -
2.4 Discussion
In the polyurethane foam replica method, compaction process could not be applied to retain its interconnecting structure. Thus this method required relatively high temperature, 1,500°C, which is higher than α-β transition temperature. That is the reason why pure TCP foam has not been fabricated using the polyurethane foam replica method until now. In the present study, TCP foam was successfully prepared using the polyurethane foam replica method at 1,500°C by employing MgO as βTCP stabilizer.
In Figure 2-2, it is clearly demonstrated that 3 mol% or larger amount of Mg was the key for stabilizing TCP phase when sintered at 1,500°C.
Enderle et al. reported that stabilization of βTCP structure required at least 4 mol% or larger amount of Mg when sintered at 1,500°C. Required amount of Mg for stabilization of TCP structure in this study was almost similar to this previous report [52]. On the other hand, the addition of 2 mol% MgO or less, some regions could not be stabilized and αTCP was formed. In addition, the lattice constants for both a-axis and c-axis slightly decreased when the amount of Mg was increased. This contraction in lattice parameters was in agreement to previous reports [53, 54]. The significant changes noticed in a-axis and c-axis are clear evidence of Mg incorporation into the TCP structure and that it does not just cover the surface of βTCP.
βTCP foams obtained after sintering process showed basically the same
- 25 -
structure of the polyurethane foam used for the template. This means that the obtained TCP foam had a fully interconnected porous structure (Figure 2-4). However, the size of TCP foams became smaller after the sintering process and the linear shrinkage of TCP foam was larger than that of TCP foam. The larger shrinkage of TCP foam obtained when the MgO used as βTCP stabilizer was more than 3 mol% was due to the different density of αTCP and βTCP. To further elaborate, when the precursor of TCP foam was heated, shrinkage and formation of βTCP occurred simultaneously when the amount of MgO was less than 3 mol%.
Then, at the α-β transition temperature, βTCP converted to αTCP and the foam expanded. This result was in agreement with similar finding of Ryu et al. It reported that the phase transformation of TCP to TCP is closely related with the expansion of sample volume and declining in shrinkage rate [55]. However, in the case of MgO that was more than 3 mol%, the βTCP phase was already stabilized even if the temperature was increased to 1,500°C. In short, when the precursor foam was transformed to TCP at 1,180°C, the shrinkage became permanent even of the temperature was increased to 1,500°C because no TCP was formed. This significant difference of the shrinkage between TCP and TCP foam could be observed from the differences of surface structure. The TCP foam and
-TCP foam still had pores at the inter granular region when compared to
TCP foam (Figure 2-6). In contrast, the surface of TCP foams was found
- 26 -
to be appreciably smooth and it was estimated that TCP foams were sintered completely by employing Mg. It was also observed that there is a relationship between the shrinkage and the porosity (Figure 2-7). Porosity of TCP foam was less than that of TCP foam, since TCP foam has larger shrinkage compare to TCP foam.
However, the compressive strength showed no significant differences between TCP and TCP foams, despite the observed differences in surface structure and porosity (Figure 2-8). Although the detailed mechanism of the mechanical property has not been clarified in the present study, difference in surface structure and porosity did not affect the compressive strength of foams between TCP and TCP foams. It was thought that a slight difference in surface structure and porosity was negligible and almost no effects on the mechanical property since these were highly porous structure. In fact, the TCP foam prepared in the present method showed high porosity approximately 90%. It is considered that highly porous structure in bone replacement plays an important role to promote faster bone regeneration in the bone defect.
- 27 -
2.5 Conclusion
The present study demonstrated that TCP foam could be prepared by the polyurethane foam replica method employing MgO as TCP stabilizer.
3 mol% or larger amount of Mg was required to stabilize TCP phase at 1,500C. The compressive strength and porosity of βTCP foam was similar regardless of the amount of added MgO. The compressive strength of the
TCP foam was approximately 65 kPa and the porosity was as high as 90%.
TCP foam fabricated in the present study is expected to be useful as bone replacement with fully interconnected porous structure.
- 28 -
CHAPTER 3
Fabrication of pure βTCP Foam Bone Replacement Based on Phase Transformation of TCP Foam
by Heat Treatment
Below α-β Transition Temperature
3.1 Introduction
As shown in Chapter 2, TCP foam with fully interconnected porous structure was prepared by the polyurethane foam replica method employing MgO as TCP stabilizer. In this method, α-β transition temperature became higher than 1,500C due to added MgO. And thus, TCP foam became available by sintering below α-β transition temperature.
Alternatively, TCP could be formed based on the phase transformation from αTCP. In other words, TCP is thermodynamically stable below α-β transition temperature [58]. Therefore αTCP is expected to convert to TCP if αTCP foam is heat-treated below 1,180C. In this Chapter, therefore, the feasibility of pure βTCP foam fabrication was investigated based on phase transformation of TCP foam by heat treatment below α-β transition temperature.
- 29 -
3.2 Materials and Methods 3.2.1 Sample Preparation
3.2.1.1 Preparation of αTCP Foam Precursor
CaCO3 and CaHPO4 (Wako) were used for preparing αTCP foam.
CaCO3 and CaHPO4 powders were measured so that the Ca/P molar ratio would be 1.5, and were mixed with 35 mL of 98% ethanol in a plastic bottle with agate balls in a milling machine (AV-1, Asahi Rika Co. LTD.) for 12 hours and dried in a drying oven (DO-300A, AS ONE Corp.) at 60C for at least 12 hours to remove the residual ethanol.
Polyurethane foam (HR-20D, Bridgestone Corp.) with an average pore size of about 500 µm in diameter was cut into square 20×20×20 mm in size, and used as a template for αTCP foam fabrication. Prepared powder mixture was added to 5wt polyvinyl alcohol (Ishizu Pharmaceutical Com.
Ltd.) aqueous solution at a powder/liquid ratio of 8 g/10 mL to make the slurry. The polyurethane foams were immersed in the prepared slurry and the excess slurry was removed by squeezing. The slurry coated polyurethane foams were then dried in a drying oven at 60C for at least 12 hours, followed by sintering in a programmable electric furnace (SC-2035D, Motoyama). The coated foams were heated at a rate of 1C/min from room temperature to 400C to burn out the polyurethane foam, and then 5C/min from 400C to 1,500C. The foams were kept at 1,500C for 5 hours and allowed to cool down inside the furnace to room
- 30 -
temperature.
3.2.1.2 Heat Treatment of αTCP Foam
The TCP foams were placed to another programmable electric furnace (KDG-70, Denken Co. LTD., Kyoto, Japan). The TCP foams were heated at a rate of 15C/min from room temperature to 600C, 700C, 800C, 900C, 1,000C and 1,100C and kept for a prescribed period up to 300 hours.
3.2.2 Characterization
3.2.2.1 Macropore Structure Observation
Macropore structure of the obtained samples was observed under light microscope in the same manner as described in Chapter 2.
3.2.2.2 Linear Shrinkage Measurement
Linear shrinkage of the obtained samples was measured in the same manner as described in Chapter 2.
3.2.2.3 Porosity Measurement
The porosity of the obtained samples was calculated in the same manner as described in Chapter 2.
- 31 -
3.2.2.4 XRD Analysis
For compositional analysis, the samples were ground into fine powders and were characterized by XRD in the same manner as described in Chapter 2.
3.2.2.5 Microstructure Observation
Surface microstructure of the obtained samples was observed by SEM in the same manner as described in Chapter 2.
3.2.2.6 Mechanical Strength Measurement
Mechanical strength of samples was evaluated in terms of compressive strength in the same manner as described in Chapter 2. Each compressive strength mean value with SD was calculated from at least 13 samples.
3.3 Results
3.3.1 Macropore Structure, Linear Shrinkage and Porosity
Figure 3-1 shows the magnified views of TCP foam before and after heat treatment at different temperature for 300 hours under an optical microscope. As shown in these photographs, TCP foam showed the same interconnecting porous structures before and after heat treatment. The size of the pore was approximately 380 µm and the linear shrinkage of the
TCP foams before and after heat treatment were the same, approximately
- 32 -
24. Moreover, no significant difference was observed with respect to porosity of TCP foams before and after heat treatment as shown in Table 3-1 (approximately 93).
Figure 3-1 Photographs of TCP foams (a) before and after heat treatment at (b) 600C, (c) 700C, (d) 800C, (e) 900C, (f) 1,000C and (g) 1,100C for 300 hours.
- 33 -
Table 3-1 Porosity of TCP foams before and after heat treatment at different temperature for 300 hours.
Heat treatment temperature (ºC) Porosity (%)
* 92.7±0.7
600 92.4±0.7
700 93.1±0.6
800 93.0±0.6
900 92.8±0.4
1,000 92.8±0.6
1,100 92.9±0.7
Asterisks (*) represent αTCP foam precursor.
3.3.2 Crystal Phase
Figure 3-2 summarizes the powder XRD patterns of the TCP foams before and after heat treatment at different temperature for the prescribed periods (50, 100, 150, 200, 250 and 300 hours). TCP foam converted to
TCP foam with time when heat treatment at 700C, 800C, 900C and 1,000C. In the case of heat treatment at 600C and 1,100C, no phase transformation was observed.
- 34 -
- 35 -
Figure 3-2 XRD patterns of TCP foam before and after heat treatment at (a) 600ºC, (b) 700ºC, (c) 800ºC, (d) 900ºC, (e) 1,000ºC and (f) 1,100 ºC.
(Open circles; TCP, closed circles; TCP)
Figure 3-3 shows the isothermal transformation curves for TCP to
TCP. For complete conversion of TCP foam to TCP foam, the required heat treatments were as follows: 800C over 150 hours, 900ºC over 100 hours and 1,000ºC for 300 hours. In other words, conversion to TCP was fastest at 900C. At 600ºC and 1,100ºC, no conversion of TCP foam was observed.
- 36 -
Figure 3-3 Isothermal transformation curves for TCP to TCP when
TCP foams were heat-treated at 600C, 700C, 800C, 900C, 1,000C and 1,100C for various periods.
3.3.3 Microstructure
Figure 3-4 shows the SEM images of the surfaces of TCP foam and
TCP foams obtained by heat treatment at different temperatures (800C, 900C, 1,000C) for 300 hours. Also, the SEM images of the surfaces of the TCP foams obtained shortest time at these temperatures were shown for comparison. As can be seen from these images, surface of TCP foams were found to be different from that of TCP foam precursor. The surface
- 37 -
structure of TCP foam had pores compared to that of TCP foam and the surface structure.
Figure 3-4 SEM images of (a) TCP foam precursor and TCP foams obtained by heat treatment at (b) 800C for 150 hours, (c) 800C for 300 hours, (d) 900C for 100 hours, (c) 900C for 300 hours and (f) 1,000C for 300 hours.
- 38 -
3.3.4 Compressive Strength
Figure 3-5 shows the compressive strength of the TCP foam and
TCP foams obtained by heat treatment at different temperatures (800C, 900C, 1,000C) for 300 hours. Also, compressive strength of TCP foam obtained at shortest time at these temperatures was shown for comparison.
The compressive strength of the TCP foam obtained by heat treatment was significantly lower than that of TCP foam except for βTCP foam obtained by heat treatment at 1,000ºC for 300 hours.
Figure 3-5 Compressive strength of TCP foam precursors and TCP foams obtained by heat treatment at 800C for 150 hours and 300 hours, 900C for 100 hours and 300 hours and 1,000C for 300 hours.
* p < 0.05, compared with αTCP foam precursor.
- 39 -
3.4 Discussion
In the present study, TCP foam was successfully prepared according to the following two-stage process: (1) fabrication of the TCP foam and (2) phase transformation of TCP foam to βTCP foam by heat treatment below α-β transition temperature. As mentioned in the previous Chapter,
TCP is stable at high temperature, thus TCP foam can be prepared by polyurethane foam replica method. Fortunately it was found that the sintered TCP converted to βTCP when heat-treated below - transition temperature. Therefore αTCP foam can be used as a precursor for the TCP foam fabrication.
As shown in Figure 3-2, pure TCP foam was obtained by heating the αTCP foam at 800°C, 900°C and 1,000°C whereas no transformation was observed when αTCP foam was heated at 600°C and 1,100°C. When αTCP foam was heated at 600°C, atomic diffusion necessary to convert to βTCP might not occur. When αTCP foam precursor was heated at 1,100°C, driving force for conversion to βTCP might not enough since the treatment temperature was near α-β transition temperature. Based on these results, suitable temperature for phase transformation from αTCP to βTCP was around 900°C since the rate of conversion to pure βTCP was the fastest when αTCP foam precursor was heated at 900°C.
Both αTCP foam and βTCP foam showed almost the same structure to polyurethane foam template (Figure 3-1). Namely, fully interconnected
- 40 -
porous structure of αTCP foam could be maintained even after heat treatment at different temperature for a long period. In other words, pure βTCP foam with similar structure to cancellous bone was fabricated in the present method. However, the surface structure and the mechanical property between TCP foam and the TCP foam were significantly different. The surface of TCP foam obtained after heat treatment was comparatively rougher than that of the TCP foam precursor. It was thought the reason behind the different surface of αTCP foam and βTCP foam was due to the different density of αTCP and βTCP. Since density of βTCP was larger than that of αTCP, surface structure was changed by phase transformation of TCP to βTCP.
Moreover, the difference of mechanical property could have been affected by phase transformation of αTCP to βTCP. The TCP foam obtained by heat treatment at 800°C and 900°C showed lower compressive strength than αTCP foam precursor. In contrast, βTCP foam obtained by heat treatment at 1,000°C showed similar compressive strength to αTCP foam precursor (Figure 3-5). It was thought that micro crack occurred by phase transformation, and this crack was repaired by heat treatment at relatively high temperature, 1,000°C. Therefore, TCP foam could be obtained without decreasing mechanical property when heat-treated at 1,000°C for 300 hours.
- 41 -
3.5 Conclusion
Pure TCP foam was successfully prepared based on phase transformation of sintered TCP foam by heat treatment below α-β transition temperature. When TCP foam was heated at 600ºC and 1,100ºC, crystal phase transformation from TCP to TCP did not occur even when treated for up to 300 hours. In contrast, the phase transformation from
TCP to TCP was observed when heated at temperature ranging from 700ºC to 1,000ºC. Above all, pure TCP foam obtained by heating αTCP foam precursor at 1,000ºC showed good mechanical property and interconnected porous structure useful for cell migration and bone tissue penetration even though it took 300 hours to obtain. Pure TCP foam fabricated in the present study is expected to be useful for bone replacement which can be rapidly replaced to new bone.
- 42 -
CHAPTER 4
In Vivo Evaluation of βTCP Foam Bone Replacement Using Rabbits
4.1 Introduction
As stated in Chapter 2, TCP foam was successfully prepared by the so-called polyurethane foam replica method employing MgO as TCP stabilizer. Also, pure TCP foam was successfully prepared based on phase transformation of αTCP foam by heat treatment below α-β transition temperature as stated in Chapter 3.
In this Chapter, tissue response to βTCP foams was evaluated by implanting βTCP foams in the bone defect of rabbits, and evaluated using micro-CT scan analysis and histological staining.
4.2 Materials and Methods 4.2.1 βTCP Foam Preparation
Four kinds of cylindrical foams were prepared to that they will be 7 mm in diameter and 10 mm in length. Mg-containing βTCP foams (Mg-βTCP foam) were prepared in the same manner as described in materials and methods in Chapter 2. Mg-βTCP foams which contained 3 mol% Mg were used in this study. βTCP foams obtained after heat treatment (HT-βTCP
- 43 -
foam) were prepared in the same manner as described in materials and methods in Chapter 3. HT-βTCP foams obtained by heat treatment at 1,000C for 300 hours were used in this study. αTCP foam and HAp foam were also used as controls. αTCP foam were prepared in the same manner as described in materials and methods in Chapter 3. To prepare the HAp foam, commercial HAp powder (HAP-200, Taihei Chemical Industrial Co.
Ltd., Osaka, Japan) were used. HAp foams were prepared in the same manner as αTCP foam preparation except for sintering temperature, 1,400C. This is because HAp would be decomposed if sintered at 1,500C.
The obtained foams were used for the following animal experiment after sterilization using an autoclave (121C, 20 minutes).
4.2.2 Surgical Procedure
All animal experiments done in this study were conducted under the Kyushu University Guidelines for Animal Experimentation. 17 weeks old male Japanese White rabbits, weighing from 3.0 to 3.5 kg, were used in this study. The rabbits were anesthetized with an intramuscular injection of ketamine (10 mg/kg body weight) and xylazine (2 mg/kg body weight) before surgery. To prevent infection, a subcutaneous injection of gentamicin sulfate (4 mg/kg body weight) was used just before surgery.
Under sterile conditions, lidocaine was used locally to make the surgical
- 44 -
field free from blood. The distal metaphysic and internal condyle of both femur were exposed through a 4 cm long lateral transverse skin incision and the thigh muscles were divided. The critical size defect, 7 mm in diameter and 10 mm depth, was created in the lateral cortex just proximal to the epiphyseal plate using a trephine bur [57, 58]. The orientation of the defect was perpendicular to the sagittal axis of the femur. The defect was irrigated with saline, each test implant was carefully inserted into the hole manually, and the wound was closed layer by layer. Figure 4-1 shows the surgical procedure in more detail. Experimental animals used for this study were sacrificed by an overdose of ketamine at 4, 12, 20 weeks after the operation.
- 45 -
Figure 4-1 Each step in the surgical procedure: (a) a small incision is made in skin part of the knee joint, (b) ligaments and muscles separation, (c) exposure of femur, (d) drilling the bone, (e) implantation of the foam and (f) sutured of the wound.
4.2.3 Micro-CT Scan Analysis
The distal portion of the femur was dissected from the sacrificed
- 46 -
animals and X-ray photographs were taken using a micro-CT scanner (Skyscan1071, Skyscan, Antwerp, Belgium). Samples were scanned with scanning direction perpendicular to the sagital aspect of bone.
High-resolution scanning, with an in-plane pixel size and thickness of 18 µm, was performed. The micro-CT scanners built-in software was used to make a 3-D reconstruction from the set of scans.
4.2.4 Histological Examination
Undecalcified sections were used for the histological examination. At 20 weeks after implantation, rabbit bone was fixed with a fixative solution 10% formaldehyde in 0.1 mol/L phosphate buffer in pH 7.4 for 1 day. Each specimen was dehydrated through a graded series of ethanol solutions and then embedded in acrylic resin. Sections of 150 µm in thickness were prepared and stained with hematoxylin and eosin.
4.3 Results
4.3.1 Micro-CT Images After Implantation of αTCP Foam
Figure 4-2 shows the typical micro-CT images after implantation of αTCP foam. After 4 weeks of implantation, αTCP foam was almost dissolved inside the bone defect. After 12 weeks of implantation, αTCP foam was fully dissolved without reconstructing the bone defect.
- 47 -
Figure 4-2 Micro-CT images of the operated portion of the rabbit femur (a) 4 weeks, (b) 12 weeks and (c) 20 weeks after implantation of TCP foams.
4.3.2 Micro-CT Images After Implantation of HAp Foam
Figure 4-3 shows the typical micro-CT images after implantation of HAp foam. After 4 weeks of implantation, still no dissolution of HAp foam was confirmed. After 12 weeks of implantation, no dissolution of HAp foam was confirmed. At this stage, newly formed bone was observed around the HAp foam. Moreover, bone formation inside the pores was
- 48 -
observed as indicated by the arrows. After 20 weeks of implantation, bone defect was healed, keeping HAp foam as implanted.
Figure 4-3 Micro-CT images of the operated portion of the rabbit femur (a) 4 weeks, (b) 12 weeks and (c) 20 weeks after implantation of HAp foams.
4.3.3 Micro-CT Images After Implantation of Mg-βTCP Foam
Figure 4-4 shows the typical micro-CT images after implantation of Mg-βTCP foam. After 4 weeks of implantation, Mg-βTCP foam remained as implanted. After 12 weeks of implantation, Mg-βTCP foam still
- 49 -
remained as implanted, but newly formed bone was observed. Moreover, bone formation inside the pores was observed as indicated by the arrows.
After 20 weeks of implantation, Mg-βTCP foam remained and bone defect was healed. At this stage, some Mg-βTCP foam were dissolved.
Figure 4-4 Micro-CT images of the operated portion of the rabbit femur (a) 4 weeks, (b) 12 weeks and (c) 20 weeks after implantation of Mg-βTCP foams.
- 50 -
4.3.4 Micro-CT Images After Implantation of HT-βTCP Foam
Figure 4-5 shows the typical micro-CT images after implantation of HT-βTCP foam. After 4 weeks of implantation, although little HT-βTCP foam was dissolved, it was almost intact. After 12 weeks of implantation, some HT-βTCP foam remained and bone formation inside the pores was observed as indicated by the arrows. After 20 weeks of implantation, HT-βTCP foam was almost dissolved and bone defect was healed.
Figure 4-5 Micro-CT images of the operated portion of the rabbit femur (a) 4 weeks, (b) 12 weeks and (c) 20 weeks after implantation of HT-βTCP foams.
- 51 -
4.3.5 Histological Appearances
Figure 4-6 shows the typical histological pictures of the foams when implanted in rabbit femur for 20 weeks. The newly formed bone after implantation of αTCP foam was restricted to the edge of the defects and most of the bone defect was occupied with non-osseous tissue. In contrast, new bone was formed and bone defect was healed with osseous tissue when treated with HAp foam, Mg-βTCP foam and HT-βTCP foam. HAp foam and Mg-βTCP foam surfaces were surrounded by bone tissue and strut of foams were fully integrated with newly formed bone. In contrast, residual strut of the foam could not be observed after implantation of HT-βTCP foam and the bone defect was filled with bone tissue similar to the normal femur bone.
- 52 -
Figure 4-6 Typical histological appearances at 20 weeks after implantation of (a) αTCP foam, (b) HAp foam, (c) Mg-βTCP foam and (d) HT-βTCP foam. Sectioned samples were stained with hematoxylin and eosin.
Asterisks (*) represent the strut of the foam.
- 53 -
4.4 Discussion
Results obtained in this study demonstrated clearly that both βTCP foams showed good osteoconductivity and bioresorbability. In other words, dissolution of the βTCP foam and bone formation occurred simultaneously in bone defect of rabbit. As stated in Chapter 1, bone formation and bioresorbability should be balanced for the ideal bone replacement. After 12 weeks of implantation, newly formed bone was observed in the pores of respective types of βTCP foam. Bone formation inside the pore was also observed in the case of HAp foam. HAp is known to show good osteoconductivity. Therefore, βTCP foams prepared in this study are considered to also have good osteoconductivity.
Bioresorbability may be a more difficult factor for bone replacement.
HAp is known to show almost no dissolution in bone. In the case of HAp foam as well, no bioresorbability was observed in bone defect of rabbit. In contrast, solubility of αTCP is high. Therefore αTCP powder has been used as a powder component for apatite cements. Although, specific surface area is significantly smaller in the case of αTCP foam, αTCP foam also showed too high bioresorbability as bone replacement in bone defect of rabbit. In other words, αTCP foam was dissolved completely 12 weeks after implantation without bone formation. Results of HAp foam and αTCP foam confirmed that balance of dissolution and bone formation is the key for ideal bone replacement.
- 54 -
Fortunately, βTCP is known to have suitable bioresorbability as bone replacement. Therefore, βTCP foams prepared in this study was also expected to show proper bioresorbability. As expected, it was confirmed that replacement of βTCP foam to bone, or the dissolution of βTCP foam and new bone formation occurred simultaneously in rabbit bone for both Mg-βTCP foam and HT-βTCP foam (Figure 4-4, 4-5). It should be noted that bioresorbability of Mg-βTCP foam and HT-βTCP foam were different.
After 12 weeks, no indication of bioresorbability was observed in the case of Mg-βTCP foam, whereas some bioresorption was observed in the case of HT-βTCP foam. After 20 weeks of implantation, HT-βTCP foam was almost dissolved and replaced to new bone, whereas some structure of Mg-βTCP foam still remained in rabbit bone. It was reported that the solubility of βTCP decreases with the Mg incorporation into the βTCP structure, since substitution of Mg leads to stabilization of original βTCP structure [59, 60]. Similarly, bioresorbability of Mg-βTCP foam was thought to be decreased in bone defect of rabbit. In other words, bioresorbability of βTCP foam could be controlled by the added Mg into the βTCP structure.
- 55 -
4.5 Conclusion
The results of this in vivo study demonstrated that βTCP foams showed good osteoconductivity and proper bioresorbability. The bone defect was healed and HT-βTCP foam was replaced to new bone after 20 weeks of implantation. The bone defect was also healed after 20 weeks implantation in the case of Mg-βTCP foam, although some Mg-βTCP foam still remained undissolved in the bone at this stage. These TCP foams are promising candidates for the ideal bone replacement.
- 56 -
CHAPTER 5 Summary
βTCP foam is thought to be an ideal bone replacement because (1) it would be replaced to new bone due to balanced bioresorbability and bone formation and (2) it has fully interconnected porous structure that allows tissue ingrowth and nourishment supply to bone cells. However, TCP foam has not been fabricated using the polyurethane foam replica method up to date due to insufficient sintering reaction when sintered below -
transition temperature. In this study, new methods was proposed to fabricated βTCP foam. One is the use of β phase stabilizer and the other is the phase transformation from αTCP to βTCP based on heat treatment.
In Chapter 2, TCP foam was found to be fabricated by employing MgO as TCP stabilizer. 3 mol% or larger amount of Mg was the key to stabilize TCP phase when sintered at 1,500C. The compressive strength of the TCP foam fabricated using MgO stabilizer was similar regardless of the amount of added Mg.
In Chapter 3, pure TCP foam was prepared based on phase transformation of sintered TCP foam by heat treatment below α-β transition temperature. The heat treatment at 800°C to 1,000°C resulted in complete phase transformation from αTCP to TCP. Heat treatment at 1,000ºC for 300 hours resulted in highest compressive strength or the same
- 57 -
compressive strength with that of TCP foam.
In Chapter 4, osteoconductivity and bioresorbability was evaluated using experimental animals, rabbits. Micro-CT scan analysis and histological analysis demonstrated that dissolution and replacement to newly formed bone occurred simultaneously in rabbit bone for both Mg-βTCP foam and βTCP foam fabricated by heat treatment (HT-βTCP foam). Especially, HT-βTCP foam showed proper osteoconductivity and bioresorbability in the condition employed in this animal study. HT-βTCP foam replaced to new bone after 20 weeks of implantation. Mg-βTCP foam also showed bioresorbability and thus, the bone defect was healed after 20 weeks implantation. However some Mg-βTCP foam still remained even at 20 weeks. In other words, Mg stabilizer is also useful for the regulation of bioresorbability.
In conclusion, the results of the present study demonstrated that TCP foam with fully interconnected porous structure can be fabricated in two methods. One is using Mg as β phase stabilizer, and the other is heat treatment of the αTCP foam. The βTCP foams thus prepared could be ideal bone replacements which can be replaced to new bone.
- 58 -
References
[1] Moore WR, Graves SE, Bain GI. Synthetic bone graft substitutes. ANZ J Surg 2001; 71: 354-361.
[2] Damien CJ, Parsons CJ. Bone graft and bone graft substitutes: a review of current technology and applications. J appli Biomater 1991; 2:
187-208.
[3] Younger EM, Chapman MW. Morbidity at bone graft donor sites. J Orthop Trauma 1989; 3: 192-195.
[4] Khan SN, Cammisa FP, Sandbu HS, Diwan AD, Girardi FP, Lane JM.
The Biology of bone grafting. J Am Acad Orthop Surg 2005; 13: 77-86.
[5] Zou S, Dodd RY, Stramer SL, Strong DM. Probability of viremia with HBV, HCV, HIV and HTLV among tissue donors in the United States.
N Engl J Med 2004; 351: 751-759.
[6] Mroz TE, Joyce MJ, Lieberman IH, Steinmetz MP, Benzel EC, Wang JC. The use of allograft bone in spine surgery: is it safe?. Spine J 2009;
9: 303-308.
[7] Mandel TE. Fetal islet xenotransplantation in rodents and primates. J Mol Med 1999; 77: 155-160
[8] Rayat GR, Johnson ZA, Beilke JN, Korbutt GS, Rajotte RV, Gill RG.
The degree of phylogenetic disparity of islet grafts dictates the reliance on indirect CD4 T-Cell antigen recognition for rejection. Diabetes 2003; 52: 1433-1440.
[9] LeGeros RZ. Properties of osteoconductive biomaterials: Calcium phosphates. Clin Orthop Relat Res 2002; 395: 81-98.
[10] Yamamuro T, Shikata J, Kakutani Y, Yoshii S, Kitsugi T, Ono K. Novel methods for clinical applications of bioactive ceramics. Ann NY Acad Sci 1988; 523: 107-114.
- 59 -
[11] Bucholz RW, Carlton A, Holmes RE. Hydroxyapatite and tricalcium phosphate bone graft substitutes. Orthop Clin North Am 1987; 18:
323-334.
[12] Gazdag AR, Lane JM, Glaser D, Forster RA. Alternatives to autogenous bone graft: efficacy and indications. J Am Acad Orthop Surg 1995; 3: 1-8.
[13] Aoki H, In: Aoki H editor. Science and medical applications of hydroxyapatite. Tokyo: Takayama Press System Center Co; 1991. pp.
1-10.
[14] Suchanek W, Yoshimura M. Processing and properties of hydroxyapatite-based biomaterials for use as hard tissue replacement implants. J Mater Res 1998; 13: 94-117.
[15] Ioku K, Kamitakahara M. Hydroxyapatite ceramics for medical application prepared by hydrothemal method. Phosphorus Res Bull 2009; 23: 25-30.
[16] LeGeros RZ. Biodegration and bioresorption of calcium phosphate ceramics. Clin Mater 1993; 14: 65-88.
[17] Hupp JR, Mckenna SJ. Use of porous hydroxyapatite blocks for augmentation of atrophic mandibles. J Oral Maxillofac Surg 1988; 46:
538-545.
[18] Morikawa S. Comparative study on β-tricalcium phosphate and hydroxyapatite as bioactive artificial bone fillers. Tokyo Jikeikai Med J 2000; 115: 193-207.
[19] Jarcho M. Calcium phosphate ceramics as hard tissue prosthetics. Clin Orthop Relat Res 1981; 157: 259-278.
[20] Klein CPAT, Driessen AA, van den Hooff A, deGroot K.
Biodegradation behavior of various calcium phosphate materials in bone tissue. J Biomed Mater Res 1983; 17: 769-784.
[21] Kohri M, Miki K, Waite DE, Nakajima H, Okabe T. In vitro stability of biphasic calcium phosphate ceramics. Biomater 1993; 14: 299-304.
- 60 -
[22] Kivrak N, Taş Ac. Synthesis of calcium hydroxyapatite-tricalcium phosphate (HA-TCP) composite bioceramic powders and their sintering behavior. J Am Ceram Soc 1998; 81: 2245-2252.
[23] Elliot JC, In: Elliot JC editor. Structure and chemistry of the apatites and other calcium orthophosphates. 18thed. Amsterdam: Elsevier; 1994.
pp. 34-50.
[24] Tung MS, In: Z Amjad editor. Calcium phosphates in biological and industrial systems. Norwel: Kluwer Academic Publishers; 1998. pp.
1–20.
[25] Monma H, Kanazawa T. The hydration of α-tricalcium phosphate.
Yogyo-Kyokai-Shi 1976; 84: 209-213.
[26] TenHuisen KS, Brown PW. Formation of calcium-deficient hydroxyapatite from α-tricalcium phosphate. Biomater 1998; 19:
2209-2217.
[27] Yokozeki H, Hayashi T, Nakagawa T, Kurosawa H, Shibuya K, Ioku K.
Influence of surface microstructure on the reaction of the active ceramics in vivo. J Mater Sci Mater Med 1998; 9: 381-384.
[28] Klein CPAT, Wolke JGC, deGroot K, In: Hench LL, Wilson J, editor.
An introduction to bioceramics. London: World Scientific Publishing Co Pte LTd; 1993. pp. 199-221.
[29] Kotani S, Fujita Y, Kitsugi T, Nakamura T, Yamamuro T, Ohtsuki C, Kokubo T. Bone bonding mechanism of β-tricalcium phosphate. J Biomed Mater Res 1991; 25: 1303-1315.
[30] Ozawa M. Experimental study on bone conductivity and absorbability of the pure β-TCP. J Jpn Soc Biomater 1995; 13: 167-175.
[31] Matsumoto T. Development and practical use of super-porous ceramics bone graft substitute. Ceram Jpn 2011; 46: 757-760.