A New Method with Variable Injection Parameters in Contrast-Enhanced CT: A Phantom Study for Evaluating an Aortic Peak Enhancement
寺 澤 和 晶
鈴鹿医療科学大学大学院 医療科学研究科 医療科学専攻 博士(医療科学)の学位論文
指導教員 煎本 正博 客員教授 奥田 逸子 客員教授
2016 年 3 月
博 士 論 文 審 査 委 員
主査 柴田 幸一 教授
副査 川野 誠 教授
副査 松浦 佳苗 准教授
副査 鎮西 康雄 教授
副査 山本 晧二 教授
1
A New Method with Variable Injection Parameters in Contrast-Enhanced CT: A Phantom Study for Evaluating an Aortic Peak Enhancement
医療科学専攻 寺澤 和晶
(指導教員 : 煎本 正博 客員教授、 奥田 逸子 客員教授)
【背 景】一般に、CT 検査における造影は、Standard uniphasic injection(Single-injection method:
SIM)による投与で、注入速度を示す iodine administration rate(mgI/s)と注入時間(s)の 2 つの パラメータにより調整する。したがって、抽出能を向上させるためには、ヨード使用量を増加させる か、または注入時間を短くすることにより注入速度を上昇させる必要がある。また、SIM は注入速 度が一定なため、画一的な造影効果しか得られない問題がある。
そこで、高い造影効果を得るためには、ヨード使用量を増加させる、または注入時間を短くして 注入速度を上昇させる必要がある。そのため、SIMは注入パラメータを一定にした条件下でTime- enhancement curve(TEC)のPeak enhancementの特性を任意に調整することができない。すなわ ち、SIMのLimitationといえる。
【目 的】本研究の目的は、TECのPeak enhancementの特性を調整する新たな注入パラメータを追 加することにより、ヨード負荷を変えずに描出能を向上させる新しい造影法を提案することである。
SIMと同一の条件下で操作できる注入パラメータは注入速度である。これを造影剤の注入中に可 変させた場合、任意にTECのPeak enhancementの特性を調整でき、実組織の質的診断検査や 3D-CTAなど検査目的に応じた最適なTECを作成できる可能性がある。造影法を理論的にアプロ ーチする先行研究で、Baeらは注入速度を段階的に変化させるMultiphasic-injection method
(MIM)を考案し、Peak enhancementの特性を調整した。また、Utsunomiyaらは段階的に造影剤と 生理食塩水を混合させて注入するプロトコールにて心臓の機能解析を含めた3D-CTAに適した 造影法とした。しかし、TECが段階的に大きく変化するため、タイミングによってはEnhancementが 大きく変動することが懸念された。
この問題は、注入速度を連続的に変化させることで改善できる。そこで本研究では、注入速度を 可変させるパラメータをVariation factor(VF)と定義し、これを用いて注入速度を連続的に変化さ せるVariable-injection method(VIM)と称する造影法を考案した。そして、従来法であるSIMと同 一の総ヨード負荷量および注入時間で、VFを用いたVIMのPeak enhancementの特性を解析する ことにより、その有用性を評価することとした。
【方 法】TEC phantomによりTECを取得した。造影剤の到達時間はEnhancementが10HU以上に なった時点から2秒前とし、3回一組に3つのプロトコールの実験を行った。また、CT値(HU)はス キャン位置のホースの中心部で断面積の80%程度のRegion of interest(ROI)にて測定し、造影 剤注入前のCT値を減じた。そして、プロトコールをマスクした状態で1名の診療放射線技師
(Tsukimata T)が計測した。
① TEC phantomによるSIMの解析
注入速度を一定にしたSIMにおいて注入時間を変化させTECが形成される過程を検証するた めに、ヨード使用量を12000mgI、18000mgI および24000mgI、注入速度を720mgI/s として比
DH13103 寺澤和晶
2
較した(造影剤用量が50mL、75mLおよび100mLで、injection flow rateはすべて3mL/s)。それ ぞれをプロトコール1(ⅰ)、プロトコール1(ⅱ)およびプロトコール1(ⅲ)とした。そして、TECを解 析するポイントをPeak enhancement、Time to peak enhancement、Contrast medium arrival timeとした。また、Time to peak enhancementからContrast medium arrival timeを減じた時間を Peak timeと定めて解析に加えた。
② TEC phantom によるPeak enhancement特性の検討
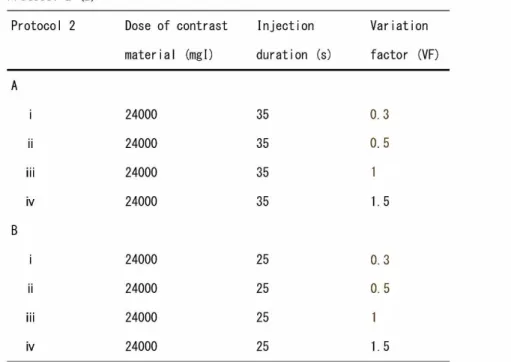
VFの違いによるVIMおよびSIMの関係を評価するために、VFを0.3, 0.5, 1.0, 1.5 と変化させ TECを取得した。すべてヨード使用量は24000mgIとし、造影剤用量は100mLとした。注入時間 は35秒で、これをプロトコール2(A)[ⅰ-ⅳ]とした。次に、VIMにおける注入時間の変化を評価 するために、同様にVFを0.3, 0.5, 1.0, 1.5 と変化させ25秒注入のTECを取得した。これをプロ トコール2(B)[ⅰ-ⅳ]とした。すべてヨード使用量は24000mgIとした(造影剤用量:100mL)。ま た、方法②の解析ポイントに加えPeak enhancementの80%をEnhancementが持続する時間と 定め、Enhancement timeとして比較した。
【結 果】
① Peak enhancementおよびTime to peak enhancement(s)の関係を求めると、プロトコール1(ⅰ)
は165.7±6.5(HU)、25.3±1.2秒、1(ⅱ)は207.7±6.5(HU)、34.7±1.2秒、1(ⅲ)は229.7±
5.5(HU)、42.7±1.2秒であった。それぞれのPeak timeを求めると、プロトコール1(ⅰ)は15.3、
1(ⅱ)は24.7、1(ⅲ)は 32.7秒であった。Peak timeを比較すると、プロトコール1(ⅱ、ⅲ) は注入 時間とほぼ等しくなったが、プロトコール1(ⅰ)は1.4秒短くなった。
② VFを変化させたVIMの関係を比較すると、プロトコール2(A)[ⅰ-ⅳ]および2(B)[ⅰ-ⅳ]ともに VFが1.0より低い場合、Time to peak enhancementがSIMより早くなった。一方、VFが1.0より高 い場合はTime to peak enhancementがSIMより遅延した。TECはVFが0.3および1.5のときPeak enhancementの前後で急激な変化を示し、Peak enhancementはSIMより上昇した(P<0.05)。
一方、VFが0.5のときはSIMより高いEnhancementは得られなかったが、Peak enhancementを中 心にTECに急激な変化がなく、Enhancementを持続するような安定した形状になった。
【考 察】VFが0.3および0.5のではVIMはSIMに比べ注入初期に注入速度が上昇することから、動 脈系と静脈系および動脈系と実組織Enhancementとのコントラストを向上できると考えられた。ま た、SIMよりContrast medium arrival time が早期になることから、実質臓器および静脈系との時 間的分離を向上させると考えられた。
【結 論】注入時間を変化させることや、ヨード負荷を増加させることなくTECのカスタマイズを行うこ とで質的診断検査における動脈系と実組織の時間的分離による描出能向上および形状解析に よる形態診断の精度向上を可能にした。その特性の解析により①、②が臨床応用法として有用と 示唆された。
① VF=0.3によるVIMは肝質的診断検査等のコントラストの改善が期待できる 。
② VF=0.5によるVIMはSIMに比べ3D-CTAにおけるより正確な形状解析が可能である。
*なお、本論文の要旨は北米放射線学会(RSNA)2015にてCertificate of Merit賞が授与された。
DH13103 寺澤和晶
3 目 次
学位審査用論文の要旨(和文) ・・・・・・・・・・・・・・・・・・・・・・・・1
FULL TITLE(TITLE, ALL AUTHORS, ABSTRACT, KEYWORDS) ・・・・・・・・・・・・・4 本 文
第一章 INTRODUCTION ・・・・・・・・・・・・・・・・・・・・・・・・・・・5 第二章 MATERIALS AND METHODS
2.1 Overview of the VIM with VFs ・・・・・・・・・・・・・・・・・・・・6 2.2 CT scanner and Phantom ・・・・・・・・・・・・・・・・・・・・・・・7 2.3 Settings and Methods of Measurement of the TEC Phantom ・・・・・・・8
2.4 Methods of Assessments
2.4.1 Analysis of the SIM ・・・・・・・・・・・・・・・・・・・・・・8 2.4.2 Evaluation of the Peak Enhancement ・・・・・・・・・・・・・・・9
第三章 RESULTS
3.1 TECs with the SIM among Different Injection Durations ・・・・・・・10 3.2 TECs with Varying VFs and Injection Durations ・・・・・・・・・・・11 第四章 DISCUSSION ・・・・・・・・・・・・・・・・・・・・・・・・・・・14
第五章 CONCLUSION ・・・・・・・・・・・・・・・・・・・・・・・・・・・17
Conflict of Interest ・・・・・・・・・・・・・・・・・・・・・・・・・・17 REFERENCES ・・・・・・・・・・・・・・・・・・・・・・・・・・・・・・・・18 研究業績リスト
著 書 ・・・・・・・・・・・・・・・・・・・・・・・・・・・・・・・・・20 論 文 ・・・・・・・・・・・・・・・・・・・・・・・・・・・・・・・・・20 学会発表 ・・・・・・・・・・・・・・・・・・・・・・・・・・・・・・・・21 その他1(執筆) ・・・・・・・・・・・・・・・・・・・・・・・・・・・・22 その他2(講演) ・・・・・・・・・・・・・・・・・・・・・・・・・・・・23 その他3(学会座長) ・・・・・・・・・・・・・・・・・・・・・・・・・・25 その他4(認定資格) ・・・・・・・・・・・・・・・・・・・・・・・・・・25
4 TITLE
A New Method with Variable Injection Parameters in Contrast-Enhanced CT: A Phantom Study for Evaluating an Aortic Peak Enhancement
ALL AUTHORS
KAZUAKI TERASAWA (R.T.,M.S.) 1 ) , 2 ), ATSUNORI MARUYAMA (M.D.) 3 ), TOMOHIRO TSUKIMATA (R.T.) 2)
KAZUAKI TERASAWA (R.T.,M.S.)
1)Graduate School of Health Science, Suzuka University of Medical Science, 1001-1, Kishioka, Suzuka-shi, Mie 510-0293, Japan.
2)Central Radiology Department, Nagano Red Cross Hospital, 5-22-1, Wakasato, Nagano-shi, Nagano 380-8582, Japan.Address correspondence to K.Terasawa.
E-mail: [email protected] Phone: 81-26-226-4131
Fax: 81-26-224-0782
ATSUNORI MARUYAMA (M.D.)
3)Department of Radiology, Nagano Red Cross Hospital, Nagano, Japan.
E-mail: [email protected]
TOMOHIRO TSUKIMATA (R.T.)
2)Central Radiology Department, Nagano Red Cross Hospital, Nagano, Japan.
E-mail: [email protected]
ABSTRACT
Contrast-enhanced CT employs a standard uniphasic single-injection method (SIM), wherein administration is based on two parameters: the iodine administration rate (mgI/s) and the injection duration (s). However, as the SIM uses a fixed iodine administration rate, only a uniform contrast enhancement can be achieved with this method. The iodine administration rate can be increased only by increasing the iodine dose or shortening the injection duration, and no arbitrary adjustments can be made to the peak enhancement characteristics of the time-enhancement curves (TECs) at the fixed injection parameters used in the SIM. To address this problem, we developed a variable- injection method (VIM) with a new parameter, the variation factor (VF), to adjust the TECs. A phantom study with the VIM indicated that arbitrary adjustments to the iodine administration rate could be made without changing the injection duration or increasing the iodine load. In our study, VFs of 0.3 and 0.5, which showed earlier achievement of peak enhancements, showed better temporal separation between arterial vasculature and parenchyma or the venous vasculature than that obtained with the SIM. The higher peak enhancement provided by the VF of 0.3 was also considered to improve the contrast in qualitative diagnostic examinations. A VF of 0.5 increased
5
the duration of the enhancement and was considered to produce stable enhancement of contrast in vascular investigations. The VF is now an essential parameter, and the VIM is useful as a reasonable contrast method that may contribute to both improved visualization and improvement in the accuracy of morphologic diagnosis.
KEYWORDS
Time enhancement curve (TEC); Variable injection method (VIM); Variation factor (VF); Contrast enhancement; Contrast material
1 INTRODUCTION
Contrast-enhanced computed tomography (CT) has been used for two main purposes, for observing differences in contrast between the arterial vasculature and parenchyma in qualitative diagnostic examinations of organs [1,2], and for generating a constant, high degree of arterial enhancement as in three-dimensional CT angiography (3D-CTA), a form of vascular investigation [3,4]. Prior to the introduction of helical CT in clinical practice, contrast methods involved the administration of a fixed dose of contrast material (mL) at a fixed injection rate (mL/s). The protocol employed in such methods was uniform across all examinations. However, the development of helical CT and the improved image quality and faster scanning afforded by this technique have facilitated studies on the optimization of contrast methods. These studies were aimed of making adjustments to contrast methodology in an effort to maximize its diagnostic performance, and investigators have begun to explore patient-related factors, such as the circulating blood volume, that govern iodine dosage. More specifically, adjustments based on each examinee’s physique have been investigated in such studies.
Predictions of the timing of contrast material arrival based on the circulatory dynamics have been used for making adjustments according to the examinee’s physique, and these adjustments may maximize the diagnostic performance while using the lowest iodine dose necessary for diagnosis.
The typical methods employed for predicting the disposition of contrast material include a compartmental model analysis described by Bae et al. [1,2] and computer simulations based on linear models described by Fleischmannet al. [3,4]. Simulations with use of a mechanical contrast material flow phantom can also be used for prediction [5]. Studies with use of these methods have led to the establishment of contrast-enhanced CT, which combines contrast methods or scanning methods to individualize the iodine dose (mgI) for each examinee with a fixed injection duration (s) [6-10].
Contrast enhancement for CT generally involves the standard uniphasic injection (single- injection method: SIM) protocol, in which adjustments are made with use of two parameters: the iodine administration rate (mgI/s), which represents the rate of injection, and the injection duration (s). Therefore, to improve contrast enhancement, it is necessary to increase the iodine administration rate by either increasing the iodine dose or by shortening the injection duration.
In a study by use of simulations, Bae et al. reported that a higher administration rate could
6
provide better temporal separation between the arterial and venous phases and the arterial and parenchymal phases of enhancement [2]. The resultant increase in the difference between the time to arterial peak enhancement and the time to parenchymal peak enhancement would yield better contrast. Similarly, a higher administration rate can also produce stable degrees of enhancement and improve the temporal separation between the arterial and venous phases in 3D-CTA.
In contrast, Murakamiet al. compared the scans obtained at 20, 30, and 40 s following the start of an injection by hepatic dynamic-CT with those obtained at an injection duration of 25 s, and they found that the scans obtained at 30 s were the best for detecting hypervascular tumors [11].
However, it was unclear whether the time to aortic peak enhancement obtained by the SIM was reflective of the greatest parenchymal contrast achieved in qualitative diagnostic examinations. The findings indicated that the peak enhancement in the time-enhancement curves (TECs) [1-5]
generated by the SIM might be suitable for examinations. However, because it is difficult to change the characteristics of the peak enhancement flexibly while maintaining constant injection parameters in the SIM, an optimized contrast method for diagnostic examinations is required.
In response to this need, a new contrast method that could improve visualization without changing the iodine load was developed and coupled a new injection parameter to allow adjustment of the characteristics of the peak enhancement in TECs.
The iodine administration rate is the injection parameter that can be operated under the same conditions as the SIM. If this parameter can be varied during the injection of contrast material, the characteristics of the peak enhancement in TECs can be appropriately adjusted and optimized, and TECs specific to the purposes of the examination, such as those for qualitative diagnostic examinations of parenchyma or 3D-CTA, can be generated and assessed. In a previous study that approached contrast methods logically, Baeet al. developed a multiphasic-injection method (MIM), which varied the iodine administration rate in a stepwise manner and adjusted the characteristics of the peak enhancement [12]. In addition, Utsunomiya et al. developed a protocol involving stepwise injection of a mixture of contrast material and normal saline and employed it for 3D-CTA with cardiac functional analysis [13]. However, because of the prominent stepwise changes in the TECs, there was concern about the large time-dependent variability observed in the enhancement.
For solving this problem, the iodine administration rate must be varied in a non-stepwise manner.
To facilitate this process, we defined the variation factor (VF), a parameter for variable iodine administration rates, and we developed a contrast method called the variable-injection method (VIM), in which the injection rate was varied in a non-stepwise manner. The usefulness of the VIM was then assessed by analyzing the characteristics of the peak enhancement obtained by use of the VIM with VFs under the same injection parameters as in the conventional SIM.
2 MATERIALS AND METHODS
2.1 Overview of the VIM with VFs
The VF can be determined by dividing the iodine administration rate at the completion of injection (aX) by that at the start of injection (X). Figure 1 shows the relationship between the iodine administration rate and time in the VIM. When the VF is 1.0, the VIM shows an injection profile
7
equivalent to that of the SIM [Figure 2(b)]. When the VF is lower than 1.0 [Figure 2(a)], the iodine administration rate decreases with time. When the VF is higher than 1.0 [Figure 2(c)], an injection profile in which the iodine administration rate increases is obtained. As the VIM allows the iodine administration rate, i.e., the injection rate, to be varied in a non-stepwise manner, the injection duration and the iodine dose are not dependent on the VF.
2.2 CT scanner and Phantom
The CT system used in this study consists of a 64 multidetector-row CT unit (Aquilion Multi 64, Toshiba Medical Systems Co., Tochigi, Japan) and a double-head power injector (Dual Shot GX, Nemoto Kyorindo Co., Tokyo, Japan), which was used as the automatic contrast medium injector.
This automatic injector can store parameters, including the iodine dose per body weight, the injection duration, and the formula for the VIM, on a memory card to formulate injection protocols.
The contrast material flow phantom (TEC phantom, Nemoto Kyorindo Co., Tokyo, Japan) that was used to generate TECs was a modification of the original circulation phantom, as shown in Figure 3(a) and (b) [5]. The TEC phantom also provides a dynamic description of the equipment settings
8
and circulatory dynamics, allowing the verification of the contrast enhancement according to the actual levels of enhancement. The TECs obtained simulated the abdominal aorta.
2.3 Settings and Methods of Measurement of the TEC Phantom
As illustrated in Figure 3(b), the TEC phantom consisted of a plastic water tank, a pulsatile flow pump, a flow meter, a water-filled acrylic cylinder, a closed metallic tank, and tubes for connection and circulation. The top of the plastic water tank was open, and contrast material was injected into (1) of Figure 3(a) through a tube with the Dual Shot GX. Then, the contrast material was circulated with the pulsatile flow pump at a rate of 60 pulses per minute.
The following settings were used for the TEC phantom: a circulating water volume of 5600 mL and a circulation rate of 5400 mL/min. This represents an examinee weighing 70 kg, with a blood volume of approximately 7% to 8% of the body weight [14,15]. Iohexol 240 (Omnipaque 240, Daiichi Sankyo Co., Tokyo, Japan) with an iodine concentration of 240 mgI/mL was used as the contrast material to generate the TECs for both the SIM and VIM.
The scanning conditions were 120 kV, 150 mA, 1.0 s/rot., and a 64 × 0.5 mm detector configuration. The CT images were reconstructed by filtered back projection (FBP) with a 180-mm display field of view (DFOV), a 2.0-mm slice thickness, and a reconstruction kernel of FC13. The contrast medium arrival time [16] was 2 s prior to achievement of an enhancement greater than 10 HU [6].
This study involved experiments with three protocols over a set of three runs. The CT values (HU) were measured in regions of interest accounting for approximately 80% of the sectional area at the center of the hose in the scanning position, and the CT values before the injection of contrast material were subtracted. The measurements from the TECs were taken by a single radiological technologist (T.T.), who was blinded to the protocols. For comparison of SIM and VIM peak enhancement, we used the two-tailed Student’s t test. Statistical analysis was performed with a statistical software package (IBM SPSS Statistics 20).
2.4 Methods of Assessments
9 2.4.1 Analysis of the SIM
First, a process in which TECs were generated with varying injection durations in SIM by use of a fixed iodine administration rate was verified. This provided a reference for assessing the in vivo circulatory dynamics and the VIM profile. With reference to an iodine administration rate of 720 mgI/s, the findings obtained at 3 iodine doses (12000 mgI, 18000 mgI, and 24000 mgI) were compared. These iodine doses represented contrast medium doses of 50 mL, 75 mL, and 100 mL, respectively, all injected at a flow rate of 3 mL/s. These conditions were designated as Protocol 1(i), Protocol 1(ii), and Protocol 1(iii) and have been described in detail in Table 1. The TECs were analyzed at the following points: the peak enhancement, the time to peak enhancement, and the contrast medium arrival time. The peak-time, calculated by subtraction of the contrast medium arrival time from the time to peak enhancement, was also included in the analysis.
2.4.2 Evaluation of the Peak Enhancement
For evaluation of the time-enhancement relationship for the VIM and SIM at different VFs, TECs were generated while the VF was varied from 0.3 to 0.5, 1.0, and 1.5 in a stepwise manner. For all of the VFs, an iodine dose of 24000 mgI and a contrast medium dose of 100 mL were used with an injection duration of 35 s. These conditions were designated as Protocol 2(A) [i-iv].
For evaluation of the changes in injection duration for the VIM, TECs were generated over an injection duration of 25 s while the VF was varied from 0.3 to 0.5, 1.0, and 1.5 in a stepwise manner, as described above. These conditions were designated as Protocol 2(B) [i-iv]. For all of the VFs, an iodine dose of 24000 mgI and a contrast medium dose of 100 mL were used. Further details are shown in Table 2. In addition to the analysis points described in Section 1.4.1, the enhancement- time, defined as the duration over which 80% of peak enhancement was achieved, was also compared.
10 3 RESULTS
3.1 TECs with the SIM among Different Injection Durations
Figure 4 shows the TECs obtained with Protocol 1(i-iii). Comparisons of the TECs obtained with varying injection durations revealed that all protocols produced a sharp increase in the TECs up to 22-23 s following the start of injection. In contrast, Protocol 1(ii) and Protocol 1(iii) produced a slow increase, starting at 22-23 s after the start of injection, which was identified as the change point of increments in enhancement in the TECs. When the injection duration was longer than that in Protocol 1(i), the TECs exhibited a bi-phasic slope up to the peak enhancement. However, the TEC obtained with Protocol 1(i) exhibited a uniphasic shape. The contrast medium arrival time in Protocol 1(i) was 10 s less than that in any other protocol.
11
The peak enhancement occurred following the completion of the injection of contrast material with any of these protocols. The peak enhancement and the time to peak enhancement (s) were 165.7 ± 6.5 (HU) and 25.3 ± 1.2 s, 207.7 ± 6.5 (HU) and 34.7 ± 1.2 s, and 229.7 ± 5.5 (HU) and 42.7 ± 1.2 s with Protocol 1(i), Protocol 1(ii), and Protocol 1(iii), respectively. The peak- times were calculated to be 15.3 s, 24.7 s, and 32.7 s with Protocol 1(i), Protocol 1(ii), and Protocol 1(iii), respectively (Table 3). Analyses showed that the peak-time was approximately the same as the injection duration in Protocol 1(ii) and (iii), whereas Protocol 1(i) produced a peak-time that was 1.4 s shorter than the injection duration.
3.2 TECs with Varying VFs and Injection Durations
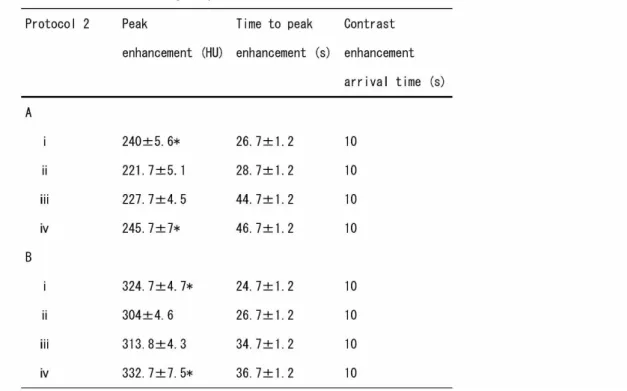
Figures 5(a) and (b) show TECs with injection durations exceeding 35 and 25 s with varying VFs of 0.3, 0.5, 1.0, and 1.5. The peak enhancement, time to peak enhancement, and contrast medium arrival times obtained with each of these protocols are shown in Table 4. The contrast medium arrival time was 10 s for each of these protocols.
Comparisons of the time-enhancement relationship for the VIM with varying VFs showed that Protocol 2(A) [i-iv] and Protocol 2(B) [i-iv] both had a shorter time to peak enhancement as compared to the SIM when a VF less than 1.0 was used. When a VF higher than 1.0 was used, the time to peak enhancement was delayed in comparison with the SIM. When VFs of 0.3 and 1.5 were used, the TECs obtained showed sharp changes before and after peak enhancement, the magnitude of which was higher than that in the SIM. In contrast, although a VF of 0.5 did not provide a higher level of enhancement than did the SIM, no sharp changes in the TECs were observed before and
12
after peak enhancement, and a stable shape, consistent with persistent enhancement, was formed.
Table 5 shows the enhancement-time obtained with each protocol. Comparisons of the enhancement-time obtained with VFs of 0.5 and 1.0 showed that the enhancement-time was 26 s with Protocol 2(A) and a VF of 0.5 and 22.3 s when the SIM was used. The enhancement-time was
13
16.4 s with Protocol 2(B) and a VF of 0.5 and 14.8 s when the SIM was used. When compared to the SIM, the use of a VF of 0.5 extended the duration of the enhancement.
Comparisons of the time-enhancement relationship for the VIM with varying injection durations revealed that the VIM with use of either Protocol 2(A) [i-iv] or Protocol 2(B) [i-iv] showed changes depending on the VF, regardless of the injection duration [Figs. 5(a) and (b)]. However, the peak- to-peak time was different between the two conditions: 20 s for Protocol 2(A) [i] and 12 s for Protocol 2(B) [i]. In addition, the VIM showed less change in the time leading up to the peak enhancement with shorter injection durations, and tended to produce more uniformly shaped TECs.
As shown in Fig. 6, assessments of the relationship between the peak-to-peak time and the injection duration was found of a strong correlation (r = 0.99).
14 4 DISCUSSION
In the time-enhancement relationship for the SIM, which involves a fixed iodine administration rate and varying injection durations, a longer injection duration led to a greater enhancement and a longer time to peak enhancement. The peak enhancement occurred after completion of the injection, regardless of the injection duration. However, the TECs exhibited two different patterns of increase before and after the 22-23-s period following the start of injection. Because this time point was the change point, it can be considered that an increase in the enhancement is simply additive, with the iodine dose increasing up to this time point, as shown in Fig. 4(i). However, Figure 4 (ii, iii) shows a slow increase in the enhancement at 22–23 s following the start of injection.
This was considered to be due to the presence of limitations on the input side (right atrial/ventricle), whereas the slow increase was attributed to increases in the enhancement associated with recirculation of the injected contrast material [17.18].
Based on these findings, the TECs beyond the change point are formed by addition of the enhancement associated with recirculation to the persistent enhancement according to the injection duration. Based on the time-enhancement relationship of the TECs having two slopes, the evaluation of peak-time versus the injection duration in Protocol 1 showed that the peak-time was approximately equal to the injection duration with Protocol 1(ii, iii). This is unlike that the findings observed with Protocol 1(i), which produced a peak-time that was 1.4 s shorter than the injection duration, as shown in Table 3. Given that either of the TECs obtained with Protocol 1(ii) and Protocol 1(iii) demonstrated a change point, it is possible to predict the time to peak enhancement from the injection duration if an injection duration that exceeds the change point is used.
Yamaguchi et al. reported that there was a strong correlation between the time to peak enhancement and the injection duration [18], and that the correlation became weaker when an injection duration of less than 10 s was used. In short, an injection duration of at least 10 s provides a stable TEC. However, it appeared difficult to obtain a stable TEC with an injection duration that was shorter than that used in Protocol 1(i), because the actual measurement with use of the TEC phantom showed a difference of 1.4 s from Protocol 1(i). As the injection duration in Protocol 1(i) was 16.7 s, use of an injection duration of even 10 s or more for predicting the time to peak enhancement is not rational. Therefore, we thought that an injection duration of at least 15 s would be necessary. Although, for this correlation, there was a concern about individual differences, such as those in cardiac output (L/min), Bae et al. indicated that the cardiac output affected the contrast medium arrival time [19]. It appeared that an injection duration of at least 15 s beyond the change point could produce stable TECs in the presence of any changes in the contrast medium arrival time.
In a clinical study of parenchymal tissues, Awai et al. reported the evidence for a strong correlation between aortic peak enhancement and the enhancement of hypervascular tumors in hepatic dynamic-CT based on an assessment of tumor-to-liver contrast (TLC) [20]. This finding is consistent with the temporal separation between the arterial and parenchymal phases of the enhancement in the simulation by Baeet al [2]. This suggests that a peak enhancement higher than that obtained with the SIM leads to improvement in the TLC. In addition, as the parenchymal
15
enhancement also increases with time, a longer time to peak enhancement may result in a lower contrast for hypervascular tumors. Circulatory dynamics with the SIM shown in Fig. 4 (i-iii) indicated that the time to the peak enhancement occurred following the completion of injection, regardless of the injection duration, and that no peak enhancement could be achieved with an incomplete injection when the SIM was used. Thus, The TLC may be improved if the peak enhancement occurs more quickly than in the SIM condition, and if the peak enhancement is of a greater magnitude that can be achieved with the SIM condition.
Therefore, a contrast method that satisfies these requirements for temporal separation between the arterial and parenchymal phases of enhancement should show better accuracy in qualitative diagnostic examinations. In contrast, highly stable TECs are necessary for accurate morphologic analysis in 3D-CTA. Fleischmann et al. reported that it was reasonable to obtain optimal enhancement on the basis of the relationship between the injection duration and the duration of enhancement [21]. Thus, the enhancement-time must be adapted to the scan time and must be stable. In other words, a high and stable magnitude of enhancement is required. Additionally, to ensure improvement in the temporal separation between the arterial and venous phases, the accuracy of 3D-CTA could be improved if the time to peak enhancement occurs earlier than in the SIM, and if more persistent enhancement could be achieved than in the SIM.
Figures 5(a) and (b) show TECs obtained with the VIM. Even though the same fixed iodine dose and injection duration were used in both conditions, the VIM yielded peak characteristics different from these of the TECs. This difference is likely to be due to differences in the iodine administration rates associated with the specified VFs. Kimet al. reported that higher enhancement levels required an increase in the iodine administration rate based on the relationship between the iodine administration rate and the TEC [22]. Thus, it appears that a peak enhancement higher than that observed in the SIM condition could be achieved by use of VFs that provide higher iodine administration rates during the initial and final phases of the injection. Examples of such VFs were 0.3 and 1.5.
With regard to temporal separation, the time to peak enhancement must occur earlier than that obtained with the SIM. Comparisons of the VIM protocols showed that the highest peak enhancement was achieved prior to the completion of the injection with a VF of 0.3. These findings indicate that the conditions for improvement in TLC were met, as a larger interval separated the aortic and parenchymal peak enhancements and a higher peak enhancement was achieved, when compared to the SIM condition. For example, the time to peak enhancement with Protocol 2(A) was 26.7 s with a VF of 0.3 and 44.7 s with a VF of 1.0 for SIM, representing a difference of 18 s.
Given that parenchymal enhancement increases with time, it is evident that a longer time to peak enhancement leads to poorer temporal separation, which significantly affects the TLC.
Therefore, a VF of 0.3 is suitable for improving the contrast in examinations of hypervascular lesions. In other words, the VIM with a VF of 0.3 can be regarded as a reasonable contrast method for qualitative diagnostic examinations of parenchyma, such as hepatic dynamic-CT based on aortic peak enhancement. However, it is also important to determine the iodine administration rate because of its implications for the safety of examinees in clinical practice [23]. In that regard,
16
attention should be paid to the higher iodine administration rate during the early phase of injection with a VF of 0.3 in comparison with that in the SIM [24].
When we used a VF less than 1.0, the time to peak enhancement was earlier than that in the SIM. However, a VF of 0.5 produced long stable characteristics in the TEC, whereas a VF of 0.3 generated a TEC that was consistent with persistent enhancement. Nevertheless, the enhancement levels obtained were still lower than those in the SIM. The time to peak enhancement was shorter with the VF of 0.3 than in the SIM, due to an increased iodine administration rate during the early phase of injection. This can be explained by the presence of a change point for the SIM. The SIM showed an evident relationship in which the TECs reach a plateau due to limitations in the right heart following the change point, and it showed a slow increase resulting from the enhancement associated with recirculation, reaching peak enhancement, which was followed by a rapid decline [18].
In contrast, the TECs associated with a VF of 0.5 exhibited a relationship in which a slow decline was observed after peak enhancement. As the change point for the SIM almost coincided with peak enhancement with a VF of 0.5, a VF of 0.5 produced iodine administration rates that might maintain a plateau after the change point. In other words, as recirculation contributes to the maintenance of, but not the increase in, the magnitude of enhancement after a certain level of peak enhancement is achieved, a flat TEC might be formed. A comparison of the enhancement-times in Table 5 shows that a VF of 0.5 was associated with an increase in the duration of enhancement of 3.7 s with Protocol 2(A) and 1.6 s with Protocol 2(B). This represents an increase in the injection duration for the SIM. Therefore, the VIM with a VF of 0.5 can be considered as the contrast method that provides a more stable enhancement-time than dose the SIM.
In addition, 3D-CTA provides a high degree of enhancement by taking scans around the peak enhancement. Thus, it is possible that the SIM, which is associated with a sharp decline in TECs after the peak enhancement, will provide no stable contrast enhancement when the scan timing is poor. In contrast, the shape of the TEC from the VF of 0.5 suggests a degree of contrast enhancement that is stable and less variable among cases. In other words, the VIM with a VF of 0.5 effectively maintains the highest possible stable degree of enhancement for the purpose of examinations. Quicker achievement of the peak enhancement also results in a shorter scan time as compared to the SIM. This method has the potential to improve the temporal separation between the arterial and venous phases. Therefore, the VIM with a VF of 0.5 can be considered as a reasonable contrast method for 3D-CTA, a form of vascular investigation [25,26].
As shown in Figs. 5(a) and (b), assessments of the relationships of the injection duration in the VIM showed that, as the injection duration decreased, the peak enhancement characteristics were likely to be more similar to those in the SIM, despite being dependent on the VF. Given that the TECs ended at the change point for the SIM, the differences in the peak-to-peak time of the TECs should disappear when an injection duration of approximately 15 s is used. As shown in Fig. 6, assessments of the relationship between the peak-to-peak time and the injection duration showed evidence of a strong correlation. Based on this result, the effect of the VIM with VFs should be considered limited to 15 s of injection. More specifically, it can be seen that stable TECs can be
17
generated in a manner similar to the SIM. Therefore, the effect of the VIM with extremely short injection duration is small.
However, with the recent advent of area detector CT (ADCT) and the availability of other new scanning methods that shorten the injection duration in the heart or head, high levels of enhancement in vascular investigations, including 3D-CTA, are now possible. Nevertheless, the VIM may not be applicable to these scanning methods, because they assess localized sites with specialized scanning methods. In contrast, if scanning of extensive areas, including the aorta and the lower extremities, is required, the injection duration should be determined in consideration of the circulation time. In addition, in a study of visualization for qualitative diagnostic examinations, Yanaga et al. described that an injection duration of approximately 30 s was reasonable for a hepatic dynamic-CT [27]. Thus, it appeared that the contrast enhancement obtained with the VIM could be used widely and that the simulations of TECs with varying VFs may serve as an indicator of practical clinical use.
In this study, We determined the usefulness of the VIM by assessing TECs obtained with VFs less than 1.0, but failed to clarify the usefulness of VIM with VFs greater than 1.0, with support from clinical assessments. This was due to a delay in the onset of peak enhancement and a shorter enhancement-time in comparison with that of the SIM. Thus, the study failed to discuss suitable examination regions in consideration of temporal separation or the contrast between the arterial vasculature and parenchyma or venous vasculature. However, the greatest magnitude of enhancement was achieved among the simulations performed. It appeared that this result could serve as the foundation for discussions of future constructive contrast methods.
5 CONCLUSION
This phantom study has overcome the limitation of uniform contrast enhancement posed by the SIM through the development of the VIM with a new parameter, VF. The study indicated that varying levels of contrast enhancement could be achieved under the same conditions for injection parameters as employed in the SIM. This finding suggests that the generation of varying TECs suitable for the purposes of examinations is possible. The VIM is characterized by two great advantages over the traditional SIM. First, the VIM can contribute to improvements in visualization due to temporal separation between the arterial vasculature and parenchyma or the venous vasculature in qualitative diagnostic examinations. Secondly, the VIM demonstrates improvements in the accuracy of the morphologic diagnosis in morphologic analyses by customizing TECs without varying the injection duration or increasing the iodine load. Thus, the VF is now an essential parameter for considering contrast methods with a focus on peak enhancement in TECs. These findings indicate that the VIM with VF is a reasonable contrast-enhanced CT method that considers the iodine load and is useful for flexibility in varying the contrast enhancement.
Conflict of Interest
Our study is basic research involving a new method of contrast-enhanced CT examination and, therefore, does not require ethical approval. All authors have approved the content and the
18
submission of the manuscript. The authors declare no particular conflicts of interest relevant to this manuscript. The manuscript has not been submitted to other publications. We have received no research grant funding for this study.
REFERENCES
1) Bae KT, Heiken JP, Brink JA: Aortic and hepatic contrast medium enhancement at CT. Part I. Prediction with a computer model. Radiology. 1998 Jun;207(3):647-55.
2) Bae KT, Heiken JP, Brink JA: Aortic and hepatic peak enhancement at CT: effect of contrast medium injection rate—pharmacokinetic analysis and experimental porcine model. Radiology.
1998 Feb;206(2):455-64.
3) Fleischmann D, Hittmair K: Mathematical analysis of arterial enhancement and optimization of bolus geometry for CT angiography using the discrete Fourier transform. J Comput Assist Tomogr. 1999 May-Jun;23(3):474-84.
4) Fleischmann D, Rubin GD, Bankier AA, Hittmair K: Improved uniformity of aortic enhancement with customized contrast medium injection protocols at CT angiography. Radiology. 2000 Feb;214(2):363-71.
5) Awai K, Hatcho A, Nakayama Y, Kusunoki S, Liu D, Hatemura M, et al: Simulation of aortic peak enhancement on MDCT using a contrast material flow phantom: Feasibility study. Am J Roentgenol. 2006 Feb;186(2):379-85.
6) Awai K, Hiraishi K, Hori S: Effect of contrast material injection duration and rate on aortic peak time and peak enhancement at dynamic CT involving injection protocol with dose tailored to patient weight. Radiology. 2004 Jan;230(1):142-50.
7) Heiken JP, Brink JA, McClennan BL, Sagel SS, Crowe TM, Gaines MV: Dynamic incremental CT: effect of volume and concentration of contrast material and patient weight on hepatic enhancement. Radiology. 1995 May;195(2):353-7.
8) Yamashita Y, Komohara Y, Takahashi M, Uchida M, Hayabuchi N, Shimizu T, et al: Abdominal helical CT: evaluation of optimal doses of intravenous contrast material--a prospective randomized study. Radiology. 2000 Sep;216(3):718-23.
9) Bae KT, Seek BA, Hildebolt CF, Tao C, Zhu F, Kanematsu M, et al: Contrast enhancement in cardiovascular MDCT; effect of body weight, height, body surface area, body mass index, and obesity. Am J Roentgenol. 2008 Mar;190(3):777-84.
10) Kondo H, Kanematsu M, Goshima S, Tomita Y, Miyoshi T, Hatcho A, et al: Abdominal multidetector CT in patients with varying body fat percentages: estimation of optimal contrast material dose. Radiology. 2008 Dec;249(3):872-7.
11) Murakami T, Kim T, Kawata S, Kanematsu M, Federle MP, Hori M, et al: Evaluation of optimal timing of arterial phase imaging for the detection of hypervascular hepatocellular carcinoma by using triple arterial phase imaging with multidetector-row helical computed tomography. Invest Radiol. 2003 Aug;38(8):497-503.
12) Bae KT, Tran HQ, Heiken JP: Multiphasic injection method for uniform prolonged vascular enhancement at CT angiography: pharmacokinetic analysis and experimental porcine model.
19 Radiology. 2000 Sep;216(3):872-80.
13) Utsunomiya D, Awai K, Sakamoto T, Nishiharu T, Urata J, Taniguchi A, et al: Cardiac 16- MDCT for anatomic and functional analysis: assessment of a biphasic contrast injection protocol. Am J Roentgenol. 2006 Sep;187(3):638-44.
14) Cameron JR, Skofronick JG, Grant RM: Physics of the Body (Second Edition). Madison, Medical Physics Publishing. 1999:181-2.
15) Hudson DM: Top Shelf Human Anatomy & Physiology. Walch Education Publishing. 2005:134- 5.
16) Bae KT: Intravenous Contrast Medium Administration and Scan Timing at CT: Considerations and Approaches. Radiology. 2010 Jul;256(1):32-61.
17) Terasawa K, Hatcho A: Contrast enhancement technique in brain 3D-CTA studies: Optimizing the amount of contrast medium according to scan time based on TDC. Nihon Hoshasen Gijutsu Gakkai Zasshi. 2008 Jun;64(6):681-9. [in Japanese]
18) Yamaguchi I, Kidoya E, Suzuki M, Kimura H: Optimizing scan timing of hepatic arterial phase by physiologic pharmacokinetic analysis in bolus-tracking technique by multi-detector row computed tomography. Radiol Phys Technol. 2011 Jan;4(1):43-52.
19) Bae KT, Heiken JP, Brink JA: Aortic and hepatic contrast medium enhancement at CT. Part II. Effect of reduced cardiac output in a porcine model. Radiology. 1998 Jun;207(3):657-62.
20) Awai K, Takada K, Onishi H, Hori S: Aortic and hepatic enhancement and tumor-to-liver contrast: analysis of the effect of different concentrations of contrast material at multi-detector row helical CT. Radiology. 2002 Sep;224(3):757-63.
21) Fleischmann D: CT angiography: injection and acquisition technique. Radiol Clin North Am.
2010 Mar;48(2):237-47.
22) Kim T, Murakami T, Takahashi S, Tsuda K, Tomoda K, Narumi Y, et al: Effects of injection rates of contrast material on arterial phase hepatic CT. Am J Roentgenol. 1998 Aug;171(2):429-32.
23) Wang CL, Cohan RH, Ellis JH, Adusumilli S, Dunnick NR: Frequency, management, and outcome of extravasation of nonionic iodinated contrast medium in 69,657 intravenous injections. Radiology. 2007 Apr;243(1):80-7.
24) Aviram G, Cohen D, Steinvil A, Shmueli H, Keren G, Banai S, et al: Significance of reflux of contrast medium into the inferior vena cava on computerized tomographic pulmonary angiogram.
Am J Cardiol. 2012 Feb;109(3):432-7.
25) Terasawa K, Hatcho A, Muroga K: Assessment of contrast enhancement using the variable contrast medium injection method in 3D-CTA of the head. Nihon Hoshasen Gijutsu Gakkai Zasshi. 2005 Jan;61(1):126-34. [in Japanese]
26) Muroga K, Hatcho A, Terasawa K: Evaluation of the variable-speed injection method for three- dimensional CT angiography of the trunk. Nihon Hoshasen Gijutsu Gakkai Zasshi. 2005 Jan;61(1):110-7. [in Japanese]
27) Yanaga Y, Awai K, Nakamura T, Namimoto T, Oda S, Funama Y, et al: Optimal contrast dose for depictin of the hypervascular hepatcellular carcinoma at dynamic CT using 64-MDCT. Am
20 J Roentgenol. 2008 Apr;190(4):1003-9.
研究業績リスト 著 書
1) 日本放射線技術学会撮影部会 平成 26 年学術調査研究班「X 線 CT 撮影における標準化」
(寺澤和晶ほか):X 線 CT 撮影の標準化~ガイドライン GALACTIC~(改定 2 版).放射線医 療技術学叢書 27(井田正博 監修),社団法人日本放射線技術学会出版委員会,京都,
132-147,2015.(ISSN 1340-7716)
2) 寺澤和晶ほか:CT 造影技術.(寺澤和晶 編集),メディカルアイ,東京,2013.
3) 寺澤和晶ほか:CT ってなあに?.(寺澤和晶 編集),長野県放射線技師会出版,長野,
2013.
4) 寺澤和晶ほか:考える CT 撮像技術.(斎藤陽子,市川勝弘 編集),文光堂,東京,48-61,
2013.IBBN978-4-8306-4230-2
5) 寺澤和晶ほか:X 線 CT 認定技師講習会テキスト.(市川勝弘,山口 功 編著),日本 X 線
CT 専門技師認定機構,千葉,93-110,2011.
6) 日本放射線技術学会撮影分科会 X 線 CT 撮影の標準化班(寺澤和晶ほか):X 線 CT 撮影
における標準化~ガイドライン GuLACTIC~.放射線医療技術学叢書 27(井田正博 監修),
社団法人日本放射線技術学会出版委員会,京都,8-16,2010.(ISSN 1340-7716)
論 文
1) Terasawa K, Maruyama A, Tsukimata T: A New Method with Variable-Injection Parameters in Contrast Enhanced CT: A Phantom Study for Evaluating an Aortic Peak Enhancement.
Radiol Phys Technol, 8(2), 248-57, 2015. (doi: 10.1007/s12194-015-0314-5)
2) 寺澤和晶,丸山篤敬,月又智広:CT 検査における可変注入法よる造影剤投与法の検討~検
査目的に応じた TDC の適正化~.Med.j.N.R.C.H.27,47-54,2014.
3) 寺澤和晶,八町 淳,輪湖 正:造影 CT 検査における光吸収性センサーを用いた血管外漏
出検出器の基礎的検討~検出波形の特長と検知システム精度に与える因子について~.
Rad Fan, 10(13), 115-118, 2012.
4) 寺澤和晶,八町 淳,輪湖 正:造影 CT 検査における光吸収性センサーを用いた血管外漏
出検出器の基礎的検討~造影剤および水の光吸収性を利用した検出器開発の取り組み~.
Rad Fan, 10(13), 112-114, 2012.
5) Terasawa K, Hatcho A, Okuda I: Effects of computed tomography contrast medium factors on contrast enhancement. Nihon Hoshasen Gijutsu Gakkai Zasshi, 67(12), 1583-91, 2011.
Japanese.
6) Terasawa K, Hatcho A: Contrast enhancement technique in brain 3D-CTA studies: optimizing the amount of contrast medium according to scan time based on TDC. Nihon Hoshasen Gijutsu Gakkai Zasshi, 64(6), 681-9, 2008. Japanese.
7) Terasawa K, Hatcho A, Nishimura M, et al: Overview of cardiac contrast examination using 64-row multislice CT. Nihon Hoshasen Gijutsu Gakkai Zasshi, 63(6), 628-37, 2007. Japanese.
21
8) 寺 澤 和 晶 , 八 町 淳 , 室 賀 浩 二 : 肝 質 的 診 断 に お け る 造 影 剤 注 入 方 法 の 検 討 . Med.j.N.R.C.H.19,110-117,2006.
9) Muroga K, Hatcho A, Terasawa K: Evaluation of the variable-speed injection method for three-dimensional CT angiography of the trunk. Nihon Hoshasen Gijutsu Gakkai Zasshi, 61(1), 110-7, 2005. Japanese.
10) Terasawa K, Hatcho A, Muroga K: Assessment of contrast enhancement using the variable contrast medium injection method in 3D-CTA of the head. Nihon Hoshasen Gijutsu Gakkai Zasshi, 61(1), 126-34, 2005. Japanese.
11) Terasawa K, Hatcho A: Evaluation of a contrast examination technique for three-dimensional CT angiography (3DCTA) of the head and craniocervical region. Nihon Hoshasen Gijutsu Gakkai Zasshi, 60(3), 423-8, 2004. Japanese.
学会発表
1) Terasawa K, Maruyama A, Tsukimata T: Contrast Material Administration by Use of Variable Injection Methods: A Phantom Study of Evaluation of Aortic Peak Enhancement. Radiological Society of North America (RSNA), CHICAGO, USA, 2015, 11.
2) Terasawa K, Fukuzawa A, Maruyama A: Effect of contrast material administration using the variable-injection method in the liver: Study of TEC simulation.第 42 回日本放射線技術学 会秋季学術大会,札幌市,2014.10.
3) Terasawa K, Kubota N, Kobayashi M, et al: Simulation of TEC(Time Enhancement Curve) by the Variable Injection Method ― Study of Contrast Material Flow Phantom and Pharmacokinetic Analysis.第 41 回日本放射線技術学会秋季学術大会,福岡市,2013.10.
4) Terasawa K,Kamiya N,Shibusawa Y, et al: Optimization of Delivery FDG Whole-Body TOF- PET Acquisition Parameters.第 41 回日本放射線技術学会秋季学術大会,福岡市,2013.
10.
5) 寺澤和晶:腹部 CT 検査において造影剤因子が造影効果に及ぼす影響.日本診療放射線技
師会,第 27 回 診療放射線技師総合学術大会・第 18 回 東アジア学術交流大会,青森市,
2011.9.
6) Terasawa K,Hatcho A,Ohtsuka T, et al: Influence of enhancement in a CT contrast medium.
第 67 回日本放射線技術学会総会学術大会,横浜市,2011.4.
7) 寺澤和晶,八町 淳:Bolus tracking 法を用いた頭部 3D-CTA においてリアル・プレップ開始 時間が造影効果に及ぼす影響.第 26 回日本脳神経血管内治療学会,北九州市,2010.11.
8) 寺澤和晶,八町 淳,西村勝幸ほか:造影検査情報一元管理システム(CE エビデンス)の CT
検査室運用における有用性の検討.第 65 回日本放射線技術学会総会学術大会,横浜市,
2009.4.
9) 寺澤和晶,八町 淳,西村勝幸ほか:頭部 3D-CTA におけるボーラストラッキング使用方法の
検討.第 65 回日本放射線技術学会総会学術大会,横浜市,2009.4.
10) 寺澤和晶,月又智広,八町 淳:CT 造影検査において心機能が TDC に与える影響の基礎
的検討-最大 CT 値を一定にするためのヨード使用量補正-.第 64 回日本放射線技術学会 総会学術大会,横浜市,2008.4.
22
11) 寺澤和晶,八町 淳,西村勝幸ほか:3D-CTA 検査における造影法―注入時間と最大 CT 値
の関係―.第 23 回日本脳神経血管内治療学会,神戸市,2007.11.
12) 寺澤和晶,八町 淳,西村勝幸ほか:64 列 MSCT による心臓造影検査法―CT 値を一定にす
るためのヨード使用量の検討―.第 30 回日本心血管インターベンション学会関東甲信越地 方会,新潟市,2007.5.
13) 寺澤和晶,八町 淳,西村勝幸ほか:CT 撮像時間を基準にした頭部3D-CT アンギオにおけ
る造影剤使用量の最適化.第 63 回日本放射線技術学会総会学術大会,横浜市,2007.4.
14) 寺澤和晶,西村勝幸,月又智弘ほか:64 列 MSCT による心臓造影方法の基礎的検討―第 2
報―.第 34 回日本放射線技術学会秋季学術大会,札幌市,2006.10.
15) 寺澤和晶,西村勝幸,月又智弘ほか:64 列 MSCT による心臓造影方法の基礎的検討.第 62
回日本放射線技術学会総会学術大会,横浜市,2006.4.
16) 寺澤和晶,西村勝幸,室賀浩二ほか:造影剤血管外漏出検出器における波形の検討.第 62
回日本放射線技術学会総会学術大会,横浜市,2006.4.
17) 寺澤和晶,西村勝幸,月又智広ほか:32 列 MSCT による縦隔造影検査の適正化,平成 17 年
度長野県放射線技師学術大会,高遠町,2005.9.
18) 寺澤和晶,八町 淳,西村勝幸ほか:肝質的診断における造影剤注入方法の検討.第 61 回
日本放射線技術学会総会学術大会,横浜市,2005.4.
19) 寺澤和晶,八町 淳:頭部3DCTA における連続可変注入の検討.第 60 回日本放射線技術
学会総会学術大会,横浜市,2004.4.
20) 寺澤和晶,八町 淳:頭部 3DCTA における造影剤使用量低減の検討.第 59 回日本放射線
技術学会総会学術大会,横浜市,2003.4.
21) 寺澤和晶:頭部および頭頚部3DCTA 検査における造影剤使用量の適正化.日本放射線技
師会平成 14 年度南関東ブロック学術大会,千葉市,2002.6.
22) 寺澤和晶,八町 淳:頭頚部3D-CTA におけるリアル・プレップおよびインジェクター同期ス
キャンの有用性.第 58 回日本放射線技術学会総会学術大会,神戸市,2002.4.
23) 寺澤和晶,八町 淳,駒津和浩ほか:CT 検査における自動注入器の開発.第 37 回日本赤
十字社医学会総会,旭川市,2001.10.
24) 寺澤和晶,八町 淳:CT 装置における各種造影剤による造影効果の検討.日本放射線技術
学会第 46 回関東部会研究発表大会,松本市,2000.2.
その他1(執 筆)
1) 寺澤和晶:マルチスライス CT による肝臓領域の造影検査法.インナービジョン,25(10),10-
15,2010.
2) 寺澤和晶:ボーラストラッキング未使用の立場から―64 列 MSCT における肝動脈相撮像開始
時間法の比較検討―.MDCT 至適造影法を語る会,第 4 回学術集会,メディカルトリビュー ン,6-8,2009.
3) 寺澤和晶:TDC から考える 3D-CTA の造影法~CT 撮像時間を基準にした造影剤使用量の
適正化~.インナービジョン,23(11),25-29,2008.
4) 寺澤和晶:64 列 MDCT による心臓 CT 検査~冠動脈と心機能の同時評価に適した造影法の
検討~.MDCT 至適造影法を語る会,第 3 回学術集会,メディカルトリビューン,38,8-11,
23 2007.
5) 寺澤和晶:当施設における CT 造影法―腹部検査を中心とした現状―.アールティ,メディカ
ルトリビューン,38,23-32,2007.
6) 寺澤和晶:MDCT と造影.Rad Fun,3(6),50-53,2005.
7) 寺澤和晶:当施設における CT 検査(造影検査)の現状.Rad Fun,2(6),80-83,2004.
その他2(講 演)
1) 寺澤和晶:RSNA 報告~造影 CT の温故知新.北信ヘリカル CT 勉強会最終セミナー,長野
市,2016.2.
2) 寺澤和晶:造影 CT 検査の基礎知識‐腹部を中心に‐.平成 27 年度長野県診療放射線技師
会東信支部冬の勉強会 第 11 回東信画像勉強会,佐久市,2016.1.
3) 寺澤和晶:TEC から考える造影剤の循環動態と検査目的に応じた適正化.平成 27 年度福島
県診療放射線技師会学大会ランチョンセミナー,郡山市,2015.11.
4) 寺澤和晶:TEC から考える造影剤の循環動態と検査目的に応じた適正化.第 21 回リフレッシ
ャーズ研究会,仙台市,2015.8.
5) 寺澤和晶:理論的アプローチにより造影 CT プロトコールの“ 根拠 ”を探る!.第 12 回新潟 CT テクノロジー研究会,新潟市,2015.7.
6) 寺澤和晶:造影 CT プロトコールの“根拠 ”どうしてますか?-TEC による遂行的アプローチ.
第 26 回 FUKUYAMA CT MEETING,福山市.2015.3.
7) 寺澤和晶:造影 CT プロトコールを再構できるか!?~TEC による適正化の試み~.第 9 回
栃木 CT 研究会,宇都宮市,2014.5
8) 寺澤和晶:造影 CT 技術の基礎+X線 CT の標準化~ガイドライン GuLACTIC~について.
バイエル薬品社内研修会,長野市,2014.4.
9) 寺澤和晶:造影 CT 技術~検査目的に応じた TEC の適正化~.平成 26 年度福島県診療放
射線技師会学術講演会,郡山市,2014.2.
10) 寺澤和晶:造影の基礎知識.第 12 回埼玉 CT テクノロジーセミナー学術集会,さいたま市,
2013.8.
11) 寺澤和晶:考える造影 CT 検査.第 38 回 CT 画像研究会,大阪市,2013.6.
12) 寺澤和晶:TDC から考える造影 CT テクニック-造影効果に影響を与える因子とは?-.第 8
回山口 CT テクノロジーセミナー,山口市.2012.10.
13) 寺澤和晶:CT 検査における造影テクニック-造影効果に影響を与える内的および外的因子
について-.第 10 回沖縄 CT 研究会記念講演会,那覇市,2012.4.
14) 寺澤和晶:CT 検査における造影テクニック-造影効果に影響を与える内的および外的因子
について-.長野県 CT 撮影技術研究会,CT Technology 勉強会,長野市,2012.3.
15) 寺澤和晶:CT 造影検査における注入技術および造影効果に影響を与える因子について.第
2回岡山 CT テクノロジー,倉敷市,2011.10.
16) 寺澤和晶:TDC から考える3D‐CTA の造影法―CT 撮像時間を基準にした造影剤投与法.
奈良 CT Conference,奈良市,2010.9.
17) 寺澤和晶:マルチスライス CT による肝臓領域の造影検査法.CT サミット(教育講演),大宮
市,2010.7.
24
18) 寺澤和晶:生涯学習セミナー「X 線 CT 検査 撮影技術Ⅲ(造影)」.日本放射線技師会,台
東区,2010.2.
19) 寺澤和晶:血管系における造影の基礎と臨床応用~可変注入による冠動脈と心機能の同時
評価に適した造影法まで~.第 1 回心臓画像勉強会,台東区.2010.1.
20) 寺澤和晶:CT 造影検査において心機能が TDC に与える影響の基礎的検討-最大 CT 値を
一定にするためのヨード使用量補正-.北信ヘリカル CT 勉強会,長野市,2009.12.
21) 寺澤和晶:CT 検査における造影テクニック~TDC から考える造影の基礎と臨床応用~ 血
管系の検査を中心に.第 4 回鳥取県 CI テクノロジーフォーラム,米子市.2009.12.
22) 寺澤和晶:ボーラストラッキング未使用の立場から―64 列 MSCT における肝動脈相撮像開始
時間法の比較検討―.MDCT 至適造影法を語る会,第 4 回学術集会,中央区,2009.7.
23) 寺澤和晶:CT 検査における再現性を目的としたヨード使用量について考える~TDC による
体重毎に規定したヨード投与の妥当性~ 血管系の検査を中心に.高速螺旋 CT 研究会,第 9 回高速らせん CT 技術セミナー,広島市,2009.4.
24) 寺澤和晶:3D 作成に役立つ造影理論~TDC から考える CT 撮像時間を基準にした造影剤
使用量の適正化~.第 29 回 CT 画像研究会,大阪市,2008.11.
25) 寺澤和晶:3D-CTA の造影技術~TDC から考える CT 撮像時間を基準にした造影剤使用量
の適正化~.第 34 回日本放射線技術学会秋季学術大会,軽井沢町,2008.10.
26) 寺澤和晶:TDC から考える3D-CTA での造影法~CT 撮像時間を基準にした造影剤使用量
の適正化~. CT サミット(良好な三次元画像作成のために‐基礎編‐),札幌市,2008.7.
27) 寺澤和晶:TDC から考える 3D-CT アンギオでの造影法 -CT 撮像時間を基準にした造影
剤使用量の適正化-.第 3 回岡山マルチスライス CT ミーティング,倉敷市,2007.9.
28) 寺澤和晶:64 列 MDCT による心臓 CT 検査~冠動脈と心機能の同時評価に適した造影法の
検討~.MDCT 至適造影法を語る会,第 3 回学術集会,中央区,2007.8.
29) 寺澤和晶:X 線 CT の基礎知識と臨床応用(CT 画像の理解とボリュームデータ).JMM 3D‐
meister 講習会,新宿区,2007,6.
30) 寺澤和晶:CT 造影検査の再現性と適正化~TDC から考える検査方法 ~.第 7 回瀬戸内
CT サイエンスセミナー,広島市,2006.9.
31) 寺澤和晶:当施設における造影剤量(ヨード量)の決め方とプロトコール.MDCT 至適造影法
を語る会,第 2 回学術集会,品川区,2006.7.
32) 寺澤和晶:CT 検査における造影技術~再現性と適正化~.第 23 回北海道ヘリカル CT 研
究会,札幌市,2006.7.
33) 寺澤和晶:64 列 MSCT の使用経験 MSCT による心臓検査~撮影テクニックについて~.長 野県放射線技師会 北信支部研修会,長野市,2006.3.
34) 寺澤和晶:3D-CTA、血管系およびその他何でもあり!.第 4 回撮影技術討論会,北信ヘリ
カル CT 勉強会,長野市,2006.2.
35) 寺澤和晶:64 列 MSCT による心臓検査~撮影テクニックについて~.長野市医師会,長野
市,2005.12.
36) 寺澤和晶:CT 検査における造影技術.eisai 社員研修会,長野市,2005.11.
37) 寺澤和晶:X 線 CT とは?CT にできること.三水会(長野市歯科医師会),長野市,2005.11.
38) 寺澤和晶:当施設における3DCT 検査の現状.北信ヘリカル CT 勉強会,長野市,2004.2.
25
39) 寺澤和晶:マルチスライス CT における検査プロトコールと使用経験.長野県放射線技師会,
安曇野市,2002.7.
その他3(学会座長)
1) 寺澤和晶:CT 検査‐造影技術.第 71 回日本放射線技術学会総会学術大会,横浜市,
2015.4.
2) 寺澤和晶:CT 検査‐腹部造影.第 42 回日本放射線技術学会秋季学術大会,札幌市,2014.
10.
3) 寺澤和晶:CT 検査‐造影手技.第 70 回日本放射線技術学会総会学術大会,横浜市,
2014.4.
4) 寺澤和晶:CT 検査‐造影技術(基礎解析).第 69 回日本放射線技術学会総会学術大会,横
浜市,2013.4.
5) 寺澤和晶:CT 検査‐造影技術.第 40 回日本放射線技術学会秋季学術大会,江戸川区,
2012.10.
6) 寺澤和晶:ランチョンセミナー8 診療放射線技師に必要な急性腹症における CT 画像所見の
ポイント~撮影法から読影まで~.日本診療放射線技師会,第 28 回診療放射線技師学術大 会,名古屋市,2012.9.
7) 寺澤和晶:CT 検査‐Dual Energy(造影技術).第 68 回日本放射線技術学会総会学術大会,
横浜市,2012.4.
8) 寺澤和晶:CT 検査‐造影技術1.第 39 回日本放射線技術学会秋季学術大会,神戸市,2011.
10.
9) 寺澤和晶:CT 検査‐造影-2(頭頸部・胸部).第 67 回日本放射線技術学会総会学術大会,
横浜市,2011.4.
10) 寺澤和晶:CT 検査‐下肢造影技術.第 38 回日本放射線技術学会秋季学術大会,仙台市,
2010.10.
11) 寺澤和晶:CT 基礎‐造影管理.第 66 回日本放射線技術学会総会学術大会,横浜市,
2010.4.
12) 寺澤和晶:CT 検査‐造影技術.第 37 回日本放射線技術学会秋季学術大会,岡山市,2009.
10.
13) 寺澤和晶:一般演題セッションⅥ.日本放射線技師会,平成 19 年度南関東地域診療放射線
技師学術大会,長野市,2007.10.
14) 寺澤和晶:CT 検査‐造影技術(その他).第 35 回日本放射線技術学会秋季学術大会,名古
屋市,2007.11.
15) 寺澤和晶:CT 検査.日本放射線技術学会,第 48 回関東部会研究発表大会,甲府市,2002.
2.
その他4(認定資格)
1) Ai 認定診療放射線技師(オートプシー・イメージング学会,日本診療放射線技師会),2015.
10.
2) 臨床実習指導教員(公益社団法人 日本診療放射線技師会),2013.3.
26
3) 医療画像情報精度管理士(公益社団法人 日本診療放射線技師会),2013.3.
4) X 線 CT 認定技師(特定非営利活動法人 日本 X 線 CT 専門技師認定機構),2012.9.
5) 放射線機器管理士(公益社団法人 日本診療放射線技師会),2009.3.