INVITED PAPER
Special Section on Electronic DisplaysA Quantitative Evaluation Method for Luminance and Color Uniformity of a Display Screen Based on Human Perception
Kunihiko NAGAMINE†a), Satoshi TOMIOKA†, Tohru TAMURA††,andYoshihide SHIMPUKU†,Nonmembers
SUMMARY We developed a quantitative evaluation method for lumi- nance and color uniformity on a display screen. In this paper, we report the analysis result of a viewer perception of luminance and color unifor- mity. In experiments, observers subjectively evaluated Mura images which were showed on the light emitting diode (LED) backlight screen by ad- justing the luminance of each LED. We measured the luminance and color distributions of the Mura images by a 2D colorimeter, then, the measured data was converted into S-CIELAB. In S-CIELAB calculations, two di- mensional MTF (Modulation Transfer Function) of human eye were used in which anisotropic properties of the spatial frequency response of hu- man vision were considered. Some indexes for a quantitative evaluation model were extracted by the image processing. The significant indexes were determined by the multiple regression analysis to quantify the degree of uniformity of the backlight screen. The luminance uniformity evalua- tion model and color uniformity evaluation model were derived from this analysis independently. In addition, by integrating both of these models we derived a quantitative evaluation model for luminance and color uneven- ness simultaneously existing on the screen.
key words: luminance uniformity, color uniformity, subjective evaluation, quantitative evaluation method
1. Introduction
For more accurate color rendering and environmental con- siderations, light emitting diodes (LEDs) are now used for backlighting in liquid crystal displays (LCDs). With direct LED backlighting, however, local non-uniformity called
“Mura” commonly occurs due to the unevenness of the light emission. As a result, the picture deteriorates. Numerous studies on quantitative evaluation techniques of luminance uniformity have been carried out [1]–[5]. In one study a formula was proposed to estimate the just noticeable differ- ence (JND) contrast on various background luminance lev- els using distinct Mura shapes such as rectangles, circles and lines of various sizes [6]. This method is expected to be useful for detecting major defects on display panels, but for the indistinct Mura caused by optical errors in the display device such as the light source defects or, optical sheets or mechanical distortion of LCD module, a quantitative unifor- mity evaluation method has not been established. Visual in- spection conducted by experienced inspectors is commonly used to evaluate display screen uniformity. The visual in- spection is the predominant method to evaluate indistinct Mura, although the inspection usually requires more time
Manuscript received February 24, 2012.
Manuscript revised May 31, 2012.
†The authors are with SONY Co., Tokyo, 108-0075 Japan.
††The author is with Tokyo Polytechnic University, Atsugi-shi, 243-0297 Japan.
a) E-mail: [email protected] DOI: 10.1587/transele.E95.C.1699
and higher cost. Therefore a need exists to inspect Mura us- ing optically measured criteria that correspond with human perception.
In our previous studies, the relationship between hu- man perception and photometric data was investigated to quantify the degree of uniformity of a screen [7], [8]. In these studies, quantitative evaluations of luminance unifor- mity and color uniformity were investigated independently, even though luminance unevenness and color unevenness si- multaneously exist in general. In the present study, we re- port a method for quantitative uniformity evaluation of a dis- play screen on which both luminance unevenness and color unevenness simultaneously exist.
2. Experimental Method
2.1 Apparatus
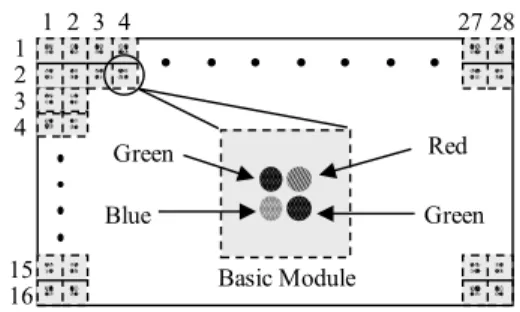
A 40-inch liquid crystal display (SONY KDL-40X5000) and the backlight screen (40-inch diagonal) were prepared for the experiment. The backlight screen was composed of 448 basic modules consisting of red, green and blue LEDs and a diffuser plate on it. The green LED was used for two in one basic module. The basic modules were arrayed in a matrix of 28×16 as shown in Fig. 1.
This backlight screen was produced to reproduce eval- uation stimuli of Mura for the experiment. The luminance of each LED could be controlled independently to change the brightness, the chroma and the hue of the basic module. The backlight screen was adjusted to a brightness of 170 cd/m2 and a chromaticity of D65 to define the background. The result of measurement data in whole screen showed that the average of the brightness was 171 cd/m2and the maximum brightness difference was 2.6 cd/m2. The maximum chro- maticity difference of CIE x and y was 0.0014 and 0.0018,
Fig. 1 Backlight design.
Copyright c2012 The Institute of Electronics, Information and Communication Engineers
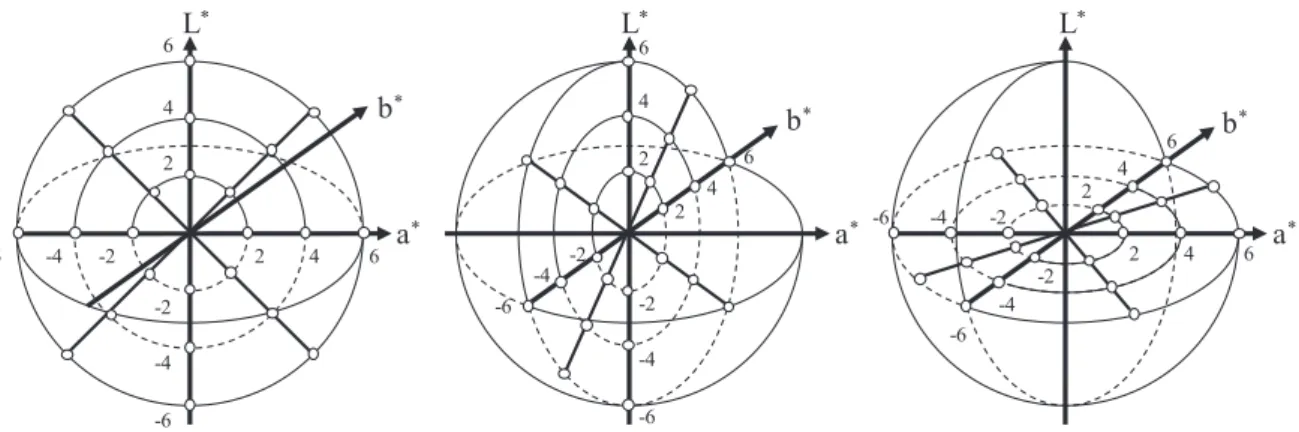
Fig. 2 “Basic Mura” conditions (◦symbol is defined as “Basic Mura” in the L∗a∗b∗color space).
Fig. 3 Eight areas of the backlight screen.
respectively, on whole screen. Then, to simulate the Mura for evaluation, “Basic Mura” conditions were determined in the L∗ a∗ b∗ color space, as shown in Fig. 2. Every basic module was able to control according to these conditions to create the Mura on this backlight screen.
2.2 Evaluation Stimulus
The ITU-R five-grade impairment scale [9] is well known as a method for subjective assessment of image quality. How- ever, it is necessary to obtain a subjective evaluation value of Mura as a continuous and proportional scale to show the continuous relation between the characteristics of the Mura image and the subjective evaluation value. In the ex- periment, observers evaluated evaluation stimuli comparing with a standard stimulus by the magnitude estimate (ME) method [10]. Evaluation stimuli and a standard stimulus were created by a following procedure for the experiment.
To create evaluation stimuli, eight areas were defined as shown in Fig. 3 for the arrangement of basic Mura. The basic modules were arrayed in a matrix of 7×8 per area.
Three areas were randomly chosen from the eight areas, and the basic Mura was randomly arranged in each of these three areas. The degree of non-uniformity was controlled by the level of the basic Mura conditions and the number of modules applied. The combination matrices of the ba- sic Mura conditions and the number of applications in one area are shown in Table 1. According to (a) in Table 1, nine combinations of the basic Mura and module numbers are applied. The basic Mura conditions were randomly cho-
Table 1 The combination matrix of “Basic Mura” conditions.
sen depending on the level of ΔE∗ab in each combination.
For instance combination whose ΔE∗ab level is 2,4,6, basic mura were randomly chosen from all the basic mura con- ditions shown in Fig. 2. Three combinations were chosen from these nine combinations with allowing repeated com- binations. The number of combinations with repetition to choose three conditions from nine is as 165 in all by the following calculation.
C9,3=
9+3−1 3
=(9+3−1)!
3! (9−1)! =165 (1) Based on the previous studies [7], [8], luminance uni- formity evaluation values and color uniformity evaluation values were computed for these 165 evaluation stimuli. And sum of these evaluation values were computed for a ref- erence of the degree of non-uniformity. All the combina- tions were sorted in ascending order and then referring with this reference data, 15 combinations were chosen so that the interval of each reference value became equal. Then, the evaluation stimuli of the mixtures of luminance and color unevenness were created to provide a diverse degree of non-uniformity to the evaluation stimuli according to this method. To reduce the influence of multicollinearity in a multiple regression model for a further statistical analy- sis, additional evaluation stimuli were created which should
have low correlation between luminance evaluation value and color uniformity evaluation value. To assure indepen- dency of the luminance and color evaluation value, in addi- tion to the above 15 evaluation stimuli, another 30 evalua- tion stimuli were created so as to keep the same degree of luminance uniformity with the above 15 evaluation stimuli and varied the degree of color uniformity. (15 evaluation stimuli were created by adding only uneven color areas to three of remaining five areas and 15 evaluation stimuli were created by adding only uneven color areas to five of remain- ing five areas.) Then, 45 evaluation stimuli were created.
To validate the luminance and color uniformity eval- uation model [7], [8], 32 uneven luminance stimuli and 20 uneven color stimuli were created by the same method as the above method according to Tables 1(b) and (c), respec- tively. One uniform white stimulus was also tested in the experiment. In total, 98 kinds of evaluation stimuli were prepared for the experiment.
A standard stimulus was prepared aside from the eval- uation stimuli. A bitmap image was shown on the LCD-TV as a standard stimulus. A bitmap image was made by taking a picture of the backlight screen image on which an eval- uation stimulus was shown. Because the observer tends to be having difficulty in doing a good evaluation in our ex- perience, the degree of non-uniformity was defined slightly lower than the average of evaluation stimuli so that the ob- servers could evaluate them more easily. According to this sense, several bitmap images were made and one bitmap im- age was determined as a standard stimulus.
At first the luminance uniformity evaluation model [7]
was verified using 32 uneven luminance evaluation stimuli.
And then the color uniformity evaluation model [8] was ver- ified using 20 uneven luminance evaluation stimuli. Finally by using 45 evaluation stimuli of the mixtures of luminance and color unevenness, a quantitative uniformity evaluation model on which both luminance and color unevenness si- multaneously exist was investigated.
2.3 Observers and Experimental Conditions
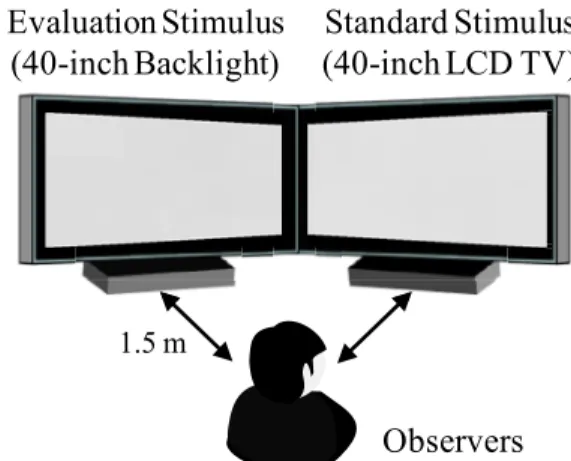
The observers were 20 males and 20 females aged 19 to 24 years. Their decimal visual acuity was better than 0.7 and they had no color vision deficiencies. The visual properties of all observers were tested before the experiment. The ex- periments were conducted in the dark room. The backlight and an LCD TV were arranged side by side (Fig. 4). The evaluation stimulus was presented on the backlight screen and the standard stimulus was presented on the LCD TV.
Observers evaluated the screen uniformity at a distance of 1.5 m from the screen.
In the experiment, observers were asked to assign their own numerical value to the perceived degree of uniformity of the evaluation stimulus in comparison with the degree of uniformity of standard stimulus by the magnitude estimate (ME) method [10]. These values were standardized such that each observer’s average of all conditions was equal to 0 and the standard deviation was equal to 1, because the raw
Fig. 4 Diagram of the subjective evaluation experimental method.
evaluation values had different ranges and variations among observers. We refer to the standardized values as ME values.
A higher ME value shows a worse evaluation of the degree of uniformity. In all 98, evaluation stimuli were evaluated, and the average ME value for each evaluation stimuli were used for further analysis.
3. Results
3.1 Measurement Data Processing Method
The optical properties of the evaluation stimuli were measured using a two-dimensional luminance colorimeter (ICAM-3FW, DELTA, 1280×960 pixels). The measure- ment data (CIE YXZ) were processed with a 5×5 median filter. This is important to eliminate the noise caused by the measurement equipment or the conditions [8].
The measurement data were converted to L∗ and C∗ab (Cab∗ = √
a∗2+b∗2) values using the extended S-CIELAB model [11]. In the S-CIELAB calculations, the measure- ment data were transformed into opponent-color space de- fined as three dimensions described w/k, r/g, and b/y chan- nels. The w/k channel is a luminance component. The r/g and the b/y channel are chromaticity component of red to green and blue to yellow, respectively. Each of the opponent-color data was convolved with the visual spatial sensitivity filter for that color dimension. Then, the filtered data were transformed to CIELAB [12].
Two dimensional isotropic MTF (Modulation Transfer Function) filters are used in S-CIELAB model. However the spatial frequency response has the property of direc- tion dependence in the human vision [13]. Therefore, this anisotropic property of the spatial frequency response in hu- man vision is considered in the extended S-CIELAB. It was proposed to measure color reproduction errors of digital im- ages more suitable for human vision. In this study, we ex- amine the prediction of the uniformity evaluation model for ME values by using L∗and C∗abcalculated by the extended S-CIELAB model. The L∗data were used to analyze the lu- minance uniformity evaluation and the C∗ab data were used
Table 2 The multiple regression analysis result (Luminance uniformity).
to analyze the color uniformity evaluation.
3.2 Luminance Uniformity Evaluation Method
The mean L∗ value of all pixels in the active area of the backlight screen was calculated for 32 uneven luminance evaluation stimuli. The difference between the mean value and the actual L∗values of each pixel was subsequently cal- culated in the same area. Then, the following four indexes were computed by the image processing, as described in the following (a) through (d). (a) The “high and low luminance area” was determined as the ratio of the pixel counts whose L∗difference was larger than 0.3 to all pixel counts in the active area. (b) The “maximum luminance difference” was determined as the maximum L∗difference in the active area.
A 3×3 Sobel filter was used to extract the area of the lumi- nance gradient. A pixel of a luminance gradient larger than 0.5 was determined as the luminance edge. This threshold value corresponds to a luminance gradient of 0.5/mm on the backlight screen. (c) The “Luminance edge area” was de- termined as the ratio of the pixel counts of the detected lu- minance edge to all pixel counts in the active area. (d) The
“number of luminance edges” was determined as the count of the number of edges. These four indexes were revealed as significant factors for predicting the degree of luminance uniformity [7]. Because in this present study the median filter process was added to eliminate the noise, the multi- ple regression analysis was carried out to verify the previ- ous evaluation model. Multiple regression analysis was car- ried out to determine significant factors for predicting the ME value as a dependent variable with these four indexes as explanatory variables. The analysis result showed that the three indexes which were (a) The “high and low lumi- nance area”, (b) The “maximum luminance difference”, and (c) The “luminance edge area” are significant for predicting the ME value (Table 2). The following multiple regression model was obtained to calculate the predicted ME values.
YLum=1.901Xa+0.186Xb+19.922Xc−1.794 (2) YLum: Predicted ME value for luminance uniformity Xa: Value of the “high and low luminance area”
Xb: Value of the “maximum luminance difference”
Xc: Value of the “luminance edge area”
In the previous study, the “number of edges” was cho- sen as a significant index to predict the ME value. However,
Fig. 5 Correlation between the experimental ME values and the predicted ME values (luminance uniformity).
it was not chosen as a significant factor in the present study.
In the present study, a median filter process was added to eliminate noise; therefore, the luminance edge caused by the noise might be eliminated. For this reason the “num- ber of luminance edges” was not extracted as a significant factor. Even if the number of explanatory variables was re- duced from 4 to 3, a high correlation still existed between the predicted ME values and the experimental ME values in the analysis of the 32 evaluation stimuli, as shown in Fig. 5.
Therefore it is considered that the above model is more suit- able for predicting the ME values of the luminance unifor- mity, and this model is proposed for the luminance unifor- mity evaluation.
3.3 Color uniformity Evaluation Method
The following model was proposed in our previous study [8]. Color uniformity evaluation method was investigated with modified C∗ab (C∗ab=
(αa∗)2+b∗2α=1.4) consider- ing with the hue influence to human perception. And three indexes as described in the following (e) through to (g) were derived as significant factors for predicting the degree of color uniformity. (e) The “uneven color area” was deter- mined as the ratio of the pixel counts whose C∗abvalue was larger than 2.0 to all pixel counts in the active area. (f) The
“maximum chroma” was determined as the maximum C∗ab value in the active area. A 3×3 Sobel filter was used to extract the area of the chroma gradient. A pixel of a chroma
gradient larger than 2.0 was determined as the chroma edge.
This threshold value corresponded to the chroma gradient of 2.0/mm on the backlight screen. (g) The “chroma edge area”
was determined as the ratio of the detected chroma edge to all pixel counts in active area. And the following formula was proposed.
YColor =3.965Xe+0.016Xf +12.757Xg−1.523 (3) YColor: Predicted ME value for color uniformity
Xe: Value of the “uneven color area”
Xf: Value of the “maximum chroma”
Xg: Value of the “chroma edge area”
To validate the above evaluation model 20 color unifor- mity evaluation stimuli were used for the analysis. The pre- dicted ME values were computed based on the above model with the 20 color uniformity evaluation stimuli. As shown in Fig. 6, a high correlation existed between the predicted ME values and the experimental ME values in the analysis of the 20 evaluation stimuli. It was confirmed that this model was able to predict the degree of color uniformity accurately.
3.4 Integration of Luminance and Color Uniformity Eval- uation Method
As described above, the luminance uniformity evaluation model and color uniformity evaluation model were derived from the analysis of each evaluation stimulus. However, lu- minance unevenness and color unevenness simultaneously exist in general. Therefore a general uniformity evaluation
Fig. 6 Correlation between the experimental ME values and the predicted ME values (color uniformity).
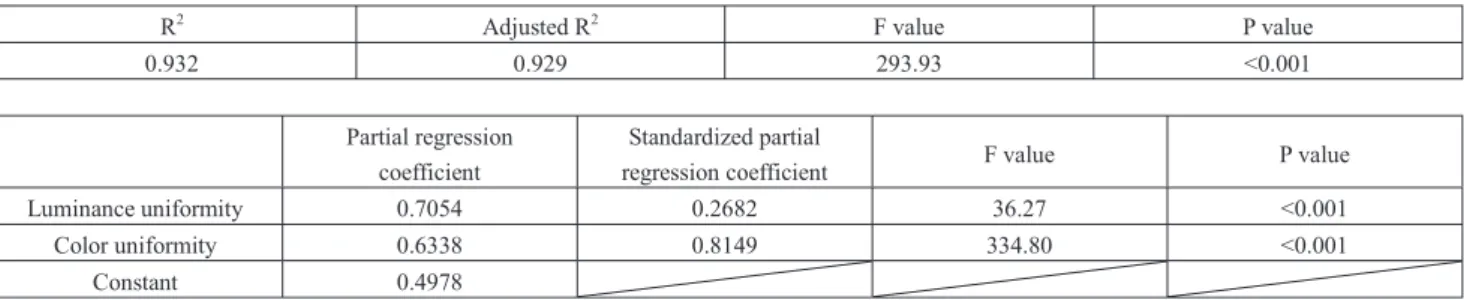
Table 3 The multiple regression analysis result (luminance and color uniformity).
method was investigated by analyzing 45 evaluation stim- uli mixtures of luminance and color unevenness. A linear equation model was investigated by involving the luminance evaluation value and the color uniformity evaluation value.
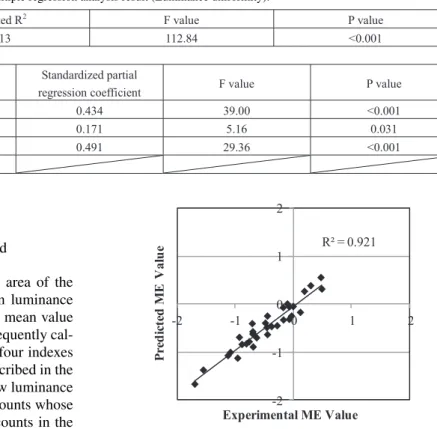
The YLumand YColorvalues of these evaluation stimuli were computed using Eqs. (2) and (3), respectively. To derive a general uniformity evaluation model, a multiple regression analysis was carried out with the ME values as dependent variables and the luminance uniformity evaluation values (YLum) and color uniformity evaluation values (YColor) as explanatory variables. The analysis results are shown in Table 3, and the following multiple regression model was derived from the analysis.
YGen=0.705YLum+0.634YColor+0.498 (4) YGen: Predicted ME value of the general uniformity evalua- tion
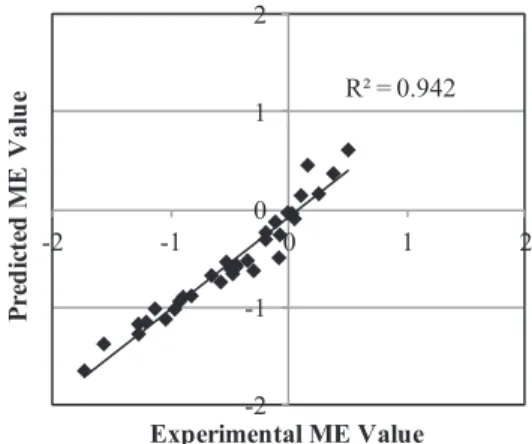
The predicted ME values of the 45 evaluation stimuli were computed based on this model. As shown in Fig. 7, a high correlation existed between the predicted ME val- ues and the experimental ME values in the analysis of the 45 evaluation stimuli. A very accurate uniformity evalua- tion model was obtained by integrating both the luminance and the color evaluation models. Therefore, we propose this multiple regression model as a general uniformity evalua- tion model.
Fig. 7 Correlation between the experimental ME values and the pre- dicted ME values (integrated uniformity of luminance and color uneven- ness).
4. Verification of the Evaluation Models
4.1 Apparatus and Evaluation Stimulus
To verify the above three uniformity evaluation models, a second experiment was conducted. The same apparatus was used in this experiment. The condition of the backlight and the LCD-TV were also the same condition as those in the first experiment. However, all the following evaluation stim- uli were remade by the same method used in the first experi- ment: 32 uneven luminance evaluation stimuli, 20 color un- even evaluation stimuli and 45 luminance and color uneven evaluation stimuli. The same combination matrix in the first experiment was used to create the evaluation stimuli, but the arrangement of the basic Mura condition was re-defined at random. The same standard evaluation stimulus as the first experiment was used in this experiment.
4.2 Observers
In this experiment, another 50 observers (25 male and 25 female) evaluated the degree of uniformity of all the evalua- tion stimuli with the same procedure and conditions as those in the first experiment. The same observers as the first ex- periment were not included in this experiment. Then, the ME values were obtained for all evaluation stimuli.
4.3 Experimental Result
The luminance uniformity evaluation values with 32 lumi- nance uniformity evaluation stimuli and color uniformity evaluation values with 20 color uniformity evaluation val- ues were computed by each evaluation model. As shown in Figs. 8 and 9, a high correlation obtained between the predicted ME values and the experimental ME values in the analysis of each evaluation stimulus. Also, the general uniformity evaluation values were computed with 45 lumi- nance and color uniformity evaluation stimuli. As shown in Fig. 10, a high correlation obtained between the predicted ME values and the experimental ME values in the analysis of the 45 evaluation stimuli. Based on these verification re- sults, the accuracy of all the uniformity evaluation models was confirmed.
5. Discussion
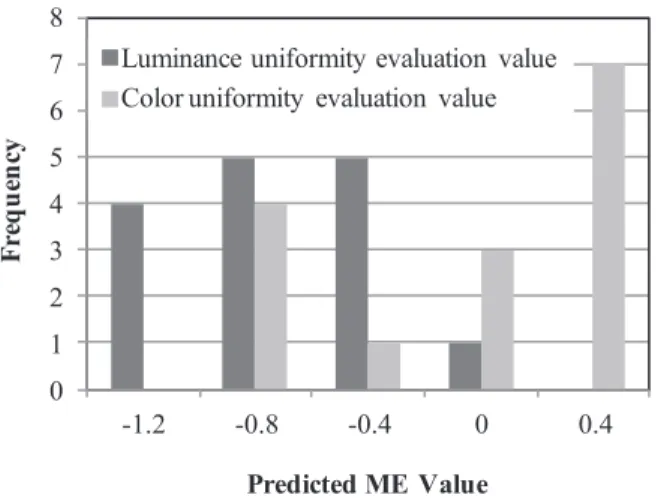
To reveal the influence of uneven luminance and uneven color to the human perception, 15 evaluation stimuli mix- ture of luminance and color unevenness were analyzed. The predicted ME values of luminance and color uniformity with these 15 evaluation stimuli were computed by using formula (2) and (3) respectively as shown in Fig. 11 (result from the first experiment) and Fig. 12 (result from the second ex- periment). The distribution of the predicted ME values of the color uniformity evaluation shifted to larger values than those of the luminance uniformity evaluation however the
Fig. 8 Correlation between the experimental ME values and the predicted ME values (luminance uniformity).
Fig. 9 Correlation between the experimental ME values and the predicted ME values (color uniformity).
Fig. 10 Correlation between the experimental ME values and the pre- dicted ME values (integrated uniformity of luminance and color uneven- ness).
basic mura condition was randomly chosen in these 15 eval- uation stimuli. The threshold value of the uneven area and the uneven edge area for the luminance uniformity evalua- tion were much lower than those for the color uniformity evaluation as described in Sect. 3. And as shown in the statistics parameters in Table 3, the standardized partial re-
Fig. 11 Distribution of the predicted ME values (Result from 1st experiment).
Fig. 12 Distribution of the predicted ME values (Result from 2nd experiment).
gression coefficient of the color uniformity was higher than that of the luminance uniformity. These results may indi- cate that the observers perception of luminance unevenness is more sensitive than that of color unevenness, whereas the observer may evaluate severe for color uniformity once they perceive color unevenness on the screen.
6. Conclusion
In this paper, a luminance evaluation model was proposed.
The accuracy of the evaluation model for color evaluation was confirmed. By integrating these models, a highly ac- curate model was also proposed to evaluate the degree of general uniformity. These evaluation models were verified by a second experiment. The accuracy of all three unifor- mity evaluation models was confirmed. We used the LED backlight to simulate both luminance Mura and color Mura independently in the experiment. However, these proposed uniformity evaluation models are generally applicable for evaluating a display screen, and so are useful for developing display devices. In addition, it may indicate that the ob-
servers’ perception of luminance unevenness is more sensi- tive than that of color unevenness, whereas the observer may evaluate severe for color uniformity once he or she perceives color unevenness on the screen.
References
[1] R. Yoshitake, T. Tamura, and A. Tsuji, “A proposal for a quantitative model of “Mura” level of LCDs on the basis of human senses,” J.
ITE, vol.56, no.7, pp.1153–1158, 2002.
[2] Y. Mori, T. Tamura, R. Yoshitake, K. Moriguchi, K. Tanahashi, and S. Tsuji, “Ergonomics approach to evaluate minimum perceivable non-uniformity in liquid crystal displays,” Proc. 9th International Display Workshops, pp.1315–1318, 2002.
[3] T. Tamura, K. Tanaka, M. Baba, M. Suzuki, and T. Furuhata, “Just Noticeable Difference (JND) contrast of “Mura” in LCDs on the five back-ground luminance levels,” Proc. IDW ‘04, pp.1623–1626, 2004.
[4] T. Tamura, K. Tanaka, T. Satoh, and T. Furuhata, “Relation between Just Noticeable Difference (JND) contrast of “Mura” in LCDs and its background luminance,” Proc. IDW ‘05, pp.1843–1846, 2005.
[5] T. Kishi, M. Akutsu, and T. Ohtani, “Quantitative method of “Mura”
based on MTF of the human visual system,” J. Institute of Image Information and Television Engineers, vol.60, no.5, pp.789–796, 2006.
[6] T. Tamura, T. Satoh, T. Uchida, and T. Furuhata, “Quantitative eval- uation of luminance non-uniformity “Mura” in LCDs based on just noticeable difference (JND) contrast at various background lumi- nances,” IEICE Trans. Electron., vol.E89-C, no.10, pp.1435–1440, Oct. 2006.
[7] Y. Masakura, T. Tamura, K. Nagamine, S. Tomioka, M. Ueda, and Y. Shimpuku, “A quantitative evaluation method for luminance non-uniformity of a large LED backlight,” IEICE Trans. Electron., vol.E93-C, no.11, pp.1564–1571, Nov. 2010.
[8] K. Nagamine, S. Tomioka, T. Tamura, and Y. Shimpuku, “Quan- titative evaluation method for color uniformity of a display screen based on human perceptions,” Proc. 31st International Display Re- search Conference Euro Display 2011, Session 10.3, 2011.
[9] “Recommendation 500-10; Methodology for the subjective assess- ment of the quality of television pictures,” ITU-R Recommenda- tions, 2000.
[10] S.S. Stevens, “On the psychophysical law,” Psychological Review, vol.64, no.3, pp.153–181, 1957.
[11] T. Ishihara, K. Ohishi, N. Tsumura, and Y. Miyake, “Dependence of directivity in spatial frequency response of the human eye (2) — Mathematical modeling of modulation transfer function,” The Jour- nal of the Society of Photographic Science and Technology of Japan, vol.65, pp.128–133, 2002.
[12] X. Zhang and B. Wandell, “A spatial extension of CIELAB for digi- tal color image reproduction,” J. SID, vol.5, pp.61–63, 1997.
[13] T. Ishihara, K. Ohishi, N. Tsumura, and Y. Miyake, “Dependence of directivity in spatial frequency response of the human eye (1) — Measurement of modulation transfer function,” J. Society of Pho- tographic Science and Technology of Japan, vol.65, pp.121–127, 2002.
Kunihiko Nagamine received his B.E. de- gree in mechanical engineering in 1993 from the Chiba University, Japan. He has been with Sony Co., since 1993, where he has engaged in the development of display devices. He is currently working in the area of the development of eval- uation system for displays.
Satoshi Tomioka received the B.E. degree in applied physics in 1991 and M.E. degree in Crystalline Materials Science in 1993 from Na- goya University, Japan. Since 1993, he has been with Sony Co. During 1993–1999, he worked on laser diode for Blu-ray system. For the past ten years, he has been a display device devel- opment engineer, and now, work on evaluation system of displays.
Tohru Tamura received his B.Sc. and Dr. Eng. degrees from the Tokyo Institute of Technology in 1985 and 1990, respectively. In 1990, he joined IBM Japan Ltd., where he was engaged in research and development of liquid- crystal displays. Since 1998 he has been with Department of Image Information Engineering, Tokyo Polytechnic University. He is now a Pro- fessor. His research fields of interests are hu- man vision, Kansei engineering, image process- ing and display system.
Yoshihide Shimpuku is General Man- ager of Visual Systems Development Depart- ment Core Technology Development Group, at Sony. He received Ph.D. degree from Osaka University in 1993.