Relationship between spinal range of motion and trunk muscle activity during trunk rotation
TOMOAKI SUGAYA, RPT, MS1, 2), MASAAKI SAKAMOTO, RPT, PhD1), RIE NAKAZAWA, RPT, PhD1) NAOKI WADA, MD, PhD3)
1) Graduate School of Health Sciences, Gunma University, Japan
2) Department of Rehabilitation, Gunma University Hospital: 3-39-15 Syowa, Maebashi, Gunma 371-8511, Japan.
TEL: +81 27-220-8532, FAX: +81 27-220-8532
3) Department of Rehabilitation Medicine, Gunma University Graduate School of Medicine, Japan
Abstract.
[Purpose] The aim of this study was to clarify the relationship between spinal range of motion and trunk muscle activity during trunk rotation using a three-dimensional motion analysis system and surface electromyography. [Subjects and Methods] The subjects comprised 11 healthy men. A three-dimensional motion analysis system measured the trunk rotational angle of 4 segments of the thoracic vertebrae and 2 segments of the lumbar vertebrae. Surface electromyography measured the activities of the unilateral latissimus dorsi, lumbar multifidus, rectus abdominis, external oblique, internal oblique, and transversus abdominis muscles. [Results] During ipsilateral rotation at thoracic vertebral levels, the muscle activity of the latissimus dorsi and external oblique was significantly increased compared with the activity in the 0-10% range of trunk rotation. During early ipsilateral rotation at lumbar vertebral levels, the muscle activity of the internal oblique and transversus abdominis was significantly increased compared with that in the 0-10%
range of trunk rotation. During contralateral rotation at both thoracic and lumbar vertebral levels, the muscle activity of the external oblique was significantly increased compared with that in the 0-10% range of trunk rotation. [Conclusion]
This study indicates that it is important to consider vertebral segments and spinal range of motion during trunk rotation.
Key words: Trunk rotation, Three-dimensional motion analysis, Surface electromyography
INTRODUCTION
Trunk rotation is involved in various activities, from walking to sports. Trunk rotation is a key risk factor for low back pain1, 2). During rotation, the external oblique (EO), rectus abdominis (RA) and lumbar multifidus (MF) muscles act contralaterally, whereas the latissimus dorsi (LD), internal oblique (IO) and transversus abdominis (TrA) muscles act ipsilaterally3-6). Trunk rotation is a motion involving both thoracic and lumbar vertebrae.
However, previous studies have only examined trunk rotation in a general sense. Furthermore, little has been reported about the relationship between the level of trunk muscle activity and spinal range of motion during trunk rotation. Recently, a method for calculating the rotational angle of each spinal segment during trunk rotation was
developed using a three-dimensional motion analysis in trunk rotation7). Therefore, the range of motion during trunk rotation for specific segments of the spinal column was evaluated in the current study. The aim of this study was to clarify the relationship between spinal range of motion and trunk muscle activity during trunk rotation.
SUBJECTS AND METHODS
Subjects
The study subjects consisted of 11 healthy volunteer men with no history of orthopedic or neurological disorders and no lumbar symptoms during the prior 3 months (age: 26.5±3.3 years; height: 173.2±4.5 cm;
weight: 65.4±3.9 kg). The Ethics Committee of Gunma University approved this study (approval code 15-30)
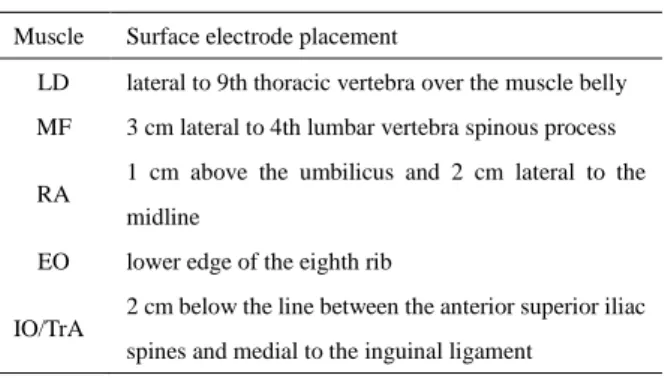
Table 1. Electrode placement for EMG recording of the trunk musculature
LD = latissimus dorsi, MF = lumbar multifidus, RA = rectus abdominis, EO = external oblique, IO/TrA = internal oblique and transversus abdominis
which was conducted in accordance with the Declaration of Helsinki. Written informed consent was obtained from all participants and the rights of all subjects were protected.
Methods
Surface electromyography (EMG) was acquired using a cordless EMG (MQAir, Kissei Comtec Co., Ltd., Japan) with a 10-1000 Hz bandwidth and a common mode rejection ratio >93 dB. Muscle activity was recorded over the two right back muscles and the four abdominal muscles: LD, MF, RA, EO, IO and TrA. Electrode placement is shown in Table 18-12). In our previous study, it was reported that the IO and TrA performed the same functions13); therefore, it was the same electrode placement of the IO and TrA in this study. All recordings were acquired using hydro-gel and disposable Ag/AgCl electrodes (38 mm × 19 mm). Following careful skin preparation, electrodes were placed parallel to the muscle fibers with a center-to-center distance of 30 mm. As a normalization reference, EMG data were sampled during three 5-s trials of manually resisted maximal voluntary contraction (MVC) for each muscle.
Marker positions were acquired using a motion capture system (VICON Motion System Ltd, Oxford, UK), operating at a sampling rate of 200 Hz. A total of 22 reflective markers, each with a 9.5-mm diameter, were placed on each of the seven spinal segments, according to the method described by Preuss et al7). The sacral segment (Sx) was defined by three markers over the posterior superior iliac spines and the fifth sacral vertebra (S5). Similarly, the lower lumbar segment (LLx) was defined by three markers placed 50 mm lateral to the spinous process of the third lumbar vertebra (L3) and over the first sacral vertebra (S1). Moving rostrally, each successive segment was defined by a centrally placed marker below, and two laterally placed markers above.
These markers were placed over, and lateral to, the spinous processes of the L3, 12th, 9th, 6th and 3rd thoracic vertebrae (T12, T9, T6 and T3) and the 7th cervical vertebra (C7). The segments defined by these marker groups were termed upper lumbar (ULx), lower thoracic (LTx), mid-lower thoracic (MLTx), mid-upper thoracic (MUTx) and upper thoracic (UTx) segments, respectively.
Subjects sat with their feet flat on the ground and their arms crossed over their chests. The hip and knee joints were flexed at 90° and the thighs were immobilized with a belt. Rotation began at the -10° position from the acromion level and proceeded in a positive direction until maximum rotation was achieved. Measurements were recorded for each direction. For all measurements, the trunk rotation position of the subjects was corrected.
Movement progressed at a speed sufficient to complete the rotation in approximately 3 s.
Using the analytical software KineAnalyzer (Kissei Comtec Co., Ltd., Japan), the raw EMG data and kinematics data were synchronized. All EMG signals were filtered using a 30-500 Hz band-pass filter and all EMG data were converted to root mean square (RMS) values. The RMS values of MVC were obtained by averaging over 3 trials, the mean value for 3 s of stable waveform in the middle of the recording to provide EMG signal amplitude normalization. For kinematic data, the normal vector of Sx was defined as the basic axis and the normal vector of the other segments was defined as the moving axis. Furthermore, the trunk rotational angle was defined as the angle of the horizontal components in the angle formed by the two normal vectors. The range of trunk rotation for each segment was calculated using the degree positions at the maximal trunk rotation and the 0°
point. For each segment, a normalized ratio of the range was obtained by calculating the ratio of the observed range to the range of maximal trunk rotation at the UTx.
Using this result, each segment’s maximal degree of Muscle Surface electrode placement
LD lateral to 9th thoracic vertebra over the muscle belly MF 3 cm lateral to 4th lumbar vertebra spinous process RA 1 cm above the umbilicus and 2 cm lateral to the
midline
EO lower edge of the eighth rib IO/TrA
2 cm below the line between the anterior superior iliac spines and medial to the inguinal ligament
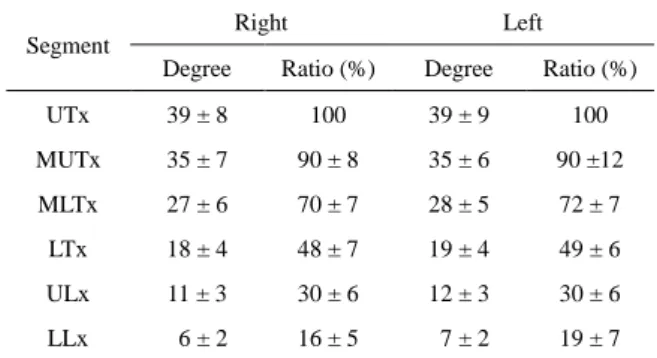
Table 2. Each segment’s maximal degree of rotation and the ratio to that observed for the upper thoracic (UTx) segment
All data are presented as mean ± standard deviation.
UTx = upper thoracic segment (range from C7 to T3), MUTx = mid- upper thoracic segment (range from T3 to T6), MLTx = mid-lower thoracic segment (range from T6 to T9), LTx = lower thoracic segment (range from T9 to T12), ULx = upper lumbar segment (range from T12 to L3), LLx = lower lumbar segment (range from L3 to S1) rotation and the ratio at the UTx were calculated. In
addition, the percentage of the MVC for each muscle split range at an interval of 10% of the ratio was calculated for each segment.
Statistical analyses were performed using IBM SPSS Statistics (Version 22) for Windows. Comparisons of the percentage of the MVC during the 0-10% range of trunk rotation and each split range at an interval of 10% were performed with a Wilcoxon signed rank test with a significance level of 5%. A Bonferroni adjustment with a significance level of 0.55% was performed for all significant differences.
RESULTS
Each segment’s maximal degree of rotation and the ratio to that observed for the UTx are reported in Table 2.
As demonstrated in Table 3, during right (ipsilateral) rotation, the ratio for the LD and EO was significantly increased for all split ranges more than 40-50% in the UTx. Similarly, the ratio for the MF was significantly increased for all split ranges more than 80-90%. In the MUTx, the ratio for the LD and EO was significantly increased for all split ranges more than 80-90%. In the MLTx, the ratio for the MVC in the LD and MF was significantly increased for all split ranges more than 70- 80%; for the EO, all split ranges more than 60-70%; and for the IO and TrA, predominantly in the 50-60% split range. In the LTx, the ratio for the LD was significantly increased for all split ranges more than 50-60%; for the MF, all split ranges more than 70-80%; and for the EO, and all split ranges more than 40-50%. In the ULx, the ratio for the LD was significantly increased for all split ranges more than 60-70%; for the MF, all split ranges more than 80-90%; for the EO, all split ranges more than 40-50%; and for the IO and TrA, all split ranges more than 20-30%. In the LLx, the ratio for the LD was significantly increased for all split ranges more than 80- 90%; for the MF, all split ranges more than 70-80%, except for the 80-90% split range; for the EO, all split ranges more than 50-60%; and for the IO and TrA, all split ranges more than 20-30%, except for the 60-70%
split range.
As demonstrated in Table 4, during left (contralateral)
trunk rotation, the ratio for the LD was significantly increased for all split ranges more than 80-90% in the UTx. Similarly, the ratio for the EO was significantly increased for all split ranges more than 30-40%. In the MUTx and MLTx, the ratio for the EO was significantly increased for all split ranges more than 30-40%. In the LTx, the ratio for the LD was significantly increased for all split ranges more than 70-80%, except for the 80-90%
split range; and for the EO, all split ranges more than 40- 50%. In the ULx, the ratio for the EO was significantly increased for all split ranges more than 40-50%, except for the 60-70% split range. In the LLx, the ratio for the EO was significantly increased for all split ranges more than 40-50%.
Under all conditions, there were no significant differences in the ratio for the RA.
DISCUSSION
In this study, trunk rotational angle was identical for the UTx and MUTx. Previous studies reported that the change in trunk rotational angle from C7 to T3 and from T3 to T6 were identical14, 15). The results of this study indicate that there is a certain ratio of rotational angle for each segment, and suggest that differences in the ratio affect the local range of motion and muscle activities.
Segment
Right Left
Degree Ratio (%) Degree Ratio (%)
UTx 39 ± 8 100 39 ± 9 100
MUTx 35 ± 7 90 ± 8 35 ± 6 90 ±12
MLTx 27 ± 6 70 ± 7 28 ± 5 72 ± 7
LTx 18 ± 4 48 ± 7 19 ± 4 49 ± 6
ULx 11 ± 3 30 ± 6 12 ± 3 30 ± 6
LLx 6 ± 2 16 ± 5 7 ± 2 19 ± 7
Table 3. Right (ipsilateral) rotation: comparison of muscle activity at each split range of rotation for each spinal segment
The percentage of the MVC = Median (25% - 75%), * p < 0.0055. Segment Muscle0-10%10-20%20-30%30-40%40-50%50-60%60-70%70-80%80-90%90-100%
UTxLD2 ( 1 -13)3 ( 2 -14)3 ( 2 -15)3 ( 2 -15)3 ( 3 -15) *4 ( 3 -18) *5 ( 3 -18) *6 ( 4 -13) *7 ( 5 -18) *10 ( 6 -23) *
MF8 ( 4 -16)10 ( 4 -12) 8 ( 5 -13)9 ( 6 -14)8 ( 7 -12)10 ( 8 -14) 11 ( 8 -13)12 ( 1 -14) 13 ( 1 -20) *15 (11-20) *
RA2 ( 1 -13)2 ( 1 -13)2 ( 1 -13)2 ( 1 -13)2 ( 1 -14)2 ( 1 -13)2 ( 1 -14)2 ( 2 -14)3 ( 2 -14)3 ( 2 -14)
EO3 ( 2 -13)3 ( 2 -14)3 ( 2 -14)3 ( 2 -14)4 ( 3 -16) *5 ( 3 -16) *5 ( 4 -17) *7 ( 4 -11) *8 ( 5 -13) *11 ( 7 -15) *
IO/TrA9 ( 2 -13)10 ( 3 -20) 12 ( 4 -20) 12 ( 4 -16) 13 ( 5 -21) 16 ( 6 -22) 18 ( 7 -24) 20 ( 8 -25) 20 ( 9 -34) 20 (11-31)
MUTxLD3 ( 2 -13)3 ( 1 -14)3 ( 2 -14)3 ( 2 -15)3 ( 2 -17)4 ( 3 -18)5 ( 3 -10)6 ( 4 -14)7 ( 4 -19) *10 ( 6 -23) *
MF8 ( 6 -14)8 ( 5 -12)12 ( 5 -14) 9 ( 6 -14)9 ( 6 -13)9 ( 7 -14)9 ( 7 -13)12 ( 9 -19) 12 (11-19)15 ( 1 -21)
RA2 ( 1 -13)2 ( 1 -13)2 ( 1 -13)2 ( 1 -13)2 ( 1 -14)2 ( 1 -13)2 ( 1 -14)2 ( 2 -14)3 ( 2 -14)3 ( 2 -14)
EO2 ( 2 -13)3 ( 2 -14)3 ( 2 -14)4 ( 2 -14)4 ( 2 -15)4 ( 4 -16)5 ( 4 -18)7 ( 5 -12)8 ( 6 -12) *11 ( 7 -14) *
IO/TrA10 ( 3 -16) 9 ( 3 -20)14 ( 5 -16) 13 ( 4 -22) 15 ( 5 -22) 17 ( 6 -29) 18 ( 7 -25) 20 ( 8 -30) 20 ( 9 -38) 20 (11-30)
MLTxLD3 ( 1 -14)2 ( 1 -14)3 ( 2 -14)3 ( 2 -15)3 ( 2 -17)4 ( 3 -18)4 ( 3 -19)7 ( 3 -14) *8 ( 4 -20) *9 ( 6 -22) *
MF8 ( 4 -14)9 ( 4 -11) 12 ( 5 -14) 9 ( 6 -12)10 ( 7 -14) 9 ( 7 -15)9 ( 8 -13)11 ( 9 -18) *13 (11-20) *15 ( 1 -21) *
RA2 ( 1 -13)2 ( 1 -13)2 ( 1 -13)2 ( 1 -13)2 ( 1 -13)2 ( 2 -14)2 ( 2 -14)2 ( 2 -14)3 ( 2 -14)3 ( 2 -14)
EO2 ( 2 -14)3 ( 2 -14)3 ( 2 -14)4 ( 2 -14)4 ( 3 -15)5 ( 3 -16)5 ( 4 -18) *7 ( 5 -12) *8 ( 7 -12) *11 ( 7 -14) *
IO/TrA9 ( 2 -12)10 ( 4 -20) 12 ( 4 -17) 12 ( 5 -23) 15 ( 6 -23) 18 ( 7 -28) *20 ( 8 -25) 21 ( 8 -28) 19 ( 9 -37) 20 (11-31)
LTxLD2 ( 1 -14)3 ( 2 -14)3 ( 2 -14)3 ( 2 -15)3 ( 3 -17)3 ( 3 -17) *4 ( 3 -18) *6 ( 4 -11) *8 ( 5 -18) *10 ( 6 -22) *
MF7 ( 5 -14)9 ( 4 -12)9 ( 6 -12)9 ( 6 -15)10 ( 8 -12) 8 ( 7 -14)10 ( 8 -13) 11 ( 1 -16) *13 ( 1 -22) *15 (11-20) *
RA2 ( 1 -13)2 ( 1 -13)2 ( 1 -13)2 ( 1 -13)2 ( 1 -13)2 ( 1 -14)2 ( 1 -14)2 ( 2 -14)3 ( 2 -14)3 ( 2 -14)
EO3 ( 2 -14)3 ( 2 -13)3 ( 2 -14)3 ( 2 -14)4 ( 3 -15) *5 ( 3 -16) *6 ( 4 -17) *8 ( 4 -11) *8 ( 6 -13) *12 ( 7 -14) *
IO/TrA11 ( 2 -16)9 ( 4 -18)11 ( 4 -19)14 ( 5 -22) 17 ( 6 -25) 19 ( 8 -30) 22 ( 8 -23) 20 ( 8 -25) 20 ( 8 -37) 20 (11-31)
ULxLD2 ( 1 -14)3 ( 1 -13)2 ( 1 -14)3 ( 2 -15)3 ( 2 -17)3 ( 2 -17)4 ( 3 -17) *5 ( 3 -10) *7 ( 4 -17) *9 ( 6 -23) *
MF8 ( 4 -13)7 ( 5 -14)9 ( 5 -12)9 ( 6 -13)10 ( 7 -13) 9 ( 7 -14)9 ( 8 -13)12 ( 8 -16) 15 ( 9 -21) *15 (11-22) *
RA2 ( 1 -13)2 ( 1 -13)2 ( 1 -13)2 ( 1 -13)2 ( 1 -14)2 ( 1 -13)2 ( 1 -14)2 ( 2 -14)3 ( 2 -14)3 ( 2 -14)
EO2 ( 1 -13)2 ( 2 -13)3 ( 2 -14)3 ( 2 -14)4 ( 2 -15) *5 ( 3 -16) *5 ( 4 -17) *7 ( 4 -10) *9 ( 6 -13) *12 ( 7 -14) *
IO/TrA7 ( 3 -10)9 ( 3 -12)11 ( 4 -18) *12 ( 5 -23) *14 ( 6 -22) *18 ( 7 -22) *20 ( 8 -29) *23 ( 8 -28) *21 ( 8 -36) *21 (11-30) *
LLxLD3 ( 1 -15)3 ( 1 -15)3 ( 1 -14)3 ( 2 -15)3 ( 2 -17)4 ( 3 -18)5 ( 3 -19)6 ( 4 -13)9 ( 6 -20) *10 ( 7 -22) *
MF8 ( 3 -15)9 ( 4 -11) 9 ( 6 -14)10 ( 7 -14) 9 ( 7 -13)10 ( 7 -14) 11 ( 9 -12)12 ( 1 -18) *14 ( 9 -19) 16 (11-22) *
RA2 ( 1 -13)2 ( 1 -13)2 ( 2 -13)2 ( 1 -13)2 ( 1 -14)2 ( 2 -13)2 ( 1 -14)2 ( 2 -14)3 ( 2 -14)3 ( 2 -14)
EO3 ( 2 -14)3 ( 1 -15)3 ( 2 -15)4 ( 2 -15)4 ( 3 -16)6 ( 3 -17) *7 ( 4 -19) *8 ( 6 -11) *12 ( 7 -14) *11 ( 7 -14) *
IO/TrA7 ( 3 -19)9 ( 4 -12)11 ( 5 -19) *14 ( 7 -23) *11 ( 8 -30) *16 ( 8 -27) *18 ( 8 -25) 19 ( 8 -28) *18 ( 9 -38) *22 (11-28) *