* Department of Epidemiology, Infectious Disease Con-trol and Prevention, Institute of Biomedical and Health Sciences, Hiroshima University, Hiroshima
2* Hiroshima Prefectural Hospital, Hiroshima
Address correspondence to: Tomoki Sato, Department of Epidemiology, Infectious Disease Control and Preven-tion, Institute of Biomedical and Health Sciences, Hiroshima University, 1–2–3 Kasumi, Minami-ku, Hiroshima 734–8551, Japan.
Evaluation of strategies for control and prevention of pandemic in‰uenza
(H1N1pdm) in Japanese children attending school in a rural town
Simulation using mathematical models
Tomoki S
ATO*
,2*, Tomoyuki A
KITA* and Junko T
ANAKA*
Objectives In 2009, epidemics of in‰uenza (H1N1pdm) occurred worldwide. We evaluated 4 strate-gies for control and prevention of in‰uenza(treatment with antiviral drugs, preventive actions, cancellation of large events, and school closures) by surveying the H1N1pdm epidemic in a ge-ographically isolated rural town in Japan, and applying the epidemic to mathematical models. Methods Subjects were 291 children attending nursery, primary, and junior high schools in Kounu town. The 4 strategies were evaluated by 3 types of mathematical models with varying parameters.
Results The total number of infected cases, as reported in questionnaires, was 120. In the best-ˆtting model, treatment with antiviral drugs shortened the epidemic period from 31 to 23 days. Event cancellation reduced the total number of infected cases from 127.1 to 87.6 and the maximum number of cases from 63.7 to 41.7. In this simulation, 56 people were aŠected by the interven-tion. Immediate school closure reduced the total and maximum numbers of infected cases to 62.6 and 23.1, respectively.
Conclusion Statistical analysis conˆrmed that event cancellation and school closure are eŠective strate-gies for control of an in‰uenza epidemic. The eŠective contact rate varied, which re‰ects a localized and rapidly spreading epidemic in a subpopulation.
Key wordsin‰uenza, mathematical modeling, prevention, health policy, in‰uenza vaccines
INTRODUCTION
In‰uenza viruses have high infectivity. In the global epidemic of 2009, young people were infected with the pandemic in‰uenza strain H1N1 (H1N1pdm)1)
be-cause of its novel genetic characteristics, although it was very similar to the 1918 strain A/H1N1. Although there is a commonly held view that antiviral drug treatment, wearing a mask, vaccination, event cancel-lation, and school closures are eŠective in preventing and controlling in‰uenza, it is important to evaluate these strategies on the basis of actual survey data to de-termine which strategy is most eŠective.
In Japan, the use of antiviral drugs and preventive actions, such as vaccination, are encouraged and widespread among the general population. National
guidelines recommended school closure during the H1N1pdm epidemic in 2009, but this action was not always implemented appropriately. Moreover, during the epidemic, the cancellation of events was left to the discretion of organizers rather than being mandated by law.
Therefore, in this study, we aimed to evaluate and compare the eŠectiveness of the primary strategies used for H1N1pdm control and prevention, i.e., treat-ment with antiviral drugs, preventive actions such as wearing a mask or vaccination, event cancellation, and school closures. Evaluation was performed using mathematical modeling based on survey data taken from a discrete area.
A survey of children was possible in Kounu town, Hiroshima, Japan because of its geographic features (it is separated from other towns by mountains). The total registered school-going population in Kounu town was 291 as of April 1, 2010. All children who had in‰uenza were prevented from attending school during the infectious period by the School Health Law. Therefore, it was possible to conduct an almost com-plete survey of schoolchildren aged 1 to 15 years dur-ing the period.
An SIR model describes the reciprocal relationship among the groups2), but it is believed that this model
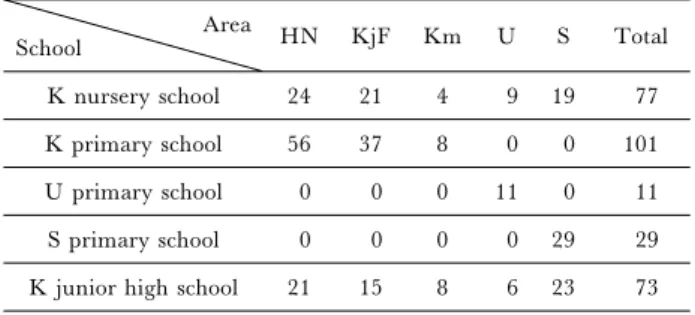
Table 1 Subjects' background data (N=291) Area School HN KjF Km U S Total K nursery school 24 21 4 9 19 77 K primary school 56 37 8 0 0 101 U primary school 0 0 0 11 0 11 S primary school 0 0 0 0 29 29 K junior high school 21 15 8 6 23 73 Subjects' background data
Subjects were students at 1 of 5 schools in Kounu town. Each sub-ject lived in 1 of the 5 areas.
cannot be applied to many epidemics because it is based on the assumption that the infection rate is the same throughout the population3). Consequently,
vari-ous extended models of SIR have been suggested. One of them, the multitype epidemic model3), divides a
population into subpopulations with diŠerent eŠective contact rates, and describes the reciprocal relationship of SIR. In this study, a multitype epidemic model was further developed to be ˆt for the characteristics of Kounu town by dividing the subpopulations into vari-ous groups. As a result, this model can be applied to more epidemics than SIR. Moreover, the eŠects of the diŠerent strategies for controlling and preventing in-‰uenza can be simulated by changing the parameters in the model, because the parameters of this model show eŠective contact rates for each subpopulation. The details are described in the Methods section.
The primary strategies for H1N1pdm control and prevention are treatment with antiviral drugs, preven-tive actions such as wearing a mask or vaccination, event cancellation, and school closures. To evaluate these mathematically, these strategies were substituted in the models as follows: treatment with an antiviral drug was replaced with decreasing the duration of vi-rus shedding by 1 day; preventive actions was replaced with decreasing the eŠective contact rate by 30 of the total population; event cancellation was replaced with decreasing the eŠective contact rate by 50 in the area in which most infected cases occurred; school closure was replaced with an infectivity of 10 for the sub-population of the school on a weekday. The epidemic was analyzed from these 4 aspects.
In this study, by conducting a survey of schoolchil-dren in Kounu town aged 1–15 years during the H1N1pdm epidemic of 2009 and applying the data to an SIR model and multitype epidemic models, we aimed to evaluate and compare the eŠectiveness of the strategies for H1N1pdm control and prevention; that is, treatment with antiviral drugs, preventive actions, event cancellation, and school closures.
METHODS
The subjects were schoolchildren in Kounu town under 15 years of age. The questionnaires answered by their parents provided data on their school, area, and condition(Susceptible, Infected, or Removed). Three mathematical models were adopted, and the best-ˆt-ting one was selected for the actual epidemic dynam-ics. By changing the parameters of the selected model and running 5 simulations on strategies for control and prevention, the total number of infected subjects and the basic reproduction numbers were compared. Subjects
The subjects were 291 children registered as attend-ing nursery, primary, or junior high school in Kounu town as of April 1, 2010. No subject received vaccina-tion during the epidemic. The subjects were classiˆed
according to schools and areas(Table 1). Data acquisition
Anonymous questionnaires were distributed by schools to parents between December 14 and 21, 2009. Schools reported infected cases according to the dates of absence due to in‰uenza, grade, and living area. We received 120 responses to questionnaires and schools reported 129 cases of in‰uenza infection. The response rate among infected cases was 93.0. We used the questionnaire data, which included age, ad-dress, date of infection, duration of symptoms, and in-formation about whether the subject received treat-ment with an antiviral drug, and the average duration of symptoms was calculated. All children with in‰uen-za were prevented from attending school during the in-fectious period by the School Health Law. Therefore, the number of undetected cases can be expected to be relatively small in Japan compared to in other coun-tries. The study design conformed to the principles of the 1975 Declaration of Helsinki, and was approved by the Ethics Committee of Epidemiological Research of Hiroshima University, Hiroshima, Japan (Epi–351, Hiroshima University).
Models
Three discrete stochastic models with varying coe‹cients to approximate the observed epidemic curve were adopted. We assumed that the logarithmic-transformed varying coe‹cients are quadratic poly-nomial of the reciprocal of the day after the epidemic started.
Model 1(an SIR model with varying coe‹cients): As-suming that Kounu town had a uniform time-depen-dent infection rate, the epidemic can be simulated in the SIR model. The model is described as
Sn+1=-bnSnIn,
In+1=bnSnIn-gnIn,
Rn+1=gnIn,
whereSn,In, andRndenote the number of susceptible,
infected, and removed individuals at day n after the epidemic started. Parametersbnand gndenote the
in-fection rate and recovery rate at dayn.
esti-Figure 1. The observed epidemic curve and intervention by school closure in Kounu town. Students in Kounu town were divided into 3 groups: Suscep-tible, Infected, and Removed. Figure 1 shows the transitional curve for each group. Note that 3 schools had been closed during the period (in-dicated by arrows).
mation method based on the corresponding stochastic model:
DNn+1|Nn~Poisson(bnSnIn),
DRn+1|Rn~Poisson(gnIn),
whereDNn+1=Nn+1–Nn,Nn=(N1,N2, ...,Nn), DRn+1
=Rn+1–RnandRn=(R1,R2, ...,Rn).
Models 2 and 3 (Multitype epidemic models with varying coe‹cients): If the infection rate was not con-stant, however, an epidemic curve formed by an SIR model would not be able to approximate the observed epidemic curve. Multitype epidemic models divide a population into subpopulations according to infection. In Model 2, the subjects were divided into 5 subpopu-lations according to the schools they attended. In Model 3, the subjects were divided into subpopula-tions according to schools (into 5 groups) and were further divided into 5 groups according to the area in which they lived. The subpopulations were labeledi= 1, 2, ..., 5; in all there were 25 subpopulations. Mathematical explanations of the dynamical model and the corresponding stochastic model are
Si,n+1=-bi,nSi,nIi,n,
Ii,n+1=bi,nSi,nIi,n-gnIi,n,
Ri,n+1=gnIi,n,
and
DNi,n+1|Ni,n~Poisson(bi,nSi,nIn),
DRi,n+1|Ri,n~Poisson(gnIi,n),
where In, =SiIi,n, DNi,n+1=Ni,n+1-Ni,n, Ni,n=(Ni,1,
Ni,2, ..., Ni,n), DRi,n+1=Ri,n+1–Ri,n and Ri,n=(Ri,1,
Ri,2, ...,Ri,n).
Simulations
The best-ˆtting model for the observed epidemic was selected. Assuming 4 strategies for in‰uenza con-trol and prevention, epidemic dynamics were simulat-ed by changing the parameters as follows.
Simulation 1: It was assumed that su‹cient antiviral drugs were provided in hospitals. According to the results of a randomized controlled trial on the eŠect of oseltamivir in Japan4,5), oseltamivir-treated patients
recover 1 day earlier than untreated patients. A similar trend is observed for other antiviral drugs6~8).
There-fore,g-1was replaced withg-1-1.
Simulation 2: It was assumed that preventive actions such as vaccination were practiced. In‰uenza vaccina-tion decreases susceptibility by 309,10). Therefore,
the eŠective contact rate b was replaced with 0.7×b. Simulation 3: It was assumed that large events were cancelled. This inhibits the spread of infection in an es-pecially high infectivity area. Therefore, the eŠective contact rate of a high infectivity area was replaced with 0.5×bi.
Simulations 4 and 5: It was assumed that school closure was carried out. School closure is considered to reduce contact between schoolchildren. Because con-tact with members of family or the community cannot be ignored, the eŠective contact rate for children
at-tending school was replaced with 0.1×bi, and not 0,
on weekdays. School closure can only be carried out on a weekday after the epidemic has started. We assumed that school closure was carried out in K primary school from 6 days after the epidemic started in Simulation 4, and 1 day after the epidemic started in Simulation 5.
RESULTS
Epidemic in Kounu town
The epidemic started with an infected 15-year-old female subject on October 29(day 1). The maximum number of infected subjects was 68 on November 8 (day 11), and the epidemic ended on November 25 (day 28). The total number of infected subjects was 120/291 (34/77 in K nursery school, 55/101 in K pri-mary school, 2/11 in U pripri-mary school, 10/29 in S primary school, and 19/73 in K junior high school). School closures were executed at K primary school (from Nov 5 to 6; day 8 to 9), K junior high school (from Nov 5 to 6; day 8 to 9), and K nursery school (Nov 9; day 12). We used day 8 data for the error sum of squares turn and day 9 data for the penalties turn (Fig. 1). The epidemic for each school and each area is shown in Table 2 and Figures 2 and 3. Models
We reproduced epidemic curves and estimated eŠec-tive contact rate (Fig 4). The sum of squares was 0.870 in Model 1, 0.696 in Model 2, and 0.883 in Model 3. Furthermore, considering the total number of infected cases, the maximum number of infected cases, and the epidemic duration, we found that the epidemic curve in Model 3 was the best-ˆtting of the 3 models, and we used this model for the simulations. According to Model 3, the eŠective contact rates for each subpopulation ranged from 0.00009 to 0.00534 (Table 3); the total and maximum numbers of
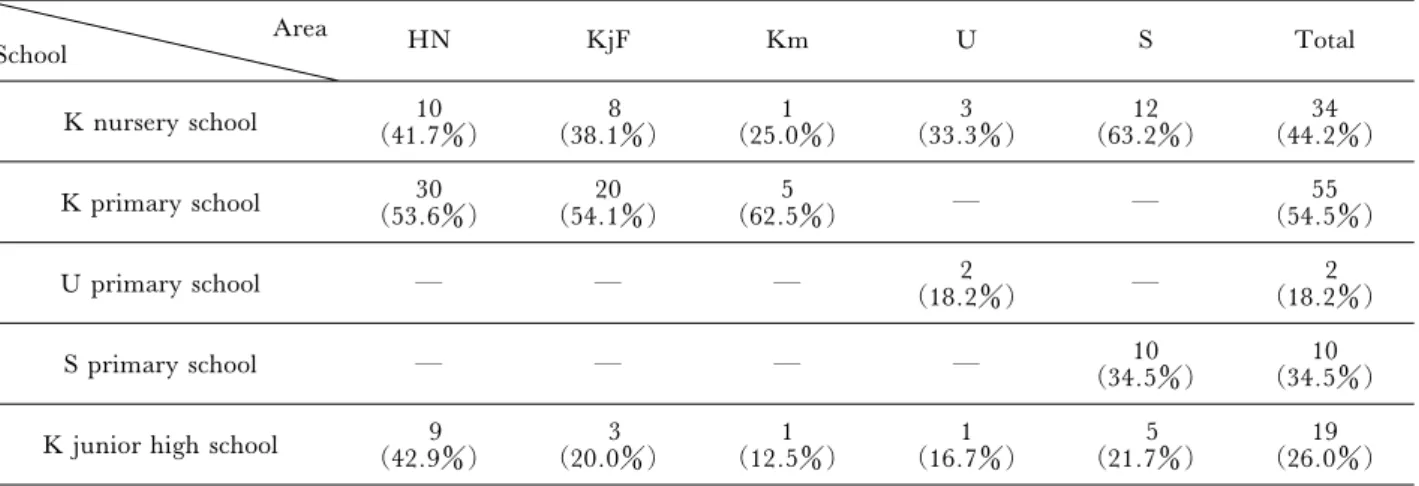
infect-Table 2 Infected cases in each subpopulation Area School HN KjF Km U S Total K nursery school (41.7)10 (38.1)8 (25.0)1 (33.3)3 (63.2)12 (44.2)34 K primary school (53.6)30 (54.1)20 (62.5)5 ― ― (54.5)55 U primary school ― ― ― (18.2)2 ― (18.2)2 S primary school ― ― ― ― (34.5)10 (34.5)10
K junior high school (42.9)9 (20.0)3 (12.5)1 (16.7)1 (21.7)5 (26.0)19 The number of infected cases
Infected cases from 5 schools in Kounu town divided into 5 areas.
Data are expressed as number of students (percentage of those at each school).
Figure 2. The observed epidemic curve of each school. Figure 2 shows infected numbers in each school.
Figure 3. The observed epidemic curve of each area. Figure 3 shows infected numbers in each area.
Figure 4. Comparisons between the 3 epidemic curves. The observed epidemic curve and 3 epidemic curves simulat-ed by mathematical modeling are shown. Model 1 was an SIR model, while Models 2 and 3 were multi-type epidemic models with varying coe‹cients.
Table 3 EŠective contact rate in each subpopulation Area School HN KjF Km U S K nursery school 0.000265 0.000595 0.000174 0.000284 0.001264 K primary school 0.003301 0.001931 0.005336 ― ― U primary school ― ― ― 0.000199 ― S primary school ― ― ― ― 0.002883
K junior high school 0.004544 0.000316 0.000093 0.000116 0.000227 The eŠective contact rate in each area represents the probability that a member of the susceptible population becomes newly infected when they contact a member of the infective population.
Infected cases of 5 schools in Kounu town divided into 5 areas are shown.
Table 4 Comparison between the models
Actual epidemic Model 1 Model 2 Model 3
Coe‹cient of determination R2 ― 0.870 0.696 0.883
Period of epidemic (days) 28 26 28 31
Maximum number of infected cases (persons) 68 58.5 54.2 63.7
Total number of infected cases (persons) 120 123.7 120.1 127.1
Comparison between the models
Coe‹cient of determination and some parameters of each model are shown.
Figure 5. Comparison of policies for prevention. This ˆgure shows the comparison epidemic curves with/without in-tervention by policies for prevention. Simulations 1, 2, 3, 4, and 5 assume su‹cient antiviral stockpiles, preventive behavior such as wearing a mask or vaccination, event cancellation, normal school closure, and theoretical school closure, respectively.
ed cases were 127 and 63.7, respectively, and the epi-demic duration was 31 days(Table 4).
Simulation
The simulation results are shown in Figure 5 and Table 5.
In Simulation 1, in which virus shedding was short-ened by 1 day, the epidemic was shortshort-ened from 31 days to 23 days. The total number of infected cases reduced from 127.1 to 113.2, and the maximum
num-ber of infected cases reduced from 63.7 to 61.6. In Simulation 2, in which the eŠective contact rate was decreased by 30 percent, the total and maximum num-bers of infected cases were reduced to 51.2 and 33.3, respectively, and the epidemic was shortened to 29 days. In Simulation 3, in which the eŠective contact rate of the high infectivity area was replaced with 0.5 ×bi, the total and maximum numbers of infected cases
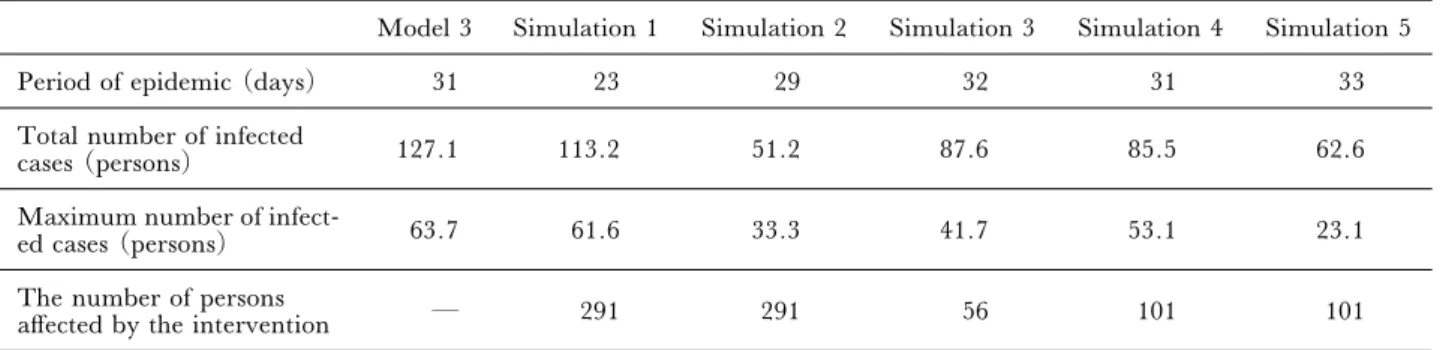
Table 5 Comparison between policies for prevention
Model 3 Simulation 1 Simulation 2 Simulation 3 Simulation 4 Simulation 5
Period of epidemic (days) 31 23 29 32 31 33
Total number of infected
cases (persons) 127.1 113.2 51.2 87.6 85.5 62.6
Maximum number of
infect-ed cases (persons) 63.7 61.6 33.3 41.7 53.1 23.1
The number of persons
aŠected by the intervention ― 291 291 56 101 101
Comparison between policies for prevention Some parameters for each situation are shown.
the epidemic was not shortened. In Simulation 4, in which the eŠective contact rate of the schoolchildren was replaced with 0.1×bion weekdays, the total and
maximum numbers of infected cases were reduced to 85.5 to 53.1, respectively, and the epidemic was not shortened. This pattern was similar to that observed for Simulation 3.
In Simulation 5, in which school closure was carried out immediately at Kounu primary school, the total and maximum numbers of infected cases were reduced to 62.6 and 23.1, respectively. The epidemic was not shortened.
DISCUSSION
In this study, the actual epidemic dynamics were duplicated using mathematical models. Moreover, by changing the parameters of the eŠective contact rates, the epidemic dynamics were simulated in order to evaluate the relative eŠectiveness of 4 strategies for in-‰uenza control and prevention.
Previous studies have used 2 standard approaches for evaluating epidemics using mathematical models. The ˆrst approach is to evaluate epidemics in large areas using survey estimates of the numbers of patients who were hospitalized or died because of in‰uenza. The other is to simulate a hypothetical epidemic in a city. Generally, the distribution of a population and its activity, which in‰uence eŠective contact rates in each subpopulation, vary in diŠerent towns. In small towns, as compared to large towns, each subpopulation has greater in‰uence over other subpopulations. The 2 standard approaches cannot evaluate an epidemic in a small, discrete area where the eŠective contact rates are diŠerent in each subpopulation. Therefore, we created a new epidemic model based on survey data for schoolchildren in Kounu town, and we simulated 4 strategies used to control and prevent epidemics of in-‰uenza in small, discrete areas.
Model 3 compared infectivity in terms of eŠective contact rate. High infectivity was identiˆed in Km, HN, KjF, and S areas of the primary school and in the HN area of K junior high school. High infectivity is a result of several factors: the presence of
immunocom-promised hosts, a population's high activity, high population density, and so on. When a few members of a minor subpopulation contract in‰uenza, infectivi-ty can increase; this was the case in the Km area of K primary school. The high activity level typical of pri-mary schoolchildren may have been the cause of the high eŠective contact rates in the Km, HN, KjF, and S area of the primary school. We found that the HN area of not only the primary school but also the junior high school had high eŠective contact rates. This suggests that another factor was operating in this area. In fact, in the HN area, K primary school students often gathered in close proximity to prepare for the com-munity festival. This is likely to have been the cause of the rapid spread of infection. We changed the parameters in Model 3 to evaluate the eŠectiveness of the 4 strategies in an area with a high-infectivity sub-population. Antiviral drugs can alleviate and shorten the symptoms of in‰uenza, but their eŠects on an epi-demic are not known. We found that antiviral drugs can shorten an epidemic's duration and reduce the total and maximum numbers of infected individuals.
In Simulation 3, the infectivity of the HN area of the K primary school was reduced to half of that observed during the festival preparation period. During this period of 4 days, 56 persons were aŠected by the inter-vention. School closure is an appropriate intervention for a high-infectivity population that attends school, and is eŠective for the prevention of epidemics. The Japanese pandemic in‰uenza guidelines strongly recommend school closure on the day on which a sin-gle individual is found to be infected. The school-closure simulation conducted according to the guide-lines led to a marked reduction in the total and maxi-mum numbers of infected persons. However, during the actual epidemic, school closure was carried out af-ter the infection had spread. As Simulation 4 shows, school closure after an infection has spread has little eŠect.
Although the other strategies also had an eŠect, event cancellation was eŠective and is considered to be the minimum intervention required to reduce the total and maximum numbers of infected individuals.
Moreover, event cancellation is particularly useful be-cause it can be carried out immediately if appropriate guidelines are available. In this simulation, we as-sumed that event cancellation would reduce the infec-tivity of the highest infecinfec-tivity area to that of the average of other areas. The simulation can also be ap-plied to other situations, such as factories, gymnasi-ums, and so on. Intervention is necessary only in areas of high infectivity and susceptibility. Therefore, target-ed intervention upon identiˆcation of an event or area with high infectivity and susceptibility may be eŠec-tive.
Although the durations of the epidemics in Simula-tions 3–5 were not shorter than that of Model 3 without a strategy, it is unnecessary to increase the quantity of antiviral drugs because the total number of infected individuals is decreased. Moreover, the dura-tion of the epidemic can be expected to be shorter than that estimated, due to the combined use of antiviral drugs in Simulation 1. A decrease in the maximum number of infected individuals will no doubt reduce hospital workloads.
It is di‹cult to compare actual epidemics with those in which interventions were applied. Event cancella-tion in the United States11~13) in 1918 and school
closure in Israel14,15)in 2000 reduced the number of
in-fected individuals. Although some studies suggest that school closure is not eŠective, others― including those using mathematical models ― have reported its eŠectiveness16~22).
Two peaks in the epidemic in the K primary school were identiˆed; these were not simulated by any of the models. If no preventative actions, such as antiviral treatment, mask wearing, or school closure, had been taken, then a higher second peak may have occurred. In this study, it was assumed that the eŠective con-tact rate and removal ratio can change every day dur-ing an epidemic. However, in actual epidemics, both the susceptibility and infectivity change according to individuals' behavior. For example, susceptible dividuals will undertake preventive actions, while in-fected subjects will remain at home. These factors could have aŠected the accuracy of our simulated epi-demic curves, although our model described the actual epidemic in a small, discrete area very well. Our model may not be applicable to a large city in which the population is mobile.
In this study, the non-epidemic eŠects of the 4 strategies were not evaluated. For example, the cancel-lation of a festival may have mental health conse-quences. Negative economic and educational eŠects may result from uninfected children being unable to attend school, such as their parents not being able to go to work.
Although event cancellation may have social, eco-nomic, and political consequences23~25), our ˆndings
demonstrate its eŠectiveness in a small discrete area
during an epidemic.
FUNDING
This research received no specific funding.
References
1) Okabe N, Taya K, Sato H, et al. The antibody posses-sion rate of the people to the new in‰uenza (pandemic H1N1 2009) (in Japanese). 2009. http://www.mhlw. go.jp / kinkyu / kenkou / in‰uenza / dl / infu090924-02.pdf (Accessed February 26, 2013)
2) Anderson RM, May RM. Population biology of infec-tious diseases: Part I. Nature 1979; 280(5721): 361–367. 3) Britton T. Estimation in multitype epidemics. J R Stat
Soc Series B Stat Methodol 1998; 60(4): 663–679. 4) Lee N, Chan PK, Hui DS, et al. Viral loads and
dura-tion of viral shedding in adult patients hospitalized with in‰uenza. J Infect Dis 2009; 200(4): 492–500.
5) Whitley RJ, Hayden FG, Reisinger KS, et al. Oral oseltamivir treatment of in‰uenza in children. Pediatr In-fect Dis J 2001; 20(2): 127–133.
6) Sugaya N, Ohashi Y. Long-acting neuraminidase inhi-bitor laninamivir octanoate (CS-8958) versus oseltamivir as treatment for children with in‰uenza virus infection. Antimicrob Agents Chemother 2010; 54(6): 2575–2582. 7) Hedrick JA, Barzilai A, Behre U, et al. Zanamivir for treatment of symptomatic in‰uenza A and B infection in children ˆve to twelve years of age: a randomized con-trolled trial. Pediatr Infect Dis J 2000; 19(5): 410–417. 8) Kohno S, Kida H, Mizuguchi M, et al. E‹cacy and
safety of intravenous peramivir for treatment of seasonal in‰uenza virus infection. Antimicrob Agents Chemother 2010; 54(11): 4568–4574.
9) Ambrose CS, Wu X, Knuf M, et al. The e‹cacy of in-tranasal live attenuated in‰uenza vaccine in children 2 through 17 years of age: a meta-analysis of 8 randomized controlled studies. Vaccine 2012; 30(5): 886–892. 10) Osterholm MT, Kelley NS, Sommer A, et al. E‹cacy
and eŠectiveness of in‰uenza vaccines: a systematic rev-iew and meta-analysis. Lancet Infect Dis 2012; 12(1): 36–44.
11) Markel H, Lipman HB, Navarro JA, et al. Nonphar-maceutical interventions implemented by US cities dur-ing the 1918–1919 in‰uenza pandemic. JAMA 2007; 298 (6): 644–654.
12) Bootsma MC, Ferguson NM. The eŠect of public health measures on the 1918 in‰uenza pandemic in U.S. cities. Proc Natl Acad Sci U S A 2007; 104(18): 7588–7593.
13) Heymann A, Chodick G, Reichman B, et al. In‰uence of school closure on the incidence of viral respiratory dis-eases among children and on health care utilization. Pediatr Infect Dis J 2004; 23(7): 675–677.
14) Heymann AD, Hoch I, Valinsky L, et al. School closure may be eŠective in reducing transmission of respiratory viruses in the community. Epidemiol Infect 2009; 137(10): 1369–1376.
15) Hatchett RJ, Mecher CE, Lipsitch M. Public health interventions and epidemic intensity during the 1918 in-‰uenza pandemic. Proc Natl Acad Sci U S A 2007; 104 (18): 7582–7587.
16) Hens N, Ayele GM, Goeyvaerts N, et al. Estimating the impact of school closure on social mixing behaviour and the transmission of close contact infections in eight European countries. BMC Infect Dis 2009; 9: 187. 17) Wu JT, Cowling BJ, Lau EH, et al. School closure
and mitigation of pandemic (H1N1) 2009, Hong Kong. Emerg Infect Dis 2010; 16(3): 538–541.
18) Sypsa V, Hatzakis A. School closure is currently the main strategy to mitigate in‰uenza A(H1N1)v: a model-ing study. Euro Surveill 2009; 14(24): 19240.
19) Lee BY, Brown ST, Cooley P, et al. Simulating school closure strategies to mitigate an in‰uenza epidemic. J Public Health Manag Pract 2010; 16(3): 252–261. 20) Milne GJ, Kelso JK, Kelly HA, et al. A small
com-munity model for the transmission of infectious diseases: comparison of school closure as an intervention in in-dividual-based models of an in‰uenza pandemic. PLoS One 2008; 3(12): e4005.
21) Sasaki A. Challenges in formulating evidence-based strategies for school closures: studies in Japan and other countries. Japan Medical Association journal 2009; 52 (5): 319–324.
22) Cauchemez S, Ferguson NM, Wachtel C, et al. Closure of schools during an in‰uenza pandemic. Lancet Infect Dis 2009; 9(8): 473–481.
23) Chen WC, Huang AS, Chuang JH, et al. Social and economic impact of school closure resulting from pan-demic in‰uenza A/H1N1. J Infect 2011; 62(3): 200–203.
24) Brown ST, Tai JH, Bailey RR, et al. Would school closure for the 2009 H1N1 in‰uenza epidemic have been worth the cost?: a computational simulation of Pennsyl-vania. BMC Public Health 2011; 11: 353.
25) Sadique MZ, Adams EJ, Edmunds WJ. Estimating the costs of school closure for mitigating an in‰uenza pandemic. BMC Public Health 2008; 8: 135.