Imaging of Acoustic Pressure Radiation from
Vibrating Microstructure in Atmosphere using
Thermal Microscope
著者
江刺 正喜
journal or
publication title
Applied Physics Letters
volume
90
number
21
page range
211911-1-211911-3
year
2007
Imaging of acoustic pressure radiation from vibrating microstructure
in atmosphere using thermal microprobe
Takahito Ono,a兲 Sang-Jin Kim, and Masayoshi Esashi
Graduate School of Engineering, Tohoku University, Aza Aoba 6-6-01, Aramaki, Aoba-ku, Sendai 980-8579, Japan
共Received 17 April 2007; accepted 1 May 2007; published online 22 May 2007兲
This letter reports on an imaging technique of acoustic pressure radiation 共APR兲 from vibrating micro-/nanostructures and their mechanical defects. Resonance oscillation of micro-/nanometer beams in use of viscous environments is important for various sensing applications. Viscous dumping is the main energy loss mechanism, which determines the quality factor of resonance in viscous fluid. The APR due to viscous dumping is imaged using a scanning thermal flow sensor. A platinum heater or micromachined silicon heater is heated up by flowing a current, and the acoustic particle velocity which originated from APR is detected. Imaging of APR is demonstrated and compared with the actual vibration image. Also, strong APR is observed from a crack on the support of a silicon beam. © 2007 American Institute of Physics.关DOI:10.1063/1.2742908兴
Resonance oscillation of micrometer and nanometer scale electromechanical sensors in gases and liquids has in-creased their importance in applications in physics and biol-ogy. Tiny physical and chemical interactions between a tip on resonating beam and a sample have been detected in scan-ning probe microscope families.1A small mass down to at-togram has been detected from the resonant frequency change of very thin beams in vacuum,2–4 and a lot of effort has been made to achieve a high sensitivity even in viscous fluids.4
One of the issues in resonating mechanical devices is to achieve a stable high-quality factor共Q factor兲, which is di-rectly related to the noise of the sensing systems. The Q factor共Q兲 is inversely proportional to energy loss of vibra-tion:⬃1/Q. There are many energy dissipation mechanisms and the Q factor is determined from the sum of energy dis-sipations; 1 / Q =兺1/Qi. The mechanical energy dissipation mechanisms can be classified into two, i.e., internal losses and external losses. Internal losses include the internal fric-tion of materials, surface fricfric-tion, fricfric-tion at the grain bound-ary, thermoelastic damping, etc. In external losses, vibration energy is emitted as phonons or sound waves to outside of a vibrating beam. The energy dissipation via the support of vibrating beam is referred to as support loss or clamping loss,5and the energy loss via gas is referred to as gas damp-ing. Gas damping is related to gas pressure and the geometry of the resonating beams, which has been theoretically and experimentally studied.6
However, the direct measurement of acoustic pressure radiation 共APR兲 involved in the gas damping has not been reported yet. In this letter, we propose and demonstrate mea-surement and imaging methods for APR based on particle velocity detection using a microheater.
A miniature thermal flow sensor has been used to detect the acoustic particle velocity involved in vibration of micro-and nanostructures in ambient atmosphere. It has been re-ported that the thermal flow sensor can detect the acoustic particle velocity measurements.7 Constant current I flows
into the resistive flow sensor elements, and temperature variation of the sensor element for small temperature varia-tions can be detected from voltage variation at both ends of the heater, according to V共T兲=IR0关1+␣共T−T0兲兴, where R0is the resistance of the heater at temperature T0, T is the actual temperature, and␣ is the resistance temperature coefficient of the heating wire. If the acoustic wave is supposed to be a plane wave traveling into the x direction with a frequency, its acoustic particle velocity u共x,t兲 is given by u共x,t兲 =共
冑
2p /0c兲cos共t − kx兲, where p is the acoustic pressure,0is the density of medium, c is the velocity of acoustic wave, and k is the wave number.0C corresponds to the character-istic impedance of medium共⬃400 Pa s/m, in ambient atmo-sphere at room temperature兲. If a small sound source gener-ates a spherical wave at a distance r from the source, the acoustic velocity is given by u共r,t兲=共p/
冑
0cr兲cos共t − kr兲. As the heat transfer coefficient between fluid and heater is proportional to the square root of fluid velocity冑
u, thedis-sipated heat is proportional to the square root of fluid veloc-ity. The output voltagev of the sensing element, which
origi-nated from acoustic particle flow, can be approximated by the equation v = AST
冑
u, where A is constant and S is thesurface area of the sensing wire.
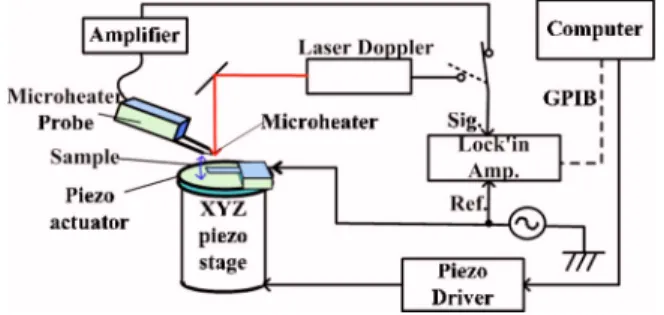
Figure 1 shows the schematic of experimental setup. A micro- or nanostructure was mounted on a piezo-XYZ stage with a stroke of 150m in XY directions, and the sample was vibrated using a piezoelectric transducer共PZT兲 ceramics actuator. In order to detect APR from the vibrating sample, a
a兲Author to whom correspondence should be addressed. Electronic mail:
FIG. 1. 共Color online兲 Measurement setup for acoustic pressure radiation from a vibrating micro- or nanostructure.
APPLIED PHYSICS LETTERS 90, 211911共2007兲
0003-6951/2007/90共21兲/211911/3/$23.00 90, 211911-1 © 2007 American Institute of Physics Downloaded 07 Jul 2008 to 130.34.135.158. Redistribution subject to AIP license or copyright; see http://apl.aip.org/apl/copyright.jsp
microheater with 1m diameter of a boron-doped silicon wire was employed.8The measured voltage-current relation-ship of this Si heater is shown in Fig.2. A constant current of 10 mA was flowed into this Si probe during the measure-ments, which heat the Si wire up to approximately 400 ° C. The vibrating sample emits the APR and its particle flow modulates the temperature of the heated microheater, which was detected from the resistance change of the microheater using a voltage amplifier and lock-in amplifier. Two-dimensional imaging of APR was accomplished by scanning the heater probe on the vibrating sample. To characterize the mechanical properties and identify the vibration modes of the sample, the measurement system was equipped with a laser Doppler vibrometer.
As samples, single crystalline Si cantilevers with thick-nesses of 140 and 175 nm, a commercial SiN probe, and Si beams with a thickness of 1.5m were tested.
At first the APR measurement from a Si resonator was demonstrated. Figures3共a兲and3共b兲show the comparison of actual mechanical vibration and APR spectra of a Si cantile-ver beam with a torsional resonator at the end, as depicted in Fig. 3共a兲. The first, second, and third flexural modes were
found at 19.7, 125, and 283 kHz, respectively. Also, a tor-sional vibration mode of the resonator could be seen at 661 kHz. The thermal Si probe was placed above the end of a torsional beam at a distance of approximately 2m, and an APR spectrum was obtained as well. Corresponding to each vibration peak, the APR peak could be observed. How-ever, a higher vibration peak exhibits relatively smaller peak intensity due to a low sensitivity in APR at high frequency.
By scanning the thermal probe along the in-plane direc-tion on the tordirec-tional beam, the profiles of APR from the vibrating beam at the first flexural mode of 19.7 kHz with an amplitude of 1m were observed at different distances from the surface of resonator, as shown in Fig.4. As the distance
r increases, the observed APR signal decreases as⬃共r兲−0.5. If the source of APR is regarded as a point source, the acoustic particle velocity will be proportional to a root square of the intensity, i.e., u⬃ 冑I, as discussed before. Therefore, the dis-tance dependence on the detected acoustic signal, which is proportional to a square root of the particle velocity冑u, be-haves as measured. The same behavior was observed in other vibration modes.
Imaging of APR was demonstrated on some samples. The imaging of vibration amplitude was also conducted and compared with the APR image. The sample was moved into the XY direction, and the APR signal or the output of the laser Doppler vibrometer was detected using the lock-in am-plifier in which the vibration voltage to the piezoelement was used as a reference signal. The distance between the thermal probe and the cantilever was kept at approximately 5m. Figure5共a兲shows the images of the vibration amplitude of a commercial SiN atomic force microscopy probe that vibrated at its fundamental resonance of 11 800 Hz. Its vibration am-plitude at the end was approximately 1.0m. Figure 5共b兲
shows the corresponding APR image. In these images, the large amplitude area or strong APR area appeared to be bright. Figures 5共c兲and 5共d兲 show the images of vibration amplitude and APR of another triangular probe vibrated at the resonance of 33 300 Hz. It can be seen that the APR profile is slightly different due to the different geometry.
Another Si resonator, as the optical micrograph is shown in Fig.6共a兲, was evaluated as well. This double-beam reso-nator is 145 nm in thickness and 100m in length. Another 100-m-thick Si beam supports this Si resonator. The reso-nator was vibrated at a frequency of 17 670 Hz using the attached PZT actuator with a vibration amplitude of 0.5m
FIG. 2.共Color online兲 Voltage and current relationship of the thermal probe. Inset is the scanning electron microscopy image of the Si micromachined thermal probe.
FIG. 3.共Color online兲 共a兲 Mechanical vibration spectrum measured by laser Doppler vibrometer.共b兲 Corresponding acoustic pressure radiation spectrum measured by the Si thermal probe.
FIG. 4.共Color online兲 共a兲 Profiles of acoustic pressure radiation along A-A⬘ cross section at different distances from the resonator.
211911-2 Ono, Kim, and Esashi Appl. Phys. Lett. 90, 211911共2007兲
at the end. Figure6共b兲 shows the image of APR from this resonator. APR could be observed from a vibrating Si double beam, and also strong APR was observed from a crack on the support of the vibrating silicon beams. Despite the small vi-bration amplitude at the crack, large energy is concentrated, which emits strong APR.
In summary, we proposed and demonstrated a technique for observing a mechanical energy loss directly from APR. A micromachined thermal probe sensor is sensitive to acoustic wave with a frequency below⬃600 kHz and has a spatial resolution of approximately few micrometers. The observed images show the vibration energy dissipation depending on the geometry of resonator at a given vibration frequency. Also, strong energy dissipation from a defect of the resonator could be observed. This measurement method of APR pro-vides a useful method for characterizing the vibration energy dissipation, and also provides useful information for design-ing a high Q resonator in gas atmosphere.
Part of this work was performed in the MicroNanoma-chining Research and Education Center 共MNC兲 of Tohoku University. This work was supported in part by a Grant-in Aid for Scientific Research from the Ministry of Education, Culture, Sports, Science and Technology of Japan, and also supported in part by Core Research for Evolution Science and Technology Agency共CREST兲 of the Japan Science and Technology Agency共JST兲.
1See, for example, Scanning Tunneling Microscopy II, edited by R.
Wiesendanger and H.-J. Güntherodt共Springer, Berlin, 1992兲.
2T. Ono, X. X. Li, H. Miyashita, and M. Esashi, Rev. Sci. Instrum. 74,
1240共2003兲.
3K. L. Ekinci, X. M. H. Huang, and M. L. Roukes, Appl. Phys. Lett. 84,
4469共2004兲.
4S.-J. Kim, T. Ono, and M. Esashi, Appl. Phys. Lett. 88, 053116共2006兲. 5H. Hosaka, K. Itao, and S. Kuroda, Sens. Actuators, A 49, 87共1995兲. 6F. R. Blom, S. Baouwstra, M. Elwenspoek, and J. H. J. Fluitman, J. Vac.
Sci. Technol. B 10, 19共1992兲.
7J. W. V. Honschoten, V. B. Svetovoy, G. J. M. Krijnen, and M. C.
Elwenspork, J. Microelectromech. Syst. 14, 436共2005兲.
8D. W. Lee, T. Ono, and M. Esashi, Nanotechnology 13, 29共2002兲.
FIG. 5.共Color online兲 Vibration amplitude and acoustic pressure radiation images of triangular cantilevers.共a兲 is the vibration amplitude and 共b兲 cor-responds to its acoustic pressure radiation.共c兲 is the amplitude of another sample and共d兲 is the corresponding acoustic pressure radiation. 共Image sizes
are 150⫻150m2.兲 FIG. 6.pressure radiation image.共Color online兲 共a兲 145-nm-thick beam with a crack and 共b兲 acoustic共Image sizes are 150⫻150m2.兲
211911-3 Ono, Kim, and Esashi Appl. Phys. Lett. 90, 211911共2007兲