Regular Paper
Margin estimation and disturbances of irradiation fi eld in layer-stacking carbon-ion beams
for respiratory moving targets
Shinya Tajiri
1,2, Mutsumi Tashiro
3,4, Tomohiro Mizukami
2, Chihiro Tsukishima
2, Masami Torikoshi
1,4and Tatsuaki Kanai
1,4,*
1Department of Heavy Ion Beam Medical Physics and Biology, Gunma University Graduate School of Medicine, 3-39-22 Showa-Machi, Maebashi, Gunma 371-8511, Japan
2Mitsubishi Electric Corporation, 1-1-2, Wadasaki-cho, Hyogo-ku, Kobe 652-8555, Japan
3Research Program for Heavy Ion Therapy, Gunma University Initiative for Advanced Research, 3-39-22 Showa-Machi, Maebashi, Gunma, Japan
4Gunma University Heavy Ion Medical Center, 3-39-22 Showa-Machi, Maebashi, Gunma, Japan
*Corresponding author. Department of Heavy Ion Beam Medical Physics and Biology, Gunma University Graduate School of Medicine, 3-39-22 Showa-Machi, Maebashi, Gunma 371-8511, Japan. Tel:+81-27-220-8378; Fax:+81-27-220-8379; Email: [email protected]
Received March 15, 2016; Revised May 30, 2016; Editorial Decision January 10, 2017
ABSTRACT
Carbon-ion therapy by layer-stacking irradiation for static targets has been practised in clinical treatments. In order to apply this technique to a moving target, disturbances of carbon-ion dose distributions due to respiratory motion have been studied based on the measurement using a respiratory motion phantom, and the margin esti- mation given by the square root of the summation Internal margin2+Setup margin2 has been assessed. We assessed the volume in which the variation in the ratio of the dose for a target moving due to respiration relative to the dose for a static target was within 5%. The margins were insufficient for use with layer-stacking irradiation of a moving target, and an additional margin was required. The lateral movement of a target converts to the range variation, as the thickness of the range compensator changes with the movement of the target. Although the add- itional margin changes according to the shape of the ridgefilter, dose uniformity of 5% can be achieved for a spher- ical target 93 mm in diameter when the upward range variation is limited to 5 mm and the additional margin of 2.5 mm is applied in case of our ridgefilter. Dose uniformity in a clinical target largely depends on the shape of the mini-peak as well as on the bolus shape. We have shown the relationship between range variation and dose uniformity.
In actual therapy, the upper limit of target movement should be considered by assessing the bolus shape.
KEYWORDS:carbon-ion, gated irradiation, layer-stacking, margin, respiratory motion
INTRODUCTION
The success of carbon-ion therapy with passive beam irradiation that utilizes wobbler magnets, a scatterer, a ridgefilter and a multileaf colli- mator (MLC) has previously been demonstrated at the Heavy Ion Medical Accelerator in Chiba (HIMAC) [1], Hyogo Ion Beam Medical Center (HIBMC), Gunma University Heavy Ion Medical Center (GHMC) [2, 3] and the SAGA Heavy Ion Medical Accelerator in Tosu (SAGA HIMAT). To improve the dose localiza- tion in a target, the layer-stacking irradiation technique has been used at the HIMAC and GHMC [4, 5]. Layer-stacking irradiation can reduce unnecessary irradiation of normal tissues on the proximal side
of the spread-out Bragg peak (SOBP). However, the dose uniformity may be disturbed when the target is moving. Thus, the method has not been clinically used for tissues that undergo respiratory motion, such as the lung or liver regions. It was our aim to investigate the use of this technique for a moving target.
Moriet al.have reported on ensuring dose uniformity in a mov- ing target with the layer-stacking irradiation method through the use of calculation [6,7]. They reported that better dose uniformity was achieved with passive irradiation than with layer-stacking irradiation.
Additionally, dose uniformity with gated layer-stacking irradiation was better than that achieved with free breathing [6]. Dose assessments
© The Author 2017. Published by Oxford University Press on behalf of The Japan Radiation Research Society and Japanese Society for Radiation Oncology.
This is an Open Access article distributed under the terms of the Creative Commons Attribution Non-Commercial License (http://creativecommons.org/licenses/
by-nc/4.0/), which permits non-commercial re-use, distribution, and reproduction in any medium, provided the original work is properly cited. For commercial re-use, please contact [email protected]
• 1
were later conducted with carbon-ion layer-stacking irradiation, using a numeric lung phantom and changing several parameters. It was reported that shortening of motion displacement by means of a gat- ing strategy and increasing the irradiation time was important, based on simulations [7].
Tashiro et al. have reported a method for incorporating image acquisition into the margins and smearing value of a moving target [8].
In their report, the margins and smearing value were determined by measuring the amount of movement of the target in each direction, based on 4D computed tomography (4D CT) images. In addition, the validity of the margins and the smearing value for the moving target has been verified by dose measurements in the case of broad-beam irradiation (S. Tajiriet al., submitted for publication).
For a moving target, two factors need to be considered. One is the dose uniformity inside the clinical target volume (CTV), and the other is appropriate margin estimation. In this paper, we experi- mentally verify the dose uniformity inside the CTV and the appro- priate margins for layer-stacking irradiation of a moving target.
MATERIALS AND METHODS
Layer-stacking irradiation method
Figure1shows a schematic illustration of the layer-stacking irradiation technique. In the layer-stacking method [5], the target is divided into several layers in the beam direction, and is sequentially irradiated, layer by layer, with a mini-peak that is produced by the ridge filter. The opening of the MLC is synchronized with the layer-stacking irradiation in accordance with the shape of the proximal part of the target.
In the layer-stacking method used at our institution, the dose at each slice is assessed by measuring the peak dose before the irradiation.
Then, we have to position theflat part in the depth dose distribution of the mini-peak. Figure2shows the physical and biological dose distribu- tions achieved with a ridgefilter. The corresponding width of the mini- peak was 5 mm. The mini-peak was swept longitudinally in steps of 2.5 mm by inserting a range shifter. The mini-peak was designed so that it overlaps at each step, because it may be resistant to movement of the target. The mini peak and the step sizes, which are clinically used in static target irradiation, were used in the measurements.
Margin estimation
We defined the planning target volume (PTV), a virtual CTV and a treated volume as described in a previous paper (S. Tajiriet al., submit- ted for publication). We measured dose distributions, changing the amplitude of the target movement, while a range compensator (RC) was placed at afixed position. Internal margins for each direction differ with the amplitude. In order to assess the method for determining mar- gins (see Fig.3), wefirst determined the PTV for a moving target. We took the PTV to be the same as the treated volume for a static target.
Then, we inversely defined a virtual CTV, using margins determined from the movement amplitude. The virtual CTV is defined by the con- tours resulting from subtraction of the total margin (distal: deeper region of beam axis; proximal: shallower region of beam axis; lateral:
perpendicular to the beam axis) from the PTV. The total margin in the lateral direction therefore corresponds to the smearing values.
For heavy ion therapies, the clinical dose distribution, which is defined as the physical dose multiplied by the relative biological effectiveness (RBE), should be considered. In order to consider a change in the clinical dose due to movement of the target, the beam quality or linear energy transfer should be measured. We did not
Wobbler magnet Scatter
Ridge filter
Range shifter
Multileaf collimator
Range compensator
Patient Target
Lateral direction Beam direction
Fig. 1. Schematic illustration of layer-stacking irradiation.
Fig. 2. An example of physical and biological dose distribution achieved by the ridgefilter. Blue and red lines are physical dose and biological dose, respectively.
consider change in the beam quality, and we assumed that the vari- ation in the physical dose would approximate that of the clinical dose.
In our experiment, the center of a spherical target 93 mm in diameter was placed at a depth of 120.5 mm in water. The PTV is given by the treated volume for the static target that covers 95% of the prescribed dose for a static target [9–11]. The RC was designed for static irradiation. We then measured dose distributions in a respiratory motion–phantom with the RC.
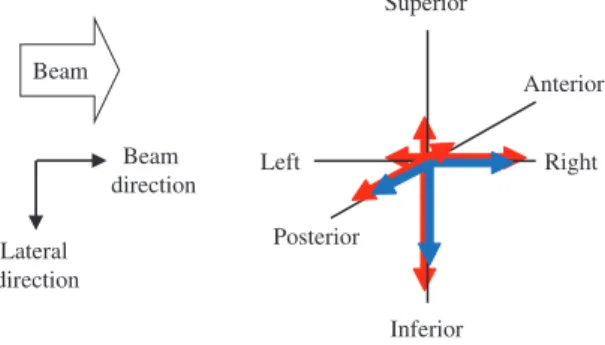
Based on the work of Tashiro et al. [8], determination of the internal margin (IM) is schematically illustrated in Fig.3(S. Tajiri et al., submitted for publication). The blue arrows show motion in the superior–inferior (SI), left–right (LR) and anterior–posterior (AP) directions, and the red arrows show the IM in each direction.
Following our treatment planning policy, the IM in each direction was set by adding one-third of the motion during the gating window in each direction. The total margin (TM) in the superior, inferior, left, right, anterior and posterior directions was calculated as follows:
= + ( )
Total margin IM2 SM ,2 1
where the setup margin (SM) was taken as ~3 mm in each direction for treatment planning. This value was taken as the square root of the summation such as the positional error, displacement of the beam axis, the positions of the RC and MLC, the machining accur- acy of the RC, the uniformity of the RC material, and beam range uncertainties [8]. In the measurements, a multilayer ionization cham- ber (MLIC) [12] was positioned by a laser pointer instead of by an X-ray positioning system. The SM was assumed to be 2 mm in the lateral direction and 3 mm in the beam direction. This is because the MLIC had a few percentage errors in water-equivalent length values of electrodes, an uncertainty in position, etc. Then, we defined the virtual CTV as the PTV minus the total margins [8].
Conversion of lateral movement to range variation
The thickness of the RC used in this experiment increased with the off-center distance. Then, lateral movement of the target was con- verted to range variation due to movement of the target, assuming the straight line approximation of the beam path. The central part
of the target has smaller changes of the beam direction, but the per- ipheral region has larger changes. Figure4illustrates the schematic of the beam range variation due to target motion. For a moving tar- get, the two arrows show the same irradiated position in the target;
however, the beam range in the target becomes shorter when the target moves from inferior to superior. This is because the path lengths in the RC become thicker.
Experimental conditions
We measured dose distributions with and without respiratory motion by using the MLIC [12] that was mounted on a laterally moving stage. The MLIC consists of 64 small ionization chambers stacked with ~4-mm water-equivalent intervals in the beam direc- tion. A beam energy of 400 MeV/n was used. A prescribed dose of 5 Gy (the RBE) was administered to the target from a horizontal irradiation port.
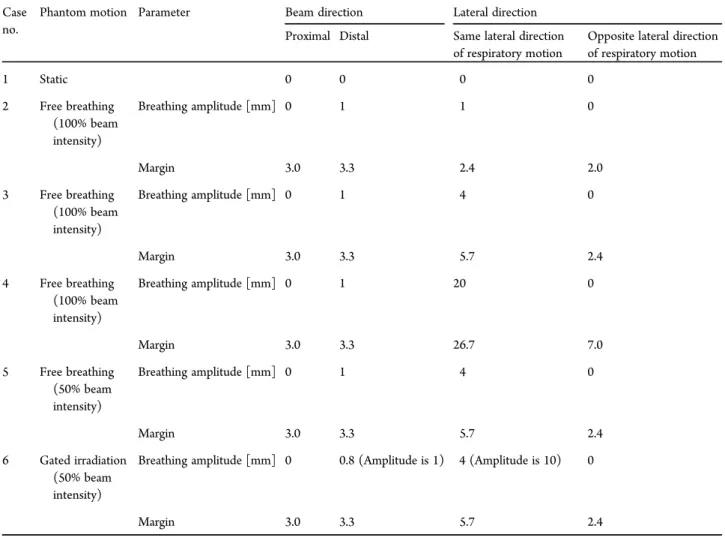
The dose measurement setup is shown in Fig.5. The static tar- get was located on the beam line passing through the iso center (IC). The target moved towards the right (the superior direction) with respect to the beam direction; also, the movement of the beam direction was simulated by changing the thickness of a wedge-shaped phantom. We measured dose distributions at various movement amplitudes (1, 4 and 20 mm), for beam intensities of 100% and 50%, and for free breathing and gated irradiation, as summarized in Table1. In order to compare free breathing with gated irradiation under similar conditions, the gating windows of the lateral and beam directions were set to 4 mm and 0.8 mm, respectively, when the total amplitudes of lateral and beam direc- tion were 10 mm and 1 mm, respectively. The beam was gated only for lateral movement, using a respiratory gating system (Anzai Medical AZ-733V with laser respiration sensor, Tokyo, Japan) equipped with a beam delivery system (Mitsubishi Electric, Tokyo, Japan). The dose rate of 100% beam intensity at the IC position was 6.18 Gy/min. We measured dose distributions using the respiratory gating system for gated irradiation. The values of mar- gins are also summarized in Table1.
The lateral movement of the MLIC was synchronized with the wedge-shaped phantom. The respiratory cycle was set to an
Superior
Inferior Posterior
Anterior
Right Left
Beam
Lateral direction
Beam direction
Fig. 3. Schematic illustration of determination of the IM. The blue arrows show motion in the superior– inferior (SI), left–right (LR) and anterior–posterior (AP) directions. The red arrows show the IM in each direction.
Beam Target
Respiratory movement
MLC RCs
Lateral direction Beam direction
Fig. 4. Schematic illustration of the beam range variation due to respiratory motion.
arbitrary value of 3.5 s, which was not the same as the synchrotron operation cycle. Respiratory motion was assumed to be sinusoidal.
The operation cycle of the synchrotron was 2.9 s, and the spill cycle length was 0.97 s. In our measurements, beam direction and lateral direction were defined by the LR direction and the SI direction.
RESULTS
Margin assessment
For comparison of dose distributions between the static target and the targets moving due to respiration, the relative dose ratio was evaluated as shown below:
[ ] = (D D ) × ( )
Relative dose ratio % moving/ static 100, 2 whereDstaticwas the measured physical dose for a static target, and Dmovingwas the measured dose for a moving target.
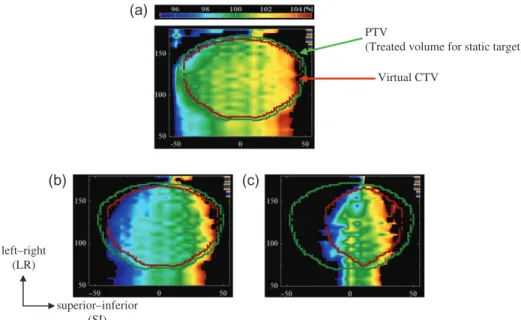
Figure6shows the dose ratio between the static target (Case no.
1 in Table1) and the moving target (Case nos 2–4 in Table1). The black region represents the area in which the variation of the dose ratio exceeds 5%. The colored region depicts the area in which the variation of the dose ratio falls within 5%. The green dotted line is the PTV that is defined by the treated volume for a static target, while the red-brown dotted line is the virtual CTV calculated from the PTV and moving distances. The treated volume for a moving tar- get in which the variation of the dose ratio is more than±5% (the black region) was observed at the edges of the virtual CTV. For this reason, the dose weight among all layers was markedly higher in the most distal layer, which resulted in severe interplay effect at this layer. Coverage of the treated volumes for the moving targets relative
to the defined virtual CTVs were 97.6%, 95.0% and 88.0% in cases of lateral motion of 1 mm, 4 mm and 20 mm, respectively.
Figure7shows the average dose ratio and standard deviation in the above virtual CTV at each lateral position. Red, blue and green dotted lines indicate the average dose ratio for 1 mm (Case no. 2 in Table1), 4 mm (Case no. 3 in Table1) and 20 mm (Case no. 4 in Table 1) of the moving target, respectively. The vertical bars of Fig. 7indicate the dispersion of deviations (2σ) inside the virtual CTV at each lateral position. Figure7also shows that the slope of the average dose ratio increased as respiratory motion increased.
Assessment of range variation
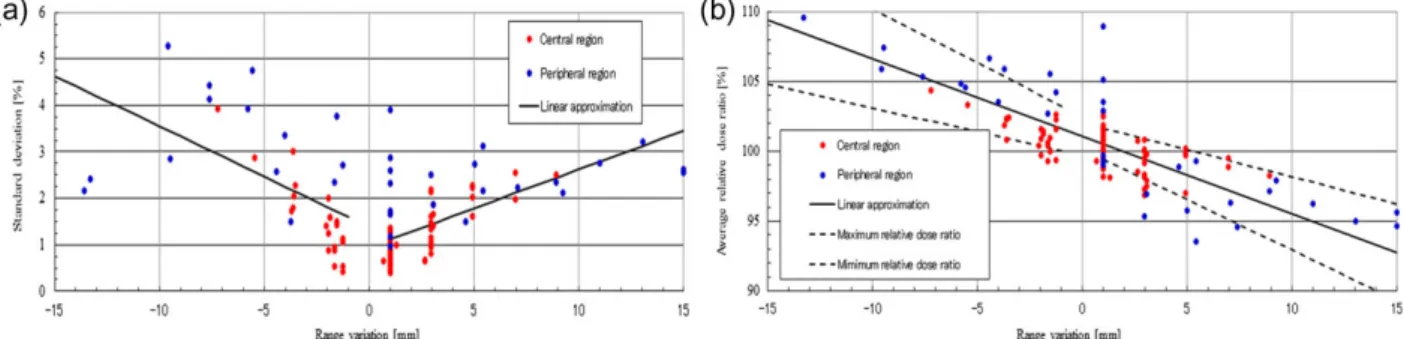
Figure 8shows (a) the standard deviation (2σ) of the dose ratio and (b) the average dose ratio in the virtual CTV, where the abscissa is the range variation converted from a change in the lateral position. These results were obtained for a lateral movement of 1 mm (Case no. 2 in Table1), 4 mm (Case no. 3 in Table1) and 20 mm (Case no. 4 in Table1). The red and blue circles in thisfig- ure indicate the central region and peripheral region in the virtual CTV, respectively. Here, the peripheral regions were defined by regions 10 mm inside the edge of the virtual CTV.
In Fig.8a, the solid black line represents the linear approxima- tion of the standard deviation (average standard deviation) from all cases. Although the standard deviations seem to be dispersed, the red circles as a whole are not.
In Fig.8b, the solid black line is also a linear approximation of the dose ratio (average dose ratio) for all cases, to evaluate the trend of the dose ratio per range variation. The black dashed lines
Beam
Range compensator
Multileaf collimator (MLC)
Wedge-shaped phantom
Depth direction Lateral moving stage Multilayer ionization chamber
(MLIC)
Target
Iso center
Free breathing Gated irradiation
Gating window Motion amplitude
superior–inferior (Lateral direction)
left–right
(Beam axis direction)
Fig. 5. Schematic illustration of a respiratory motion phantom
indicate the maximum and minimum dose ratios that were obtained by the standard deviation of the dose ratio. From thisfigure, dose uniformity became worse as range variation increased. The dose ratios were within 5% in the region of a 3-mm range variation.
Effect of beam intensity and gated irradiation
Figure 9 shows the dose ratio between the static target and the moving target (Case nos 5 and 6 of Table1) for 50% beam inten- sity with ungated and gated irradiation. The black region represents the area in which the variation in the dose ratio exceeds 5%. The colored region shows the area in which the variation in the dose ratio falls within 5%. The green dotted line is the PTV obtained by a 95% dose area of the prescribed dose for a static target, and the red-brown dotted line is the virtual CTV calculated from the PTV of the static irradiation and margins calculated from the target movements.
When comparing free breathing (Fig. 9a) with gated irradiation (Fig.9b) conditions, it can be seen that the green regions, in which the dose ratios were almost 100%, were increased for gated irradiation.
Figure10shows the average dose ratio and the standard deviation in the virtual CTV at each lateral position. A comparison of a 100%
(Case no. 3 in Table1) with a 50% (Case no. 5 in Table1) beam intensity shows similar results, despite the 50% reduction in beam intensity. The slope of the average dose ratio of gated irradiation (Case no. 6 in Table1) was the most gradual. The virtual CTV could not cover the treated volume for the moving target with a variation in dose ratio within 5%. The coverage of the treated volumes for the moving targets relative to the virtual CTVs were 95.0%, 94.8% and 97.2% in Case nos 3, 5 and 6 in Table1, respectively.
DISCUSSION
We experimentally verified the dose uniformity inside the CTV with respect to margin, range variation, and the effect of beam intensity, as well as the appropriate margins for a moving target, and gated irradiation. We noted that the dose uniformity deteriorated as respiratory motion increased. Moreover, the peripheral region in the virtual CTV showed markedly disturbed dose uniformity as com- pared with the central region in the CTV. Additionally, dose uni- formity was not affected by a reduction in the beam intensity, even by half. On the other hand, the dose uniformity was improved by gated irradiation under a similar amplitude. This is because the pos- itional variation in the beam direction in the case of the gated irradi- ation was lower than that in the case of free breathing, even for the Table 1. Breathing amplitude and margin
Case no.
Phantom motion Parameter Beam direction Lateral direction
Proximal Distal Same lateral direction of respiratory motion
Opposite lateral direction of respiratory motion
1 Static 0 0 0 0
2 Free breathing (100% beam intensity)
Breathing amplitude [mm] 0 1 1 0
Margin 3.0 3.3 2.4 2.0
3 Free breathing (100% beam intensity)
Breathing amplitude [mm] 0 1 4 0
Margin 3.0 3.3 5.7 2.4
4 Free breathing (100% beam intensity)
Breathing amplitude [mm] 0 1 20 0
Margin 3.0 3.3 26.7 7.0
5 Free breathing (50% beam intensity)
Breathing amplitude [mm] 0 1 4 0
Margin 3.0 3.3 5.7 2.4
6 Gated irradiation (50% beam intensity)
Breathing amplitude [mm] 0 0.8 (Amplitude is 1) 4 (Amplitude is 10) 0
Margin 3.0 3.3 5.7 2.4
same lateral positional variation, and the fraction of time in which the target exists at the greatest exhalation phase for the gated irradiation was larger than for the free breathing case [8].
Figure11shows the range variation in the virtual CTV, where the abscissa indicates the lateral positions. Red, blue and green lines indicate the lateral amplitudes of 1 mm (Case no. 2 in Table 1), 4 mm (Case no. 3 in Table1) and 20 mm (Case no. 4 in Table1), respectively. Black dashed lines indicate 3.3 mm from the distal mar- gin. Colored vertical lines represent the region of the virtual CTV in each lateral direction. The range variations partly exceeded the distal margin at the peripheral region for the 1 mm and 4 mm illus- trations. Therefore, additional margins may be necessary in layer- stacking irradiation of a moving target to improve dose uniformity and coverage.
The edge of the target (distal layer) was affected by respiration, as the most distal layer, which was the highest dose weight, was most affected by motion of the target motion. Therefore, layer-stacking irradiation of a moving target requires use of additional margins in the distal and lateral direction in order to obtain the required dose uniformity.
The TM for layer-stacking irradiation should thus be better cal- culated as follows:
= + + ( )
Total Margin IM2 SM2 Additional margin, 3
where additional margin is set to the slice thickness of 2.5 mm. The solid black lines in Fig.11indicate the distal margin, including the additional margin. Compared with the distal margin and range varia- tions, 1 mm and 4 mm were roughly adequate as the range variation when adding the additional margin. For 20 mm, however, the range variations were far from the distal margin, even when the additional margin was added.
Figure12shows (a) the standard deviation and (b) the average dose ratio in the virtual CTV, when including the additional margin, as a function of range variation. Similar to Fig.8, red and blue dotted circles indicate the central region and peripheral region in the virtual CTV, respectively. As shown in Fig. 12a, the standard deviations were decreased as compared with those in Fig. 8a, where the add- itional margin was not included. In Fig. 12b, the variation in the dose ratio fell within 5% for a range variation of 5 mm. When the additional margin of 5.0 mm was included, the variation in the dose ratio fell within the 5% for a range variation of 6 mm. When compar- ing the data shown in Fig.8with those in Fig.12, it is clear that the additional margin improved the acceptable range variation, in which
PTV
(Treated volume for static target) Virtual CTV
(a)
(b) (c)
superior–inferior (SI) left–right
(LR)
Fig. 6. Relative dose ratio between the static target (Case no. 1 in Table1) and the moving target in case of (a) 1 mm (Case no. 2 in Table1), (b) 4 mm (Case no. 3 in Table1) and (c) 20 mm (Case no. 4 in Table1). Green and red-brown dotted lines are the PTV and the virtual CTV, respectively. The PTV is given by the treated volume for the static target that covers 95% of the prescribed dose for a static target.
Fig. 7. Average relative dose ratio in the virtual CTV at each lateral position. Red, blue and green lines are 1 mm (Case no. 2 in Table1), 4 mm (Case no. 3 in Table1) and 20 mm (Case no. 4 in Table1), respectively.
the variation of the dose ratio was within 5%. The additional margin for the moving target should be determined based on the range vari- ation. However, unlimited large margins may not be acceptable in clinical situations. Therefore, gated layer-stacking irradiation should be applied with consideration of the available amount of additional margin and the patient’s clinical condition.
Figure13shows the dose ratio between the static target and the moving target in case of (a) 4 mm of free breathing (Case no. 5 in Table1), (b) 4 mm of gated irradiation (Case no. 6 in Table1) and (c) 20 mm of free breathing (Case no. 4 in Table1) with an add- itional margin of 2.5 mm. The virtual CTV (red-brown dotted line) was obtained from the PTV using the margins determined by Eq. (3).
As shown in Fig.13a and b, the treated volume for the moving target in which the variation of the dose ratio is within±5% covers the vir- tual CTV. On the other hand, the black region, in which the vari- ation of the dose ratio exceeded±5% is shown in Fig. 13c. These results indicate that layer-stacking irradiation of a moving target requires larger margins or an upper-limit of movement.
The coverages of the treated volumes for the moving targets relative to the virtual CTVs are summarized in Fig.14. For the case of an additional margin of 2.5 mm, the coverages of the treated volumes for the moving targets relative to the virtual CTVs were improved to 98.2%, 99.2% and 92.3% in cases of (a) 4 mm of free breathing, (b) 4 mm of gated irradiation and (c) 20 mm of free breathing, respectively. When adding a further margin of 5.0 mm, the coverage was 99.8%, 99.9% and 95.6% in cases of (a) 4 mm of free breathing, (b) 4 mm of gated irradiation and (c) 20 mm of free breathing, respectively. This coverage may be acceptable, even with Fig. 8. (a) Standard deviation and (b) average dose ratio in the virtual CTV, where the abscissa shows the range variation.
The red and blue dotted circles indicate the central region and peripheral region in the virtual CTV, respectively. In Fig.8a, the solid black line is the average standard deviation. In Fig.8b, the solid black line is the average dose ratio, and the black dashed lines are the acceptable dose ratio.
SI LR
PTV
(Treated volume for static target)
Virtual CTV
(a) (b)
Fig. 9. Relative dose ratio between the static target (Case no. 1 in Table1) and the target moving as a result of respiration in the case of (a) 50% beam intensity of free breathing (Case no. 5 in Table1) and (b) 50% beam intensity of gated irradiation (Case no. 6 in Table1). Green and red-brown dotted lines are the PTV and the virtual CTV, respectively. The PTV is given by the treated volume for the static target that covers 95% of the prescribed dose for a static target.
Fig. 10. Average relative dose ratio in the virtual CTV at each lateral position. Red, blue, and green lines are Case nos 3, 5 and 6 in Table1, respectively.
20 mm of motion. However, the value of the coverage depends on the shape of the target. Therefore, the relationship between range variation and dose uniformity should be considered.
As seen in Fig.11, use of a constant additional margin may be too large in a central region because the range variation in this area is small. Smearing can be applied to cover the range to the target for lateral positional errors [13,14]. Thus, the change in the range due to motion may also be compensated for by setting smearing instead of using an additional margin, if the smearing values in the lateral direction of respiratory motion are set to the TMs that represent the maximum range variation inside the virtual CTV.
The treated volumes for the moving targets could cover the virtual CTVs to some degree without use of an additional margin. In order to improve dose uniformity, an additional margin is needed for layer- stacking irradiation. The suggested additional margin of 2.5 mm is not a rigid value, but it is an appropriate value in some range variations for our particular ridge filter. For large lateral movements (20 mm), an additional margin of 2.5 mm would be inadequate, as compared with small lateral movements (4 mm). In clinical practice, there should be Fig. 11. Range variation in the virtual CTV, where the
abscissa is the each lateral position. Red, blue and green lines are 1 mm (Case no. 2 in Table1), 4 mm (Case no. 3 in Table1) and 20 mm (Case no. 4 in Table1),
respectively. Colored vertical lines indicate the region of the virtual CTV in each lateral direction.
Fig. 12. (a) The standard deviation and (b) the average dose ratio in the virtual CTV using Eq. (3), where the abscissa is the range variation. The red and blue dotted circles indicate the central region and peripheral region in the virtual CTV, respectively.
(a) (b) (c)
SI LR
PTV
(Treated volume for static target) Virtual CTV
Fig. 13. Relative dose ratio between the static target and the moving target in the case of (a) 4 mm of free breathing (Case no.
5 in Table1), (b) 4 mm of gated irradiation (Case no. 6 in Table1) and (c) 20 mm of free breathing (Case no. 4 in Table1).
Green and red-brown dotted lines are the PTV and the virtual CTV, respectively. The PTV is given by the treated volume for the static target that covers 95% of the prescribed dose for a static target.
an upper limit of movement amplitude. Lateral movement of a target converts to the range variation accompanied by the movement of the target. Target uniformity of 5% is achieved when the upward range variation is limited and when using an additional margin.
Although better dose uniformity could be obtained by an additional margin, it may be better to simulate the dose distribu- tions for moving targets, as some high doses appear outside the tar- get, where organs at risk may be present. In order to decrease high doses in such organs at risk, the moving distance should be limited.
Dose uniformity is achieved by superposition of slices. In this case, dose uniformity in a clinical target would largely depend on the shape of the mini-peak as well as on the bolus shape. In this report, we have expounded the relationship between range variation and dose uniformity when using a mini-peak with afixed shape. In an actual therapy case, we would consider using an upper limit of target movement based on the shape of the bolus.
ACKNOWLEDGEMENTS
The authors would like to express their thanks to other members of the Department of Heavy Ion Beam Medical Physics and Biology and the staff of the Hospital at Gunma University Heavy Ion Medical Center (GHMC) for helpful discussions, and to the crew of the Accelerator Engineering Corporation for operation of the GHMC accelerator during the complex R&D studies. This study was conducted as part of a program for cultivating global leaders in heavy ion therapeutics and engineering at Gunma University.
CONFLICT OF INTEREST The authors state that there are no conflicts of interest.
REFERENCES
1. Kanai T, Endo M, Minohara S et al. Biophysical characteristics of HIMAC clinical irradiation system for heavy-ion radiation therapy.Int J Radiat Oncol Biol Phys1999;44:201–10.
2. Noda K, Furukawa T, Fujisawa T et al. New accelerator facility for carbon-ion cancer-therapy.J Radiat Res 2007;48 Suppl A:
A43–54.
3. Ohno T, Kanai T, Yamada S et al. Carbon ion radiotherapy at the Gunma University Heavy Ion Medical Center: new facility set-up.Cancers2011;3:4046–60.
4. Kanematsu N, Endo M, Futami Y et al. Treatment planning for the layer-stacking irradiation system for three-dimensional con- formal heavy-ion radiotherapyMed Phys2002;29:2823–9.
5. Kanai T, Kanematsu N, Minohara S et al. Commissioning of a conformal irradiation system for heavy-ion radiotherapy using a layer-stacking method.Med Phys2006;33:2989–97.
6. Mori S, Kanematsu N, Asakura H et al. Four-dimensional lung treatment planning in layer-stacking carbon ion beam treat- ment: comparison of layer-stacking and conventional ungated/
gated irradiation.Int J Radiat Oncol Biol Phys2011;80:597–607.
7. Mori S, Kumagai M, Miki K. Four-dimensional layer-stacking carbon-ion beam dose distribution by use of a lung numeric phantom.Radiol Phys Technol2015;8:232–42.
8. Tashiro M, Ishii T, Koya J et al. Technical approach to indivi- dualized respiratory-gated carbon-ion therapy for mobile organs.
Radiol Phys Technol2013;6:356–66.
9. ICRU. Prescribing, recording, and reporting photon beam ther- apy. ICRU Report 50. International Commission on Radiation Units and Measurements, 1993.
10. ICRU. Prescribing, recording and reporting photon beam ther- apy (supplement to ICRU Report 50). Supplement to ICRU Report 50. International Commission on Radiation Units and Measurements, 1999.
11. ICRU. Prescribing, recording and reporting proton beam ther- apy. ICRU Report 78. International Commission on Radiation Units and Measurements, 2007.
12. Yajima K, Kanai T, Kusano Y et al. Development of a multi- layer ionization chamber for heavy-ion radiotherapy.Phys Med Biol2009;54:N107–14.
13. Engelsman M, Rietzel E, Kooy HM. Four-dimensional proton treatment planning for lung tumors.Int J Radiat Oncol Biol Phys 2006;64:1589–95.
14. Wagner MS. Automated range compensation for proton ther- apy.Med Phys1982;9:749–52.
Fig. 14. The coverages [%] of the treated volumes for the moving targets relative to the virtual CTVs.


![Fig. 14. The coverages [%] of the treated volumes for the moving targets relative to the virtual CTVs.](https://thumb-ap.123doks.com/thumbv2/123deta/6232924.1091743/9.918.86.431.99.276/coverages-treated-volumes-moving-targets-relative-virtual-ctvs.webp)
