Energy‑resolved Mass Spectrometry for Positional Isomer Differentiation of New Psychoactive Substances
著者 村上 貴哉
著者別表示 Murakami Takaya journal or
publication title
博士論文本文Full 学位授与番号 13301甲第5009号
学位名 博士(工学)
学位授与年月日 2019‑09‑26
URL http://hdl.handle.net/2297/00056478
博 士 論 文
Energy-resolved Mass Spectrometry for Positional Isomer Differentiation of
New Psychoactive Substances
エネルギー分解質量分析法による新規乱用薬物の 位置異性体識別に関する研究
金沢大学大学院自然科学研究科 物質化学専攻
学 籍 番 号 1724022007 氏 名 村 上 貴 哉 主任指導教員名 長 谷 川 浩 提 出 年 月 2019 年 9 月
List of Abbreviations
AB-FUBINACA N-(1-amino-3-methyl-1-oxobutan-2-yl)-1-(4-fluorobenzyl)- 1H-indazole-3- carboxamide
ANOVA analysis of variance
CE collision energy
CID collision-induced dissociation DFT density functional theory
EI electron ionization
ERMS energy-resolved mass spectrometry ESI electrospray ionization
FMC fluoromethcathinone
FPPP fluoro-α-pyrrolidinopropiophenone
FUBINAE 1-[1-(2-, 3-, or 4-fluorobenzyl)-1H-indazol-3-yl]ethanone
GC gas chromatography
LC liquid chromatography
LIT linear ion trap
LLE liquid-liquid extraction
LOD limit of detection
MA methamphetamine
MDMA 3,4-methylenedioxymethamphetamine MeOPPP methoxy-α-pyrrolidinopropiophenone MIP molecularly imprinted polymer
MMC methylmethcathinone
MS mass spectrometry
NMR nuclear magnetic resonance
NPS new psychoactive substance
QpQ triple quadrupole
RSD relative standard deviation
SD standard deviation
S
NAr nucleophilic aromatic substitution
SPE solid-phase extraction
TFA trifluoroacetylation
THC Δ
9-tetrahydrocannabinol
Table of Contents
List of Abbreviations ... i
Table of Contents ... ii
Chapter 1 General introduction ... 1
1.1 Recent prevalence of new psychoactive substances ... 1
1.2 NPS analysis in forensic science ... 4
1.3 Analytical problems in NPS identification ... 6
1.3.1 Continuous emergence of new structural NPSs ... 6
1.3.2 Existence of structurally similar drugs ... 7
1.3.3 Structural degradation of NPSs ... 8
1.4 Objectives ... 9
Chapter 2 Differentiation of AB-FUBINACA positional isomers by the abundance of product ions using electron ionization-triple quadrupole mass spectrometry ... 11
2.1 Introduction ... 11
2.2 Material and Methods ... 13
2.2.1 Reagents ... 13
2.2.2 Instrumentation ... 13
2.2.3 Principle of energy-resolved mass spectrometry ... 14
2.2.4 Breakdown curve fittings ... 14
2.2.5 Statistical and theoretical calculations ... 15
2.3 Results and discussion ... 16
2.3.1 Full scan mass spectrometry ... 16
2.3.2 Energy-resolved mass spectrometry ... 18
2.3.3 Positional isomer differentiation based on product ion abundances ... 22
2.3.4 Theoretical calculations of dissociation energy ... 28
2.4 Summary ... 34
Chapter 3 Elucidation of the fluorine substitution position on the phenyl ring of synthetic cannabinoids by triple quadrupole mass spectrometry ... 37
3.1 Introduction ... 37
3.2 Materials and Methods ... 38
3.2.1 Reagents ... 38
3.2.2 Synthesis of model compounds of synthetic cannabinoids ... 39
3.2.3 Instrumentation ... 40
3.2.4 Statistical calculations ... 41
3.3 Results and Discussion ... 42
3.3.1 Gas chromatography ... 42
3.3.2 Full scan mass spectrometry ... 42
3.3.4 Energy-resolved mass spectrometry ... 45
3.3.5 Breakdown curves of o-, m-, and p-FUBINAEs ... 47
3.3.6 Comparisons of o-, m-, and p-FUBINAEs with synthetic cannabinoids ... 51
3.4 Summary ... 53
Chapter 4 Differentiation of AB-FUBINACA and its five positional isomers using liquid chromatography–electrospray ionization- linear ion trap mass spectrometry and triple quadrupole mass spectrometry ... 55
4.1 Introduction ... 55
4.2 Materials and methods ... 56
4.2.1 Reagents ... 56
4.2.2 Instrumentation ... 56
4.2.3 Statistical calculations ... 57
4.3 Results and discussion ... 58
4.3.1 Liquid chromatography ... 58
4.3.2 Linear ion trap multiple-stage mass spectrometry ... 59
4.3.3 Triple quadrupole energy-resolved mass spectrometry ... 63
4.4 Summary ... 75
Chapter 5 Differentiation of the fluorine substitution position on the phenyl ring of fluoromethcathinones using energy-resolved mass spectrometry ... 77
5.1 Introduction ... 77
5.2 Material and Methods ... 78
5.2.1 Reagents ... 78
5.2.2 Instrumentation ... 79
5.2.3 Statistical and theoretical calculations ... 80
5.3 Results and discussion ... 81
5.3.1 Full scan mass spectrometry ... 81
5.3.2 Energy-resolved mass spectrometry ... 82
5.3.3 Theoretical calculations of dissociation energy ... 93
5.3.4 Comparisons with methylmethcathinone positional isomers ... 97
5.3.5 Application of the present method to forensic samples ... 102
5.4 Summary ... 103
Chapter 6 Differentiation of 2-, 3-, and 4-fluoro-α-pyrrolidino- propiophenones by Triton B-mediated one-pot reaction ... 105
6.1 Introduction ... 105
6.2.2 Syntheses ... 106
6.2.3 Synthetic procedures for optimization of Triton B-mediated reaction condition ... 107
6.2.4 Extraction procedure for instrumental analysis of reaction products .. 107
6.2.5 Instrumental analysis of reaction products ... 108
6.3 Results and discussion ... 110
6.3.1 Chromatographic and mass spectral properties of o-, m-, and p- FPPPs ... 110
6.3.2 Optimization of Triton B-mediated reaction condition ... 111
6.3.3 Application to positional isomer differentiation ... 114
6.4 Summary ... 117
Chapter 7 Molecularly imprinted polymer solid-phase extraction of synthetic cathinones from urine and whole blood samples ... 119
7.1 Introduction ... 119
7.2 Material and methods ... 121
7.2.1 Reagents ... 121
7.2.2 Synthesis of methcathinone hydrochloride ... 121
7.2.3 Sample preparation ... 122
7.2.4 Molecularly imprinted polymer solid-phase extraction procedures .... 123
7.2.5 Hydrophilic polymer-based solid-phase extraction procedure ... 123
7.2.6 Liquid-liquid extraction procedure ... 124
7.2.7 Instrumentation ... 124
7.2.8 Recovery, matrix effect, and linear regression ... 126
7.3 Results and discussion ... 127
7.3.1 Optimization of the sample solution pH ... 127
7.3.2 Influence of synthetic cathinone molecular structure on extraction efficiency ... 128
7.3.3 Extraction of synthetic cathinones from urine and whole blood samples ... 130
7.4 Summary ... 136
Chapter 8 Conclusion ... 139
References ... 143
List of Publications ... 154
Acknowledgments ... 155
Chapter 1 General introduction
1.1 Recent prevalence of new psychoactive substances
In recent years, novel synthetic drugs of abuse, generally referred to new psychoactive substances (NPSs), have been marketed as “legal highs”, “herbal highs”, and “bath salts” on the internet or are available in specialized shops called “head shops” or “smart shops”. These NPSs have rapidly emerged worldwide as “legal” alternatives to controlled drugs, posing a serious threat to public health and safety and a challenge to drug policy [1–3]. NPSs are intentionally produced by introducing slight modifications to the chemical structure of controlled drugs to provide the effects similar to those of methamphetamine (MA), 3,4-methylenedioxymethamphetamine (MDMA), and Δ
9-tetrahydrocannabinol (THC), while circumventing the existing legislative classification and penalties. Although the term
“designer drugs” has been traditionally used to mean synthetic substances, the United Nations Office on Drugs and Crime (UNODC) has been recently defined NPSs as “substances of abuse, either in a pure form or a preparation, that are not controlled by the 1961 Single Convention on Narcotic Drugs or the 1971 Convention on Psychotropic Substances, but which may pose a public health threat” [4,5], which not only includes newly developed or manufactured drugs but also recently distributed drugs that were previously developed. Till December 2017, more than 800 NPSs have been monitored in more than 110 countries and regions [4,6].
Both “synthetic cannabinoids” and “synthetic cathinones” are major emerging classes of NPSs [6]. Synthetic cannabinoids elicit cannabimimetic effects similar to THC, the active component in cannabis, by interacting with the CB
1and CB
2cannabinoid receptors [7–10].
Over the past 50 years, pharmaceutical companies and academic laboratories have developed
2008, the European Monitoring Center for Drugs and Drug Addiction (EMCDDA) discovered several synthetic cannabinoids, including JWH-018, JWH-073, and CP-47,497, in herbal products marketed as incense or room odorizers under the brand name “Spice” [11,12]. Since then, synthetic cannabinoids for recreational use have become increasingly popular among young people, because they are inexpensive and are typically not detected by the standard marijuana drug tests. From 2008 to 2014, 142 synthetic cannabinoids were reported to the EMCDDA; till 2009, a variety of herbal products labeled “Spice” was being monitored in 21 EU countries (Fig. 1.1a). Also, in 2008, synthetic cathinones first emerged on the European illicit drug market [1,2,13]. In 2009–2010, there was a significant rise in the abuse of synthetic cathinones, initially in the United Kingdom and the rest of Europe [14], and subsequently in the United States. Synthetic cathinones, which are sold as bath salts or plant food (Fig. 1.1b), have been recreationally used as alternatives to stimulants such as amphetamine, MA, and MDMA, because they have amphetamine-like psychoactive and sympathomimetic effects. [15,16]. Mephedrone, methylenedioxypyrovalerone (MDPV), and methylone were the most widely abused within Europe and the US [17].
Fig. 1.1 (a) Herbal product containing synthetic cannabinoids and (b) powder containing synthetic cathinones, marketed as ‘Spice’ and ‘bath salt’, respectively.
(a) (b)
With recent global trends in drug abuse, NPS distribution has become prevalent in Japan since 2011, increasingly leading to serious health and social concerns [18]. To deter the use of NPSs, the Japanese Ministry of Health, Labor, and Welfare (MHLW) has periodically updated the list of controlled drugs (designated substances) regulated under the Pharmaceutical and Medical Device Act (formerly the Pharmaceutical Affairs Law). However, novel NPSs are continually being developed with slight modifications to the molecular structures of regulated illicit drugs, thereby circumventing existing legal measures. This is akin to a “cat-and-mouse” game between illicit drug developers and regulators [19]. To
Fig. 1.2 Blanket scheduling of (a) synthetic cannabinoids (enforced in 2013) and (b)
1. Linear alkyl chain –CH3
–C4H9 –C2H5 –C5H11
–C3H7 –C6H13 2. alkoxyl group
3. –F –Cl –Br –I –H –O-CH3
–O-CH2-CH3
5 types 2 types 6 types
–C3H7
–C6H13
–C4H9
–C7H15
–C5H11
–C8H17
2. Linear alkenyl chain –CH=CH-C3H7
–CH2-CH=CH-C2H5
–C2H4-CH=CH-CH3 –C3H6-CH=CH2
3. Terminally halogenated, cyanidated, hydroxylated, acetoxylated linear alkyl chain
21 types 4 types 6 types 1. Linear alkyl chai
(X = F, Cl, Br, I, CN, OH, OCOCH3) –C3H6-X
–C4H8-X –C5H10-X
R2
R3
R1 H, CH
3 2 types
(a)
N O
R3
R2 R1
R2 O
R3 R1
Linear alkyl chain –CH3
–C4H9
–C2H5 –C5H11
–C3H7
–C6H13 7 types
R2
–C7H15
–CH3
–F
–C2H5
–Cl
–OCH3
–Br 8 types
R1
Methylenedioxy –I
–NHCH3
–N(CH3)(C2H5) –NHC2H5
–N(C2H5)2
–N(CH3)2
6 types
R3
1-pyrrolidinyl
(b)
resolve this issue, the MHLW has implemented a blanket scheduling of synthetic cannabinoids (enforced in 2013) and synthetic cathinones (enforced in 2014 and 2015) that allows for thorough regulation of compound classes with particular structures. Therefore, 770 synthetic cannabinoids and 1332 synthetic cathinones, as shown in Fig. 1.2, have become subject to illicit drug regulation. Furthermore, following a June 2014 fatal driving incident in Ikebukuro, Tokyo, the government strengthened the regulation and control of NPSs, resulting in the closing of all “head shops” selling NPS products and a gradual decrease of quasi-legal NPS distribution in Japan [20]. However, internet and delivery sales are persistent alternative routes of distribution. New NPSs are now widely created worldwide, and even more harmful drugs are being reported [6,21]. NPSs could be reintroduced to Japan at any moment, necessitating continuous NPS monitoring.
1.2 NPS analysis in forensic science
Analytical methods for NPSs can be broadly divided into simplified and instrumental
analyses. Simplified analyses include color tests [22,23], immunoassay screening [24], and
thin layer chromatography (TLC) [25]. Instrumental analyses include Fourier transform
infrared spectrometry (FT-IR) [26], gas chromatography (GC), liquid chromatography (LC),
capillary electrophoresis (CE) [ 27 ], and each of these chromatographic/electrophoretic
methods coupled with mass spectrometry (MS), that is, GC/MS, LC/MS, and CE/MS. MS
commonly utilizes quadrupole (Q), ion trap (IT), and time-of-flight (TOF) principles [28] to
separate molecules based on mass and can be used in combination as triple quadrupole (QqQ)
[29], Q-TOF [30], or IT-TOF [31]. Recently, orbitrap mass spectrometers, which operate
based on the electrodynamic squeezing principle, have been developed and enable
ultra-high-resolution analysis with consistent mass accuracy [28,32]. Commonly used MS
ionization methods for coupling with GC include electron ionization (EI) and chemical
ionization (CI), whereas electrospray ionization (ESI) and atmospheric pressure chemical ionization (APCI) are more commonly coupled with LC [28]. Based on the guidelines provided by the Scientific Working Group for the Analysis of Seized Drugs (SWGDRUG), which mainly consists of the American Drug Enforcement Administration (DEA), multiple uncorrelated analytical techniques are required to crosscheck the chemical structure of a suspected drug [33]. Furthermore, it is recommended that at least one analytical method that yields direct structural information is included. GC/MS and LC/MS satisfy these requirements as they exhibit high sensitivity and are capable of analyzing samples containing impurities, making them suitable methods for drug analysis.
Fig. 1.3 NPS analysis workflow.
Forensic sample containing NPS
Standard reagent in lab?
Commercially available?
Purchase
Compare with the standard data
Hit No hit
NPS structure identification No
Yes
Synthesize No
NMR Additional analysis using HRMS
Can the analyte be isolated?
Structure estimation No
Instrumental analysis (GC/MS, LC/MS)
Database search Extraction (LLE, SPE)
Yes
Yes
A typical NPS analysis workflow is shown schematically in Fig. 1.3. First, the drug in the sample is extracted by using liquid-liquid extraction (LLE) or solid-phase extraction (SPE), which is subsequently analyzed using GC/MS or LC/MS. If the obtained data corresponds with database spectra, the sample is then comparatively analyzed against a reference standard.
If the analyte and standard data match, the NPS structure can be conclusively determined. If the reference standard is not available, it must be commercially purchased or synthesized in-house. However, if the obtained data return no database matches, high-resolution mass spectrometry (HRMS) must be performed to obtain the accurate mass of the analyte. If the sample is comprised of a single drug (without significant impurities), nuclear magnetic resonance (NMR) spectroscopy can be used for analyte structure determination. If the sample contains significant impurities, the analyte must be purified using preparative LC or TLC and subsequently analyzed by NMR spectroscopy for structure determination. If insufficient analyte is isolated for NMR analysis, as is the case for many biological samples, the sample is subjected to multiple analytical methods and the chemical structure of the analyte is determined by verification of the consistency of all obtained data from multiple methods.
Candidate standards are obtained via purchase or synthesis and comparatively analyzed with the analyte for structure determination. From this workflow, unlike routinely analyzed drugs of abuse, such as MA or MDMA, the positive identification of the chemical structure of unknown NPSs requires many analytical techniques.
1.3 Analytical problems in NPS identification
1.3.1 Continuous emergence of new structural NPSs
NPSs are continuously created by slightly changing the molecular structure of an illicit
drug to avoid legal prosecution. As of June 2019, the number of designed substances has risen
to 2378 under the Pharmaceutical and Medical Device Act, of which 855 are synthetic
cannabinoids (36% of all designated substances) and 1353 are synthetic cathinones (57% of all designated substances). Thus, although drug analysis always requires a reference standard of the analyte, preparing this massive number of standard reagents is not practical. Moreover, analytical methods and data of newly emerging NPSs are seldom reported, and their pharmacological activity and metabolism remain unknown. Therefore, NPS identification should be carefully performed based on the data obtained by multiple analytical techniques, considering the possibility of a wide array of chemical structures.
1.3.2 Existence of structurally similar drugs
NPSs include many structural and positional isomers bearing substituents at different
positions in the molecular structure [34,35]. Positional isomers of NPSs often cause legal and
analytical difficulties. For instance, AB-FUBINACA fluorine positional isomers are
separately classified in terms of legislative action (ortho and para: designated substances,
meta: uncontrolled) and methylmethcathinone methyl positional isomers are subject to
different laws (ortho and meta: designated substances, para: narcotic) (Fig. 1.4). These
legislations necessitate clear determination of the isomeric structures of an analyte. NMR is
considered to be the most appropriate method for differentiating isomers, but it is ill-suited for
forensic samples because it requires large (mg-scale) sample quantities and be present at
non-trace levels. Therefore, forensic analysts often use chromatography and MS as alternative
methods. Isomer standard reagents of NPSs are required for isomeric differentiation analysis
using these methods, but these standards are rarely commercially available and must be
synthesized in-house. These steps represent a time-consuming and financial burden for
forensic analysts.
1.3.3 Structural degradation of NPSs
The storage, extraction, and instrumental analytical conditions may promote NPS decomposition, potentially resulting in missing the analyte or erroneously assigning an improper chemical structure. Some examples of such cases are described below.
・ All synthetic cathinones decompose under neutral to basic conditions [36].
・ When synthetic cannabinoids containing an ester bond (e.g., 5F-PB-22, QUPIC, and SDB-005) dissolved in alcoholic solutions are subjected to GC, transesterification can occur in the GC inlet.
・ Synthetic cannabinoids containing a tetramethylcyclopropyl group (e.g., UR-144, XLR-11, and FUB-144) can be thermally decomposed in the GC inlet [37].
・ CHMINACA-BA and BiPICANA cannot be detected by EI-MS.
・ Synthetic cathinones are readily thermally decomposed in the GC inlet, yielding
para:narcotic O H3C HN
O HN CH3 N N
NH O
NH2 O
F
meta:uncontrolled N N
NH O
NH2 O
F
N N NH O
NH2 O
F
Methylmethcathinone positional isomers AB-FUBINACA positional isomers
para:designated substance ortho:designated
substance
O HN H3C
meta:designated substance ortho:designated
substance
Fig. 1.4 Legal status of positional isomers of AB-FUBINACA and methylmethcathinone.
2,3-enamine products [38].
・ Synthetic cathinones containing a fluorine group at the ortho position of the phenyl ring (e.g., 2-fluoromethcathinone ,2-fluoroethcathinone, and 2-fluoro-α-pyrrolidinopropio- phenone) can thermally undergo intramolecular cyclization reactions via HF elimination in the GC inlet [39].
・ t-Boc-MA and t-Boc-MDMA (MA and MDMA attached to tert-butoxycarbonyl groups at the N-position) can thermally degrade into MA and MDMA in the GC inlet [40].
1.4 Objectives
Considering the abovementioned issues, NPS analysis requires strict identification of the
chemical structure and accurate determination of the applicable legal regulation. However, the
ortho, meta, and para ring-fluorinated positional isomers of synthetic cannabinoids and
synthetic cathinones exhibit only small differences in retention time and very similar mass
spectra patterns, confounding their positive identified. Herein, a novel and practical analytical
method to unambiguously and reliably differentiate the ring-fluorinated positional isomers
was developed utilizing energy-resolved mass spectrometry (ERMS) (Chapters 2–5). The
usefulness of derivatization method with a Triton B-mediated one-pot reaction for
differentiating the ring-fluorinated synthetic cathinone positional isomers was also
demonstrated (Chapter 6). Conventional pretreatment methods for the extraction of synthetic
cathinones, like hydrophilic polymer-based SPE and LLE, does not exclude the biological
matrices sufficiently and processes a risk of target analyte decomposition. To address this
issue, a class-selective sample clean-up method for the extraction of synthetic cathinones
from urine and whole blood samples, was developed using a molecularly imprinted polymer
Chapter 2
Differentiation of AB-FUBINACA positional isomers by the
abundance of product ions using electron ionization-triple quadrupole mass spectrometry
2.1 Introduction
Synthetic cannabinoids are full agonists to the CB
1and CB
2cannabinoid receptors and elicit cannabimimetic effects similar to THC [41–43]. Synthetic cannabinoids have prevailed globally since herbal mixtures, referred to as “Spice” or “K2”, were first marketed as legal natural products [44], resulting in numerous serious incidents involving individuals under their influence. To immediately deter the epidemic of drug abuse, many countries have increased the number of individually named controlled substances. However, structurally distinct NPSs aimed at circumventing such legal measures have continued to be synthesized.
In an attempting to address worldwide social concerns, the UK government has implemented a blanket scheduling of synthetic cannabinoids through the introduction of generic legislation based on modifications to core structures, as recommended by the UK home office from the Advisory Council on the Misuse of Drugs (ACMD) in 2009 [45]. However, this regulation did not deter the prevalence of synthetic cannabinoids. Indeed, according to reports from the Forensic Early Warning System (FEWS) in 2012, noncontrolled synthetic cannabinoids such as AM2201, RCS-4, and UR-144, so-called “second-generation” synthetic cannabinoids, were frequently detected in forensic seizures [46–48].
A new designer indazole-type synthetic cannabinoid drug bearing a 4-fluorobenzyl group
at the N-1 position, N-(1-amino-3-methyl-1-oxobutan-2-yl)-1-(4-fluorobenzyl)-1H-indazole-
agonist to the CB
1receptor, which has a much higher affinity for this receptor (K
i= 0.9 nM) than THC (K
i= 41 nM) [51]. AB-FUBINACA was one of the most identified components of herbal products in early 2012, and was subsequently scheduled as a “designated substance”
under the Pharmaceutical and Medical Device Act in December 2012 in Japan, and its 2-fluorobenzyl (ortho) isomer was added to the law in December 2015. In the United States, AB-FUBINACA and its ortho and 3-fluorobenzyl (meta) isomers were all listed as schedule I narcotics in February 2014. These laws require an ability to clearly determine the isomeric structures of an analyte. In this regard, NMR is considered to be the most appropriate instrument to determine the structures of analytes, but it is unsuitable for forensic samples because of their minute amounts or high levels of impurities. GC/MS was often employed as an alternative method, which makes it possible to analyze small and impure samples and provides abundant structural information because of the occurrence of various fragment ions.
So far, several research groups have discriminated isomers of abused drugs by the difference
of retention time and/or the occurrence of fragment ions using GC/MS [52–59]. However, the
three AB-FUBINACA isomers exhibit similar retention properties and give identical fragment
ions in mass spectra [60]. Such legal and analytical difficulties prompted to obtain reliable
evidence for differentiation of the positional isomers. To this end, we utilized
GC/EI-QqQ-MS in product ion scan mode for the three AB-FUBINACA positional isomers
and investigated the abundances of the product ions as a function of collision energy (CE),
so-called “energy-resolved mass spectrometry (ERMS)” [61–63], whose technique can help
to interpret the structures of various compounds, including steroids [64], disaccharides [65],
oligosaccharides [66,67], and N-glycans [68]. We found significant differences in the
abundances of the two characteristic product ions among the three isomers attributed to
differences in bond dissociation reactivities. This is the first study on positional isomer
differentiation of synthetic cannabinoids based on the ERMS methodology.
2.2 Material and Methods
2.2.1 Reagents
AB-FUBINACA and its 2-fluorobenzyl (ortho) and 3-fluorobenzyl (meta) isomers were purchased from Cayman Chemical (Ann Arbor, MI, USA). Standard stock solutions of the AB-FUBINACA positional isomers were prepared in methanol at concentrations of 200 μg/mL and were stored at −20°C prior to use. The working standard solutions for the injections into the mass spectrometer (20 μg/mL) were prepared by diluting the stock solutions.
2.2.2 Instrumentation
Mass spectra were obtained by a SCION TQ triple quadrupole mass spectrometer (Bruker Daltonics, Billerica, MA, USA) with fused-silica capillary columns BR-5ms (30 m × 0.25 mm i.d., 0.25-μm film thickness; Bruker Daltonics). The inlet temperature was set at 200°C.
The injection mode was splitless. Sample injection volume was 1 μL. The carrier gas was high-purity helium (six nine-grade) at a constant column flow rate of 45.1 cm/s. The temperature program for full scan mode consisted of an initial temperature at 80°C held for 1 min, ramped up to 300°C at 10°C/min followed by a hold at 300°C for 15 min. The temperature program for product ion scan mode consisted of an initial temperature at 200°C held for 1 min, ramped up to 300°C at 10°C/min followed by a hold at 300°C for 10 min. The transfer line was maintained at 280°C. The mass spectrometer was operated in EI mode at 70 eV using an ion source temperature of 230°C. The acquisition of full scan mode was in the range of m/z 40–600. The acquisition of product ion scan mode was in the range of m/z 40–
109, 40–253 and 40–324 for the precursor ions at m/z 109, 253 and 324, respectively. Argon
2.2.3 Principle of energy-resolved mass spectrometry
Mass spectrometers equipped with CID enabled the observation of product ions produced by fragmentation of a precursor ion. ERMS is an analytical method where product ion data as a function of CE can be obtained on a chromatographic timescale, potentiating detailed tracking of activation-induced ion dissociation behavior. Triple quadrupole mass spectrometers were used to perform ERMS for the precursor ions containing a positional isomeric moiety (Fig. 2.1). Dissociation energy depends on the molecular structure of the ion, and the yields of the product ions differ between positional isomer analytes. Herein, the yields of the obtained product ions were quantitatively evaluated and compared between NPS positional isomers.
2.2.4 Breakdown curve fittings
The abundances of selected ions in the product ion spectra were taken as the areas of the mass chromatographic peaks to avoid the effect of spectral skewing. The plots of the abundances against CEs were fitted with the Boltzmann sigmoidal function with nonlinear regression analysis using KaleidaGraph Ver. 3.52 (Synergy Software, Reading, PA, USA) [66].
y =
[( )/ ](growth)
Fig. 2.1 ERMS principle using a triple quadrupole mass spectrometer in product ion scan
mode.
y =
[ ( )/ ](decay)
where the parameters a, b, and c denote the maximum response, half the maximum response and the slope, respectively.
2.2.5 Statistical and theoretical calculations
Statistical analysis was performed using Microsoft Excel 2010. One-way analysis of variance (ANOVA) was used to determine whether there were any significant differences among the three isomers and was followed by multiple pairwise comparisons as post hoc analysis using Ryan’s method [69].
Quantum chemical calculations were performed with Gaussian 09 Rev. D (Gaussian, Inc.,
Wallingford, CT, USA). The geometries of all the studied compounds were optimized using
density functional theory (DFT) at the B3LYP/6-31G(d,p) level [70–73]. Each optimized
structure was confirmed by frequency calculation to be the true energy minimum with the
absence of imaginary vibration frequencies. The self-consistent field convergence required
both < 10
−6energy change and < 10
−8root mean square change in the density matrix. No
symmetry constraint was imposed in the optimization. The optimized structures were shown
by Winmostar program [74]. The dissociation energy can be given as the difference between
the total free energy of the dissociated species and those of the precursor species, including
the electronic energy and zero-point corrections generated from a vibrational frequency
calculation [75].
2.3 Results and discussion
2.3.1 Full scan mass spectrometry
Figure 2.2 shows EI-full scan mass spectra of the three AB-FUBINACA isomers. All the isomers underwent three main fragmentations. The proposed EI-fragmentation pathways are shown in Fig. 2.3. The fragment ion at m/z 109, which constitutes base peak, corresponds to the fluorobenzyl cation (or fluorotropylium cation) resulting from the cleavage of methylene
Fig. 2.2 EI-full scan mass spectra of (a) AB-FUBINACA (para) and (b) its ortho and (c)
meta isomers.
linkage between the indazole moiety and the fluorobenzyl group. The second-most abundant fragment ion at m/z 253 was generated by elimination of NHCHiPrCONH
2in the carboxamide side chain. The fragment ion at m/z 324 was formed by elimination of CONH
2at the side chain end. The minor fragment ions at m/z 83 and 145 occurred via elimination of acetylene from the m/z 109 ion and via elimination of the flurobenzyl group from the m/z 253 ion, respectively. Although the relative abundances of the AB-FUBINACA ions at m/z 253 and 324 were slightly less than those of the ortho and meta isomers, the three spectra were highly similar to each other. Therefore, full scan mass spectra were unsuitable for differentiation.
N N NH O
F NH2 O
N N NH O
F F
EI
m/z324 m/z253
m/z109 m/z83
Mwt 368
F F
m/z145 N N
F O
N N C
F O
N N H
C O
Fig. 2.3 Proposed fragmentation pathways of the AB-FUBINACA isomers by EI.
2.3.2 Energy-resolved mass spectrometry
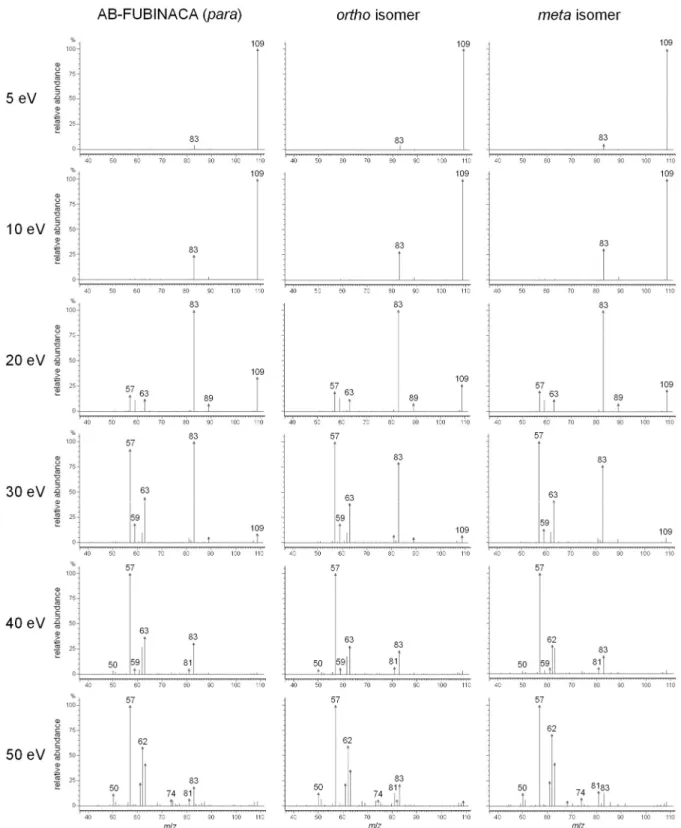
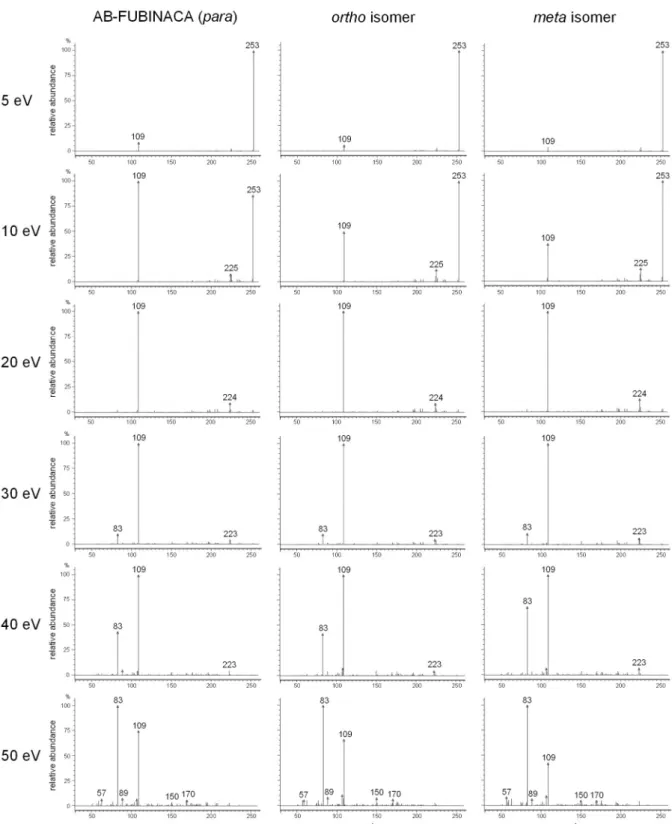
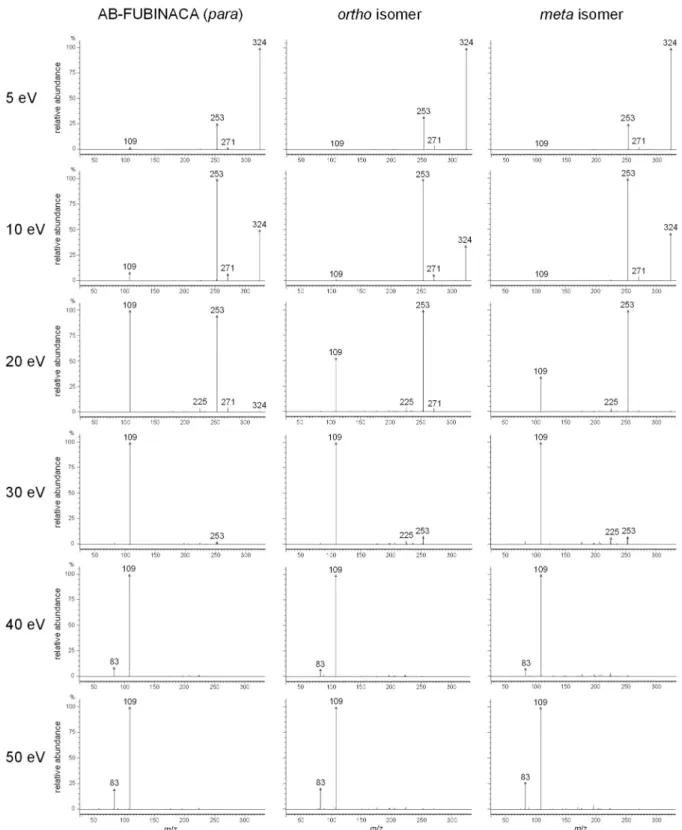
To differentiate the three isomers, ERMS was performed in product ion scan mode for the precursor ions at m/z 109, 253 and 324. The CE was set at 5, 10, 20, 30, 40 and 50 eV. All of the obtained spectra are shown in Figs 2.4–2.6. The spectra for the precursor ion at m/z 109 were difficult to distinguish at any CE (Fig. 2.4). In the spectra for the precursor ion at m/z 253 (Fig. 2.5), the relative abundance of the ion at m/z 109 at CE of 10 eV varied among the three isomers in the order meta < ortho < AB-FUBINACA (para), indicating that the yield of the fluorobenzyl cation depends on the difference of the fluorine substitution position on the phenyl ring, although the difference between the ortho and meta isomers was slight. The spectral patterns at 5, 20, 30, 40 and 50 eV were similar. In the spectra for the precursor ion at m/z 324 (Fig. 2.6), the relative abundance of the AB-FUBINACA ion at m/z 109 at 10 eV was higher than those of the ortho and meta isomers. The spectral patterns of the three isomers at 20 eV clearly differed in the relative abundance of the m/z 109 ion in the order meta < ortho <
para. The relative abundance of the AB-FUBINACA ion at m/z 253 at 30 eV was slightly
lower than those of the ortho and meta isomers. The spectral patterns of the three isomers at 5,
40 and 50 eV were almost identical to each other.
Fig. 2.4 Product ion spectra for the precursor ion at m/z 109. The CE was set at 5, 10, 20, 30,
40, and 50 eV.
Fig. 2.5 Product ion spectra for the precursor ion at m/z 253. The CE was set at 5, 10, 20,
30, 40, and 50 eV.
Fig. 2.6 Product ion spectra for the precursor ion at m/z 324. The CE was set at 5, 10, 20,
30, 40, and 50 eV.
2.3.3 Positional isomer differentiation based on product ion abundances
Based on the aforementioned results, the key ions for differentiation appear to be m/z 109 and 253. To better understand the behaviors of the product ions, ERMS was also performed with CE setting varying from 12 to 28 eV in increments of 2 eV. The precursor ion was set at
0 20 40 60 80 100
12 14 16 18 20 22 24 26 28
Percentage (%TIC)
0 20 40 60 80 100
12 14 16 18 20 22 24 26 28
Percentage (%TIC)
0 20 40 60 80 100
12 14 16 18 20 22 24 26 28
Collison Energy (eV)
Percentage (%TIC)
(a)
(b)
(c)
◇ m/z83
● m/z109
▽ m/z225
▲ m/z253
× m/z271
■ m/z324
meta isomer ortho isomer AB-FUBINACA
(para)
◇ m/z83
● m/z109
▽ m/z225
▲ m/z253
× m/z271
■ m/z324
◇ m/z83
● m/z109
▽ m/z225
▲ m/z253
× m/z271
■ m/z324
Collision energy (eV)
Fig. 2.7 Breakdown curves of (a) AB-FUBINACA (para), (b) its ortho, and (c) meta
isomers in the CE range of 12–28 eV. The precursor ion was set at m/z 324. Error bars of the
ions at m/z 109 and 253 represent standard errors (n = 5).
m/z 324. The abundance of a selected ion, expressed as a percentage of the total ion current (%TIC), was plotted against CE to yield “breakdown curve” (Fig. 2.7). The decomposition of the m/z 324 ion almost always produced the two ions at m/z 109 and 253. Small amounts of the product ions at m/z 83, 225, and 271 were generated at various CEs. The ion intensity at m/z 109 and 253 increased and decreased with increasing CE, respectively. The increment of m/z 109 was almost equal to the decrement of m/z 253, indicating that the generation of the m/z 109 ion resulted from the cleavage of the m/z 253 ion. Although the three breakdown curve patterns were apparently similar, the CE values on the intersection point of the sigmoidal-shaped growth (m/z 109) and decay (m/z 253) curves were different among the three isomers. These results were guaranteed by high reproducibility of mass spectral data.
The standard deviations of the two key ions at m/z 109 and 253, determined by the variabilities of the abundances (%TIC) at each CE, were < 1.1 and < 1.1 for intraday, and <
1.0 and < 0.9 for interday, respectively (n = 5, Tables 2.1 and 2.2).
Table 2.1 Standard deviations determined by intraday variability of the abundances (%TIC) of the m/z 109 and 253 ions at each CE (n = 5).
CE (eV) AB-FUBINACA ortho isomer meta isomer
m/z 109 m/z 253 m/z 109 m/z 253 m/z 109 m/z 253
12 0.3 0.5 0.1 0.6 0.1 0.1
14 0.2 0.3 0.3 0.7 0.2 0.2
16 0.3 0.3 0.7 0.8 0.3 0.5
18 0.5 0.5 1.0 1.1 0.3 0.4
20 0.3 0.4 1.0 1.1 0.5 0.7
22 0.5 0.1 1.0 0.8 0.5 0.7
24 0.5 0.4 0.7 0.7 0.5 0.5
26 0.7 0.2 0.9 0.4 0.4 0.5
28 0.7 0.3 1.1 0.5 0.4 0.3
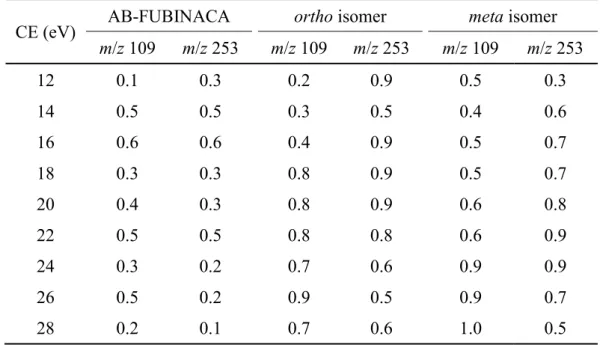
Table 2.2 Standard deviations determined by interday variability of the abundances (%TIC) of the m/z 109 and 253 ions at each CE (n = 5).
To make the difference clearer, the natural logarithmic values of the abundance ratio of the m/z 109 ion to the 253 ion [ln(A
109/A
253)], assuming that CID reaction was quantitatively occurred in accordance with Gibbs free energy equation, were plotted against the CE. The ln(A
109/A
253) values showed the relation of meta < ortho < para at any CE (Fig. 2.8), and thus it suggested that the three isomers required different energies for cleaving the fluorobenzyl group from the indazole moiety. In addition, the ln(A
109/A
253) values for each isomer were linearly related to the CE with high correlation coefficients, decisively separating the three approximation lines (Fig. 2.8). One-way ANOVA showed that the ln(A
109/A
253) values of the three isomers were significantly different at each CE (significance α < 9.0× 10
−7; Table 2.3), indicating that the within-sample variances were much smaller than the between-sample variances (F value), and multiple pairwise comparisons showed low p values (< 1.4 × 10
−2) at each CE, revealing that the differences in the ln(A
109/A
253) values of the three isomers were statistically significant. A comparison of ln(A
109/A
253) values at various CEs allowed the three isomers to be more clearly and more reliably differentiated than a comparison of only values at a certain CE.
CE (eV) AB-FUBINACA ortho isomer meta isomer
m/z 109 m/z 253 m/z 109 m/z 253 m/z 109 m/z 253
12 0.1 0.3 0.2 0.9 0.5 0.3
14 0.5 0.5 0.3 0.5 0.4 0.6
16 0.6 0.6 0.4 0.9 0.5 0.7
18 0.3 0.3 0.8 0.9 0.5 0.7
20 0.4 0.3 0.8 0.9 0.6 0.8
22 0.5 0.5 0.8 0.8 0.6 0.9
24 0.3 0.2 0.7 0.6 0.9 0.9
26 0.5 0.2 0.9 0.5 0.9 0.7
28 0.2 0.1 0.7 0.6 1.0 0.5
Table 2.3 One-way analysis of variance (ANOVA) and multiple pairwise comparisons for logarithmic values of the abundance ratio of the ion at m/z 109 to m/z 253 [ln(A
109/A
253)]
for the precursor ion at m/z 324 of the AB-FUBINACA positional isomers.
CE (eV) One-way ANOVA Multiple pairwise comparisons (p) F value Significance (α) para × ortho para × meta ortho × meta 12 98.8 3.5 × 10
−81.4 × 10
−52.1 × 10
−41.4 × 10
−214 96.2 4.1 × 10
−84.2 × 10
−56.5 × 10
−51.6 × 10
−316 55.1 9.0 × 10
−71.7 × 10
−44.7 × 10
−41.0 × 10
−318 92.0 5.3 × 10
−87.0 × 10
−53.4 × 10
−58.2 × 10
−620 133 6.6 × 10
−92.5 × 10
−53.9 × 10
−53.8 × 10
−422 90.8 5.7 × 10
−85.2 × 10
−58.5 × 10
−53.6 × 10
−424 129 7.8 × 10
−92.1 × 10
−55.4 × 10
−63.8 × 10
−326 91.4 5.5 × 10
−83.4 × 10
−41.3 × 10
−47.3 × 10
−328 196 6.8 × 10
−101.8 × 10
−57.1 × 10
−53.8 × 10
−4Fig. 2.8 Logarithmic plots of the abundance ratio of the m/z 109 ion to the 253 ion for the precursor ion at m/z 324. Error bars represent standard errors (n = 5).
-3 -2 -1 0 1 2 3
12 14 16 18 20 22 24 26 28
ln ( A
109/ A
253)
Collision Energy (eV)
● AB-FUBINACA,
▲ orthoisomer,
■ meta isomer,
R = 0.9998 R = 0.9999 R = 0.9996
Collision energy (eV)
Similar results were obtained for the precursor ion at m/z 253 (Figs 2.9 and 2.10, and Table 2.4). Although, in the case of isomeric mixture, the AB-FUBINACA isomers could not be baseline separated on the chromatographic analysis using BR-5ms column (Fig. 2.11), the fluorine-substituted position of each isomer was able to be identified by comparing the
0 20 40 60 80 100
6 8 10 12 14 16
Percentage (%TIC)
Collison Energy (eV) 0
20 40 60 80 100
6 8 10 12 14 16
Percentage (%TIC)
0 20 40 60 80 100
6 8 10 12 14 16
Percentage (%TIC)
● m/z109
◆ m/z205
▽ m/z225
□ m/z235
▲ m/z253
(a)
(b)
(c)
● m/z109
◆ m/z205
▽ m/z225
□ m/z235
▲ m/z253
● m/z109
◆ m/z205
▽ m/z225
□ m/z235
▲ m/z253
meta isomer ortho isomer AB-FUBINACA
(para)
Collision energy (eV)
Fig. 2.9 Breakdown curves of (a) AB-FUBINACA (para), (b) its ortho, and (c) meta
isomers in the CE range of 6–16 eV. The precursor ion was set at m/z 253. Error bars of the
ions at m/z 109 and 253 represent standard errors (n = 5).
ln(A
109/A
253) values extracted from the mass spectra at non-overlapping parts on adjacent peaks in chromatogram.
Table 2.4 One-way analysis of variance (ANOVA) and multiple pairwise comparisons for logarithmic values of the abundance ratio of the ion at m/z 109 to m/z 253 [ln(A
109/A
253)]
for the precursor ion at m/z 253 of the AB-FUBINACA positional isomers.
CE (eV) One-way ANOVA Multiple pairwise comparisons (p) F value Significance (α) para × ortho para × meta ortho × meta 6 546 1.6 × 10
−123.2 × 10
−53.6 × 10
−61.3 × 10
−47 262 1.3 × 10
−103.4 × 10
−43.5 × 10
−52.9 × 10
−38 242 2.0 × 10
−101.3 × 10
−43.2 × 10
−42.7 × 10
−39 346 2.5 × 10
−117.2 × 10
−51.2 × 10
−42.5 × 10
−410 157 2.5 × 10
−91.6 × 10
−35.0 × 10
−44.0 × 10
−412 213 4.2 × 10
−102.7 × 10
−42.3 × 10
−49.0 × 10
−314 71.1 2.2 × 10
−75.0 × 10
−37.5 × 10
−44.9 × 10
−2Fig. 2.10 Logarithmic plots of the abundance ratio of the m/z 109 ion to the 253 ion for the precursor ion at m/z 253. Error bars represent standard errors (n = 5).
-2.4 -1.6 -0.8 0 0.8 1.6 2.4 3.2
6 8 10 12 14 16
ln ( A
109/ A
253)
Collision Energy (eV)
● AB-FUBINACA,
▲ orthoisomer,
■ meta isomer,
R = 0.9998 R = 0.9988 R = 0.9996
Collision energy (eV)
2.3.4 Theoretical calculations of dissociation energy
DFT calculations are helpful to interpret the experimental results [76]. Free energies of the molecules involved in the cleavage reaction of the m/z 253 ion generated by CID were calculated at the B3LYP/6-31G(d,p) level. Skeletal rearrangements such as the change of benzyl cations to tropylium ions were not considered. The optimized structures, geometries, and calculated free energies of the product ions (para, ortho, and meta-m/z 253, 225, and 109) and neutrals (N144 and N116) are shown in Fig. 2.12, Tables 2.5, and 2.6, respectively.
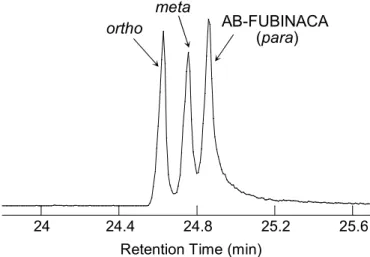
Fig. 2.11 Total ion current chromatogram of the mixture of three AB-FUBINACA isomers.
Column, BR-5ms; acquisition mode, product ion scan; precursor ion, m/z 324; column temperature program, 80°C (1 min)–10°C/min→300°C (15 min).
AB-FUBINACA (para) ortho
meta
24 24.4 24.8 25.2 25.6
Retention Time (min)
Fig. 2.12 Optimized structures of the para, ortho, and meta-m/z 253, 225, and 109 ions
and neutrals (N144
aand N116
b) at B3LYP/6-31G(d,p) level.
Table 2.5 Geometries of the para, ortho, and meta-m/z 253, 225, and 109 ions and neutrals (N144 and N116) at B3LYP/6-31G(d,p) level.
para-m/z 253 ortho-m/z 253 meta-m/z 253
Center number Atom
Coordinates [Angstroms] Center number Atom
Coordinates [Angstroms] Center number Atom
Coordinates [Angstroms]
x y z x y z x y z
1 C 2.63196 −2.73793 −0.73097 1 C −2.63492 −2.60325 0.86458 1 C −2.71980 2.50492 −1.09854 2 C 1.39572 −2.98773 −0.09493 2 C −1.36276 −2.94832 0.35716 2 C −1.50983 2.94762 −0.51925 3 C 0.66185 −1.97042 0.49669 3 C −0.53661 −2.01023 −0.24423 3 C −0.70292 2.09749 0.22208 4 C 1.21424 −0.68551 0.43085 4 C −1.03694 −0.70439 −0.31997 4 C −1.15547 0.78040 0.36606 5 C 2.44859 −0.42495 −0.20576 5 C −2.30713 −0.34713 0.18661 5 C −2.36211 0.32654 −0.21218 6 C 3.17628 −1.46143 −0.79860 6 C −3.12656 −1.30564 0.79027 6 C −3.16411 1.19598 −0.95811 7 N 0.75089 0.53286 0.92822 7 N −0.48122 0.45293 −0.86570 7 N −0.60092 −0.30345 1.04659 8 N 1.54230 1.53525 0.67438 8 N −1.24504 1.50149 −0.75935 8 N −1.30964 −1.39272 0.96095 9 C 2.59860 1.00180 −0.02042 9 C −2.37832 1.06474 −0.11984 9 C −2.40066 −1.06006 0.19847 10 C 3.60430 1.83518 −0.41619 10 C −3.37657 1.96282 0.12230 10 C −3.33429 −2.02299 −0.05593 11 C −0.51016 0.78076 1.67583 11 C 0.85502 0.59788 −1.50400 11 C 0.67087 −0.32638 1.80960 12 C −1.73982 0.55204 0.82811 12 C 1.97762 0.61103 −0.49620 12 C 1.88033 −0.14820 0.91699 13 O 4.46446 2.50368 −0.76254 13 O −4.23322 2.68744 0.34174 13 O −4.13581 −2.80366 −0.28889 14 C −2.67969 −0.41773 1.19866 14 C 2.80453 −0.50258 −0.34075 14 C 2.11823 −1.05389 −0.12422 15 C −3.83617 −0.61235 0.44553 15 C 3.86972 −0.53153 0.54744 15 C 3.25210 −0.88565 −0.90848 16 C −4.03321 0.17332 −0.68532 16 C 4.11925 0.60410 1.31747 16 C 4.16061 0.14677 −0.68753 17 C −3.11777 1.14812 −1.07822 17 C 3.31240 1.73912 1.18971 17 C 3.91680 1.03596 0.35652 18 C −1.97236 1.33572 −0.31193 18 C 2.25246 1.74152 0.28658 18 C 2.77842 0.89716 1.15571 19 H 3.16883 −3.56648 −1.18037 19 F 2.54993 −1.60551 −1.09341 19 H −3.31621 3.20738 −1.67083 20 H 1.02024 −4.00120 −0.07244 20 H −3.24384 −3.37364 1.32550 20 H −1.20360 3.97814 −0.66225 21 H −0.29399 −2.15801 0.96944 21 H −1.02306 −3.97482 0.44173 21 H 0.23445 2.42943 0.65081 22 H 4.12615 −1.28560 −1.29155 22 H 0.44502 −2.26922 −0.62162 22 H −4.09462 0.87121 −1.41066 23 H −0.42081 1.81149 2.02435 23 H −4.10554 −1.05632 1.18471 23 H 0.66748 −1.28906 2.32453 24 H −0.49550 0.11850 2.54570 24 H 0.79631 1.53386 −2.06012 24 H 0.60854 0.46882 2.55693 25 H −3.31831 1.74512 −1.96060 25 H 0.96008 −0.23007 −2.20660 25 H 5.03488 0.23445 −1.32261 26 H −1.25986 2.10365 −0.60093 26 H 4.48254 −1.42289 0.61901 26 H 4.61725 1.84151 0.55017 27 H −2.52380 −1.01514 2.09339 27 H 4.94981 0.60306 2.01558 27 H 2.60590 1.58909 1.97543 28 F −5.13732 −0.00897 −1.41857 28 H 3.51776 2.62208 1.78503 28 F 3.47611 −1.75071 −1.90798 29 H −4.57947 −1.35119 0.72242 29 H 1.63393 2.62803 0.17594 29 H 1.45225 −1.88610 −0.32852
Table 2.5 Continued.
para-m/z 225 ortho-m/z 225 meta-m/z 225
Center number Atom
Coordinates [Angstroms] Center number Atom
Coordinates [Angstroms] Center number Atom
Coordinates [Angstroms]
x y z x y z x y z
1 C −4.85864 −0.16243 0.52659 1 C −3.85337 1.17310 −0.74256 1 C 4.88170 −0.01496 −0.22629 2 C −4.28774 1.12098 0.60523 2 C −2.79613 1.90158 −0.17069 2 C 4.26658 1.24852 −0.28242 3 C −2.95161 1.36082 0.27946 3 C −1.64363 1.27771 0.32156 3 C 2.89347 1.41487 −0.08894 4 C −2.17419 0.25674 −0.07294 4 C −1.61466 −0.11126 0.31285 4 C 2.13209 0.26167 0.09999 5 C −2.76908 −1.04552 −0.19791 5 C −2.67468 −0.86334 −0.33487 5 C 2.76788 −1.02485 0.20679 6 C −4.11642 −1.25984 0.09659 6 C −3.79130 −0.21229 −0.86528 6 C 4.14708 −1.16666 0.04808 7 N −0.80905 0.13898 −0.38793 7 N −0.63771 −1.02269 0.75908 7 N 0.74705 0.07388 0.25401 8 N −0.53386 −1.14929 −0.76042 8 N −0.98786 −2.26644 0.40504 8 N 0.49100 −1.24286 0.51341 9 C −1.66978 −1.68210 −0.82654 9 C −1.94424 −2.05562 −0.43095 9 C 1.63735 −1.73463 0.67795 10 C 0.20662 1.18573 −0.55204 10 C 0.65069 −0.75790 1.43566 10 C −0.31392 1.07957 0.37793 11 C 1.58192 0.68067 −0.23541 11 C 1.77197 −0.37289 0.50218 11 C −1.64692 0.54573 −0.06254 12 C 2.58342 0.69335 −1.22257 12 C 2.11596 0.96828 0.32682 12 C −2.71777 0.52563 0.83565 13 C 3.86373 0.24186 −0.93497 13 C 3.14856 1.37996 −0.50186 13 C −3.94527 0.04754 0.39491 14 C 4.13102 −0.22552 0.35496 14 C 3.87217 0.40353 −1.18697 14 C −4.13941 −0.41378 −0.91081 15 C 3.15949 −0.24865 1.36068 15 C 3.55899 −0.95050 −1.03442 15 C −3.06445 −0.38828 −1.79962 16 C 1.88711 0.20847 1.05879 16 C 2.51839 −1.33497 −0.19115 16 C −1.82415 0.09163 −1.38647 17 H −5.89899 −0.29828 0.80000 17 F 1.40251 1.90972 1.00498 17 H 5.95016 −0.09330 −0.39294 18 H −4.91258 1.95891 0.89546 18 H −4.73021 1.69957 −1.10239 18 H 4.88095 2.12752 −0.44562 19 H −2.56413 2.37319 0.24602 19 H −2.85254 2.98470 −0.14660 19 H 2.45990 2.40704 −0.02557 20 H −4.54809 −2.25312 0.04342 20 H −0.77382 1.85266 0.62285 20 H 4.61411 −2.14474 0.08087 21 H −0.09807 1.97403 0.14835 21 H −4.61371 −0.78333 −1.28236 21 H 0.01191 1.90416 −0.26932 22 H 0.14460 1.59821 −1.56440 22 H 0.87369 −1.68720 1.97825 22 H −0.34325 1.45430 1.40636 23 H 3.42138 −0.61139 2.34788 23 H 0.44568 0.04210 2.15185 23 H −5.11846 −0.77430 −1.20620 24 H 1.12224 0.20678 1.82990 24 H 3.37645 2.43598 −0.59169 24 H −3.20123 −0.73557 −2.81791 25 H 2.35687 1.05893 −2.21954 25 H 4.68788 0.70290 −1.83672 25 H −0.99538 0.12485 −2.08706 26 F 5.35659 −0.65821 0.63888 26 H 4.13031 −1.70427 −1.56501 26 F −4.97273 0.02362 1.24667 27 H 4.65286 0.24139 −1.67796 27 H 2.28232 −2.38792 −0.06365 27 H −2.61601 0.86675 1.86025