The Development of a Simple Method for Network-wide Road Surface Roughness Condition Estimation and Monitoring Using
Smartphone Sensors
Viengnam Douangphachanh By
A dissertation submitted in partial fulfillment of the requirements for the Degree of Doctor of Engineering in Civil and Environmental Engineering, with specialization
in Transport Engineering and Infrastructure Planning
Department of Civil and Environmental Engineering Graduate School of Urban Environmental Sciences
Tokyo Metropolitan University
Tokyo, Japan
September, 2014
A DVISORY C OMMITTEE
Supervisor:
Prof. Hiroyuki ONEYAMA
Graduate School of Urban Environmental Sciences Department of Civil and Environmental Engineering Tokyo Metropolitan University, Tokyo, Japan
Co-supervisors:
Associate Prof. Tomoki ISHIKURA
Graduate School of Urban Environmental Sciences Department of Civil and Environmental Engineering Tokyo Metropolitan University, Tokyo, Japan
Associate Prof. Hitoshi NAKAMURA
Graduate School of Urban Environmental Sciences
Department of Civil and Environmental Engineering
Tokyo Metropolitan University, Tokyo, Japan
D EDICATION
To my father and mother, Bounheuang and Oumaly DOUANGPHACHANH, your tireless supports, love and inspiration have helped making this journey possible and rewarding
To my loving and caring wife, Pou, and my two cute daughters, Khaonoom and Nam-oun, you never fail to show me your encouragement and love all along the good and bad moments on this journey
To my brothers, sister (Vanh, Air and Joy) and all the family members, near and
far, who believe in me and are always sending me well wishes
i
A CKNOWLEDGEMENTS
For over the past three years at Tokyo Metropolitan University, I have received substantial supports and encouragement from many individuals, which have helped to fulfill my challenging journey with confidence and success.
First of all I would like to extend my heartfelt gratitude to Professor Hiroyuki ONEYAMA, my supervisor and mentor, for his valuable guidance, excellent and constructive advice as well as significant supports. Without him my research and this dissertation may have not been accomplished.
I would also like to convey my gratitude to Associate Professor Tomoki ISHIKURA and Associate Professor Hitoshi NAKAMURA, my co-supervisors, for all of the insights and suggestions, which have helped to improve the contents of this dissertation.
My gratitude also goes to Professor Takashi OGUJI (The University of Tokyo) for giving me a push and opening a chance for me to start this journey.
My special appreciation also goes to many professors and individuals at TMU, particularly at the Department of Civil and Environmental Engineering for their supports and encouragement.
I would like to also thank Tokyo Metropolitan Government for giving me the financial supports, all the staff at the International Student Support Section at TMU for their assistance and provision of cultural experiences through many interesting seminars.
During my experiments and data collection in Laos, I have received supports from the management of the Public Works and Transport Institute, particularly Mm.
Vilaykham PHOSALATH and Mm. Phonesavanh PHENGSIDA, and all the
assistance from many individuals especially Mr. Chanthavangso OUDOMDETH
and Mr. Khamlune KHATHUMPHOM. My appreciation also goes to Mr. Tadashi
KOMIYA of I-Transport Lab Japan for all the help in the development of the
smartphone app.
ii
I would like to extend my thank you and love to my parents, for all of the love and endless supports; my brothers and sister for their encouragement and helps in many ways. My special thanks also go to my wife, Chongpraseuth Vilaylack, for her always supports, patient, and care; my two lovely daughters for all the laughter and joy. Thanks to all of my extended family members for their praise.
Last but not least, thank you to all friends and colleagues from Japan, Laos and
others, within TMU and outside of TMU for the friendship and encouragement.
iii A BSTRACT
Road infrastructure maintenance planning and monitoring is a very important task. Its main objective is to help properly maintaining the state of the roads so that they remain in good condition, safe, and accessible to users without obstruction. In many countries, the task is often viewed as one of the biggest burdens, mainly due to its extensive need for information, planning, and implementation, which required significant time, man power, technology and importantly budget.
Information especially road condition data is very essential and crucial in the process of road maintenance planning and monitoring. Road surface roughness is regarded as one of the most important road conditions, because it affects vehicle maintenance costs, fuel consumption, comfort, and safety. International Roughness Index (IRI) is an indicator that is widely adopted as a measurement for road surface roughness condition. IRI measurement is normally done either by one or a combination of two main approaches, which include subjective rating or visual inspection, an approach that is labor intensive and very time consuming; and the use of sophisticated profilers, which are highly accurate but costly to obtain, operate and maintain, requires skillful operators as well as cumbersome calibration before deployment. Since the condition of the road infrastructure changes over time, therefore frequent inspections are necessary to identify up to date condition status.
With the current practice it is very challenging for almost all of road authorities and governments, particularly in developing countries where insufficient budget is often an issue.
Whereas, a recent innovation of information technology is very remarkable and
its symbolic instruments are smartphones. Smartphones usually come with so many
kinds of sensors, some of them are very useful for road surface condition estimation
similarly to those used in many high-tech equipment. The number of smartphone
users is rapidly increasing even in developing countries, meaning that chance of
having plenty of up to date data with inexpensive investment is huge. Thus,
iv
smartphones may provide a great contribution in solving the issues regarding the road surface monitoring mentioned above. The objective of this study is to develop a method to estimate road roughness condition using smartphones with the following main original focuses: 1) the method that is simple and easy to implement with certain accuracy that is acceptable for road maintenance planning and monitoring; and 2) the method that is taking advantages of huge data being made available by anonymous road and smartphone users. The study could be a significant contribution in the mentioned field, because it could lead to a practicable measuring tool that could be used to collect data more frequently and regularly, which is very difficult to achieve in the current practice.
This dissertation is structured into 6 chapters as briefly summarized below:
Chapter 1 contains the introduction and background of road maintenance planning and monitoring, the importance of road surface roughness condition information, and the potential of smartphones. The objective, motivation, and the methodology are also introduced in this chapter.
Chapter 2 presents some literature review on road surface roughness condition, the state of the art for measuring IRI, the most relevant previous work on the use of mobile/smartphone sensors to detect/estimate road and traffic conditions.
Chapter 3 describes a study and analysis on the relationship between smartphone
sensor data and the actual IRI. Two experiments, using many smartphones and
vehicles, have been conducted in Vientiane, Laos, to collect data from the
smartphone accelerometers, gyroscopes and GPS. The collected data is analyzed in
the frequency domain using Fast Fourier Transform method to calculate the
magnitude of the vibration. It has been found that IRI can be roughly modeled as a
linear function of the vibration magnitudes and average speed. At high frequency
(frequency range of 40-50Hz), the effect of irrelevant vibration as well as noise,
from the driver or vehicle maneuver and engine for instances, which are not related
to the vibration caused by road surface roughness, appears to be minimal, thus it is
believed that at this high frequency range the effect of the vibration caused by road
v
surface roughness can be observed effectively. The parameters of the relationship function depend on vehicles as well as smartphone locations and settings.
Furthermore, it is also found that consideration of gyroscope as additional explanatory variables brings higher estimation accuracy, in the case that existence of error is observed in the simple model of magnitudes from the accelerometer and the average speed.
Chapter 4 lays out a study on the formulation of a simple model to estimate road roughness condition from numbers of unidentified smartphones, presumably from anonymous drivers. To formulate the model, an objective function is constructed based on the relationship and findings of Chapter 3, and under Least Square Method assumption; subsequently, all unknown parameters of the relationship function for all anonymous drivers and IRIs on all road sections are estimated simultaneously provided that some observed road sections with actual IRI are available. Numerical examples have been carried out, where a road network, consisting of road sections with different road conditions; a number of anonymous road users, passing though the road network on different routes, number of trips as well as magnitudes and average speeds; and simulation scenarios consisting of different observed actual IRI are assumed. In general, the method produces good estimates, which are better in scenarios where diverse classifications of observed actual IRI are available, in contrast to the scenarios where only single classification of actual IRI is assumed. Simulations using real data from the experiments in Vientiane are also conducted, using the same approach in the numerical example.
The results confirm the findings obtained from the numerical examples.
Chapter 5 describes the development of a smartphone app based on the findings
from Chapter 3 and the model described in Chapter 4. The app, called “IRI
Sensing”, can be installed on Android smartphones and is capable of recording
relevant sensor data, performing analysis to calculate the vibration magnitudes and
estimate IRI of road sections. The app also has map viewing, route tracking, data
uploading and some other basic functionality, which will be further enhanced for
vi
better user experience. It is confirmed that the app works satisfactory on some testing road sections. The usability and accuracy are expected to be improved after some extensive tests and piloting.
Chapter 6 is the conclusion. It summarizes the proposed methodology, findings
of the study and the remaining issues for future studies.
vii P UBLICATIONS
Some parts and selected results of this dissertation have been published, presented, and submitted for publications and/or presentations in peer reviewed international and domestic journals as well as conferences. Details of the publication can be viewed in the following list.
Peer Reviewed Journals:
1*. V. Douangphachanh, H. Oneyama. 2012. A Study on the Use of Smartphones for Road Roughness Condition Estimation. Journal of the Eastern Asia Society for Transportation Studies, Vol.10, pp.1551-1564
2*. V. Douangphachanh, H. Oneyama. 2014. A Study on the Use of Smartphones under Realistic Settings to Estimate Road Roughness Condition. EURASIP Journal on Wireless Communications and Networking, 2014:114
3*. V. Douangphachanh, H. Oneyama. 2014. A Model for the Estimation of Road Roughness Condition from Sensor Data Collected by Android Smartphones.
Journal of JSCE, Division D: Infrastructure Planning and Management, Accepted for publication in Vol.70, No.5.
Book:
1*. S. Thammanosouth, V. Douangphachanh, L. Khounphakdy. 2012. Gender analysis of changes in livelihoods at the border: A case study of Houayxai, Lao PDR. Gender, Roads, and Mobility in Asia, Part II. Chapter 9.
Full Paper Peer Reviewed Proceedings
1*. V. Douangphachanh, H. Oneyama. 2013. Estimation of Road Roughness Condition from Smartphones under Realistic Settings Proc. of International Conference on ITS Telecommunication, pp. 433-439
2*. V. Douangphachanh, H. Oneyama. 2014. Formulation of a Simple Model to
Estimate Road Surface Roughness Condition from Android Smartphone
viii
Sensors. Proc. of IEEE Ninth International Conference on Intelligent Sensors, Sensor Networks and Information Processing, pp. 1-6
3*. V. Douangphachanh, H. Oneyama. Exploring the Use of Smartphone Accelerometer and Gyroscope to Study on the Estimation of Road Surface Roughness Condition. 11th International Conference on Informatics in Control, Automation and Robotics, accepted for publication.
International Conferences:
1*. V. Douangphachanh, H. Oneyama. A Study on the Use of Smartphones for Road Roughness Condition Estimation. Proceeding of the Eastern Asia Society for Transportation Studies Conference, Taipei, Taiwan September 9-12, 2013, Vol.9, P297.
2*. V. Douangphachanh, H. Oneyama. Using Smartphones to Estimate Road Pavement Condition. Proceeding of the International Symposium on Next Generation Infrastructure, Wollongong, NSW, Australia, September 30 - October 4, 2013.
3*. V. Douangphachanh, H. Oneyama. Estimation of Road Roughness Condition from Smartphones under Realistic Settings. Proceeding of the International Conference on ITS Telecommunication, Tampere, Finland, November 5-7, 2013.
4*. V. Douangphachanh, H. Oneyama. Formulation of a Simple Model to Estimate Road Surface Roughness Condition from Android Smartphone Sensors.
Proceeding of the IEEE Ninth International Conference on Intelligent Sensors, Sensor Networks and Information Processing, Singapore April 21-24, 2014.
5*. V. Douangphachanh, H. Oneyama. Exploring the Use of Smartphone
Accelerometer and Gyroscope to Study on the Estimation of Road Surface
Roughness Condition. 11th International Conference on Informatics in Control,
Automation and Robotics, Vienna, Austria, September 1-3, 2014.
ix Other Conferences or Oral Presentations:
1*. V. Douangphachanh, H. Oneyama. A Numerical Model to Estimate Road Roughness Condition from Sensor Data Collected by Android. Biannual Conference of the Committee of Infrastructure Planning and Management, Osaka, Japan, November 2-4, 2013
2*. V. Douangphachanh. Road Surface Condition Detection Using Smartphone
Devices. International Seminar on Traffic Management and Data Utilization,
Tokyo, Japan, July 27, 2012.
x
T ABLE OF C ONTENTS
Acknowledgements i
Abstract iii
Publications vii
Table of Contents x
List of Tables xiii
List of Figures xiv
List of Acronyms xviii
C
HAPTER1: I
NTRODUCTION1
1.1. Background and motivation 1
1.2. Objective 6
1.3. Methodology 7
1.4. Outline of this dissertation 9
C
HAPTER2: L
ITERATURE REVIEWS10
2.1. Road Roughness condition and road maintenance planning 10
2.2. International Roughness Index (IRI) 13
2.3. Conventional ways to measure IRI 14
2.3.1. Types of IRI measuring equipment 14
2.3.2. A brief review on the existing IRI measuring equipment 15 2.3.3. Vehicle Intelligent Monitoring System (VIMS) 20
2.4. Relevant smartphone sensors 23
2.5. Related work on using mobile sensors and smartphones to estimate
road condition 25
2.6. Smartphone apps to estimate road condition 27
2.7. Conclusions 29
C
HAPTER3: A
STUDY ON THE RELATIONSHIP OF SMARTPHONE SENSORDATA AND ROAD ROUGHNESS CONDITION
31
xi
3.1. Introduction 31
3.2. Experiments for data collection 32
3.2.1. Approach 32
3.2.2. Equipment and Software 36
3.2.3. Referenced Road Roughness Condition Data 38
3.2.4. Experiment Setting 41
3.2.5. Implementation 43
3.3. Data processing 45
3.4. Analysis results 1: Considering only accelerometer. 48
3.4.1. Fixed orientation smartphones 48
3.4.2. Free orientation smartphones 50
3.4.3. The relationship at different ranges of frequency 54
3.4.4. Effect of speed 60
3.4.5. Classification the magnitudes of vibration 62 3.4.6. IRI as a linear function of the magnitudes and the average
speed 64
3.5. Analysis results 2: Considering data from the accelerometers and the
gyroscopes. 67
3.6. Discussion and conclusions 71
C
HAPTER4: A
STUDY ON THE FORMULATION OF A SIMPLE MODEL TO ESTIMATE ROAD ROUGHNESS CONDITION FROM NUMBERS OFANONYMOUS SMARTPHONES
72
4.1. Introduction 72
4.2. Background and concept of the proposed model 73
4.3. Model Formulation 76
4.4. Numerical Examples 79
4.4.1. Setting 79
4.4.2. Approach 82
4.4.3. Results 83
xii
4.5. Simulation using real life data 86
4.4.1. Setting 86
4.4.2. Result 88
4.4.3. Discussion and conclusions 88
C
HAPTER5: T
HE DEVELOPMENT OF A SMARTPHONE APP90
5.1. Introduction 90
5.2. Concept 91
5.3. Structure and calculation process 92
5.4. User interface of IRI Sensing 95
5.4.1. Setting and configuration 95
5.4.2. Data collecting and estimation 98
5.4.3. Data uploading 99
5.4.4. Visualization 99
5.5. Pilot use 101
5.5.1. Test run 1 101
5.5.2. Test run 2 104
5.6 Conclusions 108
C
HAPTER6: C
ONCLUSION AND RECOMMENDATION FOR FUTURE WORK109
References 112
Appendix A: Costs of road condition survey, Laos 117
Appendix B: Smartphone location for the additional experiment 118
Appendix C: VBA Codes for data processing 119
Appendix D: Summaries of multiple regression analysis 149
Appendix E: Effect of speed 150
Appendix F: Magnitudes option (1) and (2) 155
Appendix G: Consideration of gyroscope sensor 160
Appendix H: R Script for numerical examples 165
Appendix I: R Script for real data simulation 170
xiii L IST OF T ABLES
Table 2-1: IRI measurement methods ... 14
Table 2-2: Cost/performance trade-off matrix ... 16
Table 2-3: Suitability ranking ... 17
Table 3-1: The scope of the main experiment ... 34
Table 3-2: The scope of the additional experiment ... 35
Table 3-3: List of smartphones ... 37
Table 3-4: Sample of AndroSensor data ... 38
Table 3-5: Example of VIMS result ... 41
Table 3-6: Smartphone location for the main experiment ... 43
Table 3-7: 100 meter sections resulted from sectioning, the main experiment ... 46
Table 3-8: Summary of R
2by breakdown frequency ranges ... 59
Table 3-9: Selected summary of multiple regression analysis (40-50Hz) ... 60
Table 3-10: Condition index ... 62
Table 3-11: Summary of estimation results for both functions. ... 69
Table 4-1: Road condition index ... 80
Table 4-2: Route arrangement ... 80
Table 4-3: Vehicle/Device setting combinations ... 86
Table 5-1: Sample of IRI sensing data ... 94
Table 5-2 IRI Sensing results ... 103
xiv
L IST OF F IGURES
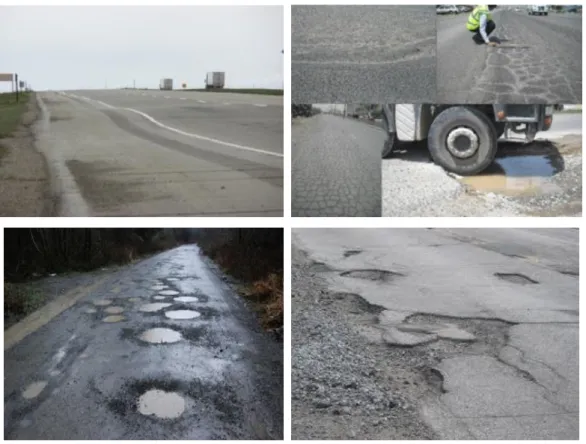
Figure 1-1: Examples of road defects ... 3
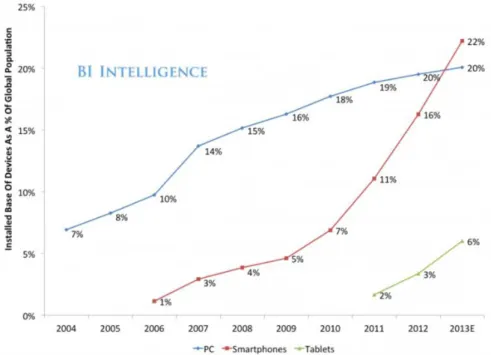
Figure 1-2: Global smartphone penetration per capita ... 4
Figure 1-3: Conceptual framework of the proposed system ... 7
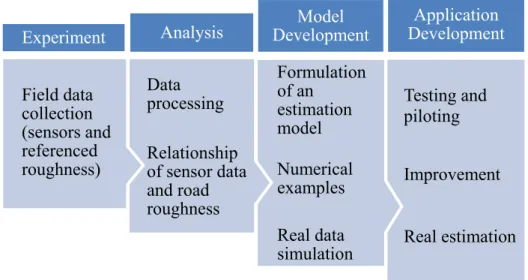
Figure 1-4: Main process of the studies included in this dissetation ... 8
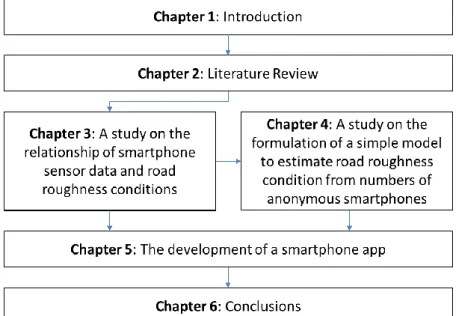
Figure 1-5: Structure of the dissertation ... 9
Figure 2-1: Road roughness condition ... 10
Figure 2-2: Concept of life cycle analysis ... 11
Figure 2-3: Effect of road condition on road user costs ... 12
Figure 2-4: Quarter-car model ... 13
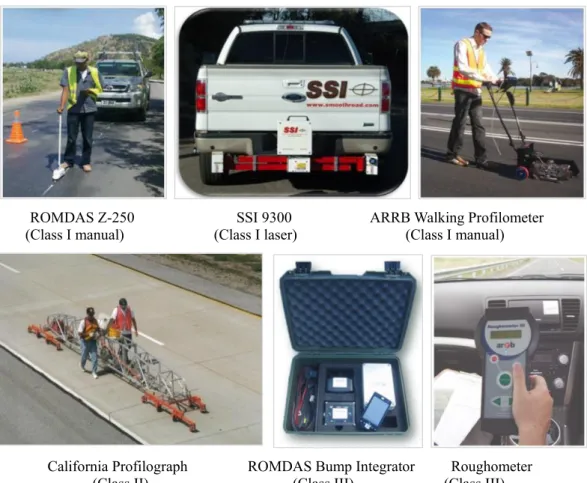
Figure 2-5: Examples of IRI measuring tools ... 15
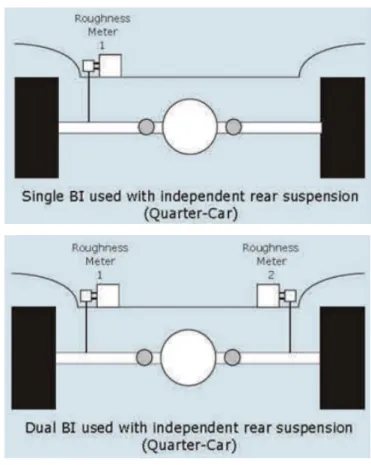
Figure 2-6: ROMDAS Bump Integrator (BI) setup ... 18
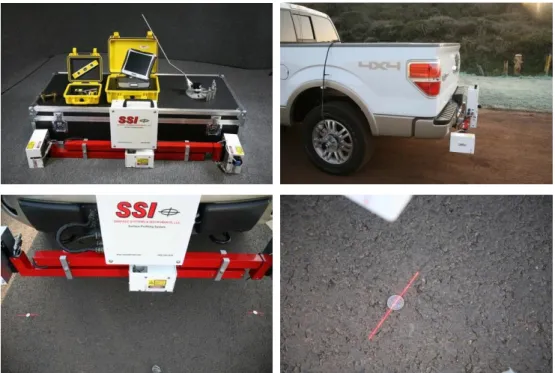
Figure 2-7: Example of a Class I automatic profiler, SSI 9300 ... 20
Figure 2-8: VIMS estimation framework ... 21
Figure 2-9: VIMS hump calibration ... 21
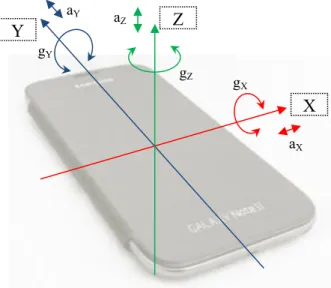
Figure 2-10: Smartphone referencing frame and the sensors’ sensing axes ... 23
Figure 2-11: Samples of sensor data ... 24
Figure 2-12: System architecture and approach of Pothole Patrol ... 26
Figure 2-13: Tai et al (2010) experiment ... 26
Figure 2-14: Screenshots of BumpRecorder ... 27
Figure 2-15: Roadroid ... 28
Figure 3-1: Routes of the main experiment ... 35
Figure 3-2: Routes of the additional experiment ... 35
Figure 3-3: Process for the study of the relationship ... 36
Figure 3-4: Experiments equipment ... 36
xv
Figure 3-5: AndroSensor Screenshots ... 37
Figure 3-6: VIMS approach ... 39
Figure 3-7: VIMS component ... 39
Figure 3-8: VIMS calibration and data collection software ... 40
Figure 3-9: VIMS data analysis software ... 40
Figure 3-10: Experiment setting, the main experiment ... 42
Figure 3-11: Fixed orientation, Vehicle 1 (Device A and Device B) ... 48
Figure 3-12: Fixed orientation, Vehicle 2 (Device A and Device B) ... 49
Figure 3-13: Fixed orientation, Vehicle 3 (Device A and Device B) ... 49
Figure 3-14: Fixed orientation, Vehicle 4 (Device A and Device B) ... 49
Figure 3-15: Free orientation, Vehicle 1 (Dev Cp and Device Db) ... 50
Figure 3-16: Free orientation, Vehicle 1 (Device Dp and Device Cb) ... 51
Figure 3-17: Free orientation, Vehicle 2 (Device C and Device D) ... 51
Figure 3-18: Free orientation, Vehicle 3 (Device C and Device D) ... 51
Figure 3-19: Free orientation, Vehicle 4 (Device C and Device D) ... 52
Figure 3-20: Free oreintation, all vehicles (Pocket) ... 53
Figure 3-21: Free oreintation, all vehicles (Box) ... 53
Figure 3-22: Breakdown frequency a (Vehicle 1, Device A) ... 54
Figure 3-23: Breakdown frequency b (Vehicle 1, Device A) ... 55
Figure 3-24: Breakdown frequency a (Vehicle 2, Device B) ... 55
Figure 3-25: Breakdown frequency b (Vehicle 2, Device B) ... 56
Figure 3-26: Breakdown frequency a (Vehicle 3, Device C) ... 56
Figure 3-27: Breakdown frequency b (Vehicle 3, Device C) ... 57
Figure 3-28: Breakdown frequency a (Vehicle 4, Device D) ... 57
Figure 3-29: Breakdown frequency b (Vehicle 4, Device D) ... 58
Figure 3-30: R
2at different frequency ranges ... 59
Figure 3-31: Actual and predicted IRI, multiple regressions (Device D) ... 61
Figure 3-32: Classification of magnitude by condition index, Vehicle 2 ... 63
xvi
Figure 3-33: Classification of magnitude by condition index, Vehicle 3 ... 63
Figure 3-34: R
2from different consideration of magnitudes, Vehicle 4 ... 65
Figure 3-35: Comparison of estimation result, Vehicle 4 ... 68
Figure 3-36: R
2from the functions with and without gyroscope ... 70
Figure 4-1: Characteristics of the approach ... 74
Figure 4-2: Estimation process ... 78
Figure 4-3: Structure of the numerical examples ... 79
Figure 4-4: Road network ... 80
Figure 4-5: Map of route arrangement ... 80
Figure 4-6: Vehicle settings ... 81
Figure 4-7: Simulation processes ... 82
Figure 4-8: Real and estimated IRI (Scenario 1) ... 83
Figure 4-9: Real and estimated IRI (Scenario 2) ... 83
Figure 4-10: Real and estimated IRI (Scenario 3) ... 84
Figure 4-11: Real and estimated IRI (Scenario 4) ... 84
Figure 4-12: Real and estimated IRI (Scenario 5) ... 85
Figure 4-13: Selected road sections ... 87
Figure 4-14: Observed and estimate IRI, Real Data Example ... 88
Figure 5-1: IRI Sensing structure ... 92
Figure 5-2: Processing flowchart of IRI Sensing ... 93
Figure 5-3: IRI Sensing icon and main screen ... 95
Figure 5-4: IRI Sensing Configuration menu 1 ... 96
Figure 5-5: IRI Sensing Configuration menu 2 ... 96
Figure 5-6: IRI Sensing Configuration menu 3 ... 97
Figure 5-7: Data collection screens ... 98
Figure 5-8: Data uploading ... 99
xvii
Figure 5-9: Map viewing and route tracking ... 100
Figure 5-10: Route of test run 1 ... 101
Figure 5-11: Location of the smartphone for IRI Sensing test run ... 102
Figure 5-12: Nine sections estimated by IRI Sensing ... 102
Figure 5-13: Route of test run 2 ... 104
Figure 5-14: IRI Sensing results for the good condition section ... 105
Figure 5-15: Results for the mixed condition (poor and bad) section 1 ... 105
Figure 5-16: Results for the mixed condition (poor and bad) section 2 ... 106
Figure 5-17: Results for the bad condition section 1 ... 106
Figure 5-18: Results for the bad condition section 2 ... 107
xviii
L IST OF A CRONYMS API Application Programming Interface
APK Android Application Package File (File format) ARRB Australia Road Research Board
ASTM American Society for Testing Materials BI Bump Integrator
DFT Discrete Fourier Transform FFT Fast Fourier Transform GDP Gross Domestic Product
GPS Geographical Positioning System
GSM Global System for Mobile Communications HDM Highway Development and Management IRI International Roughness Index
IRRE International Road Roughness Experiment LAK Lao Kips (Lao Currency)
NAASRA National Association of Australian State Roading Authority PTI Public Works and Transport Institute
RMS Road Management System
ROMDAS Road Measurement Data Acquisition System
RTRRMS Response Type Road Roughness Measuring System USD U.S. Dollars (U.S. currency)
VIMS Vehicular Intelligent Monitoring System VOC Vehicle Operating Cost
2WD 2 Wheel Drive
4WD 4 Wheel Drive
1
Chapter 1: I NTRODUCTION
1.1. Background and motivation
Road infrastructure maintenance planning and monitoring is one of the most important tasks for all road authorities and governments around the world. The task is a critical element in the actual implementation of road infrastructure maintenance, which has the principal objective of preserving the status of the roads so that they remain in good condition, safe, and accessible to road users without obstructions.
Being properly maintained, the roads can continuously serve its main objective in supporting the mobility of people, goods and the economy of a country. “Proper road maintenance contributes to reliable transport at reduced cost, as there is a direct link between road condition and vehicle operating costs (VOC). An improperly maintained road can also represent an increased safety hazard to the user, leading to more accidents, with their associated human and property costs”
(World Bank, 2014).
Road maintenance planning, monitoring and management is usually viewed as one of the biggest challenges for many governments, mainly due to its extensive need for information, planning, and implementation. All of these require significant time, man power and importantly substantial budget. Information or data is very important, and road roughness condition is a vital data in the process of road maintenance, monitoring planning and management. Regular road infrastructure inspections are necessary to identify up to date condition status, since the condition data changes over time. Therefore, it is very challenging for all most all of the road authorities and governments, particularly in developing countries where insufficient budget is often an issue.
In Laos, for instance, which is a small developing country in Southeast Asia,
with a total land area of 236,800 km
2, a population of 6,770 million and a GDP of
USD11.14 billion (2013; according to World Bank); there is a total road length of
30,585 km; of which 4,885 km are paved, 13,336 km are gravel, and 12,364 km are
2
earth roads, respectively (PTI, 2011a). According to the 2011 annual report of Lao Road Management System (RMS), in order to properly maintain this huge road network, the government has to spend approximately USD162.5 million (13 trillion LAK) per year. In practical, because of budget constraint, only approximately less than 30% of the total road length can be maintained. RMS is a system that helps the government in the planning and prioritizing for the maintaining and managing of the road infrastructure accordingly to the available budget. It comprises of a set of software, procedures and data base. RMS requires extensive data, particularly road condition data (including roughness), which is among the most important data needed for RMS analysis. The collection of road condition and roughness data in Laos, in 2011, costs USD16 per Km for paved roads and USD5 per Km for unpaved roads (PTI, 2009). See Appendix A.
Road pavement condition can be classified by the irregularity and/or defects, which may be in the form of surface unevenness, potholes, cracks, deterioration or damages and so forth, in the pavement surface that adversely affects the ride quality of vehicles (See Figure 1-1 for examples of different road pavement conditions).
Road roughness is an internationally accepted indicator to which it is usually used to measure the condition of road pavement. Roughness is an important pavement characteristic because it affects not only ride quality but also vehicle delay costs, fuel consumption and maintenance costs. International Roughness Index (IRI) is a measurement indicator that has been used internationally for road pavement condition (M.W. Sayers et al., 1986). IRI is the condition index obtained from the measurement of longitudinal road profiles with the measuring unit of slope (m/km, mm/m for instance).
Bad pavement condition can cause damages to vehicles, may increase fuel consumption, increase road user costs for vehicle maintenance, unpleasant driving experience, and sometimes it may pose traffic safety threats to road users.
Therefore, pavement condition information is usually of the interests of the general
public, road users and particularly the government or road authorities. For the
3
authorities, the information is crucial in their decision making process especially for strategic planning such as management planning, maintenance planning and programming of the road infrastructure. The lack of sufficient availability of funding, technology and skillful manpower often leads to infrequent collection of road roughness condition data, thus the data is usually left outdated. Consequently, sound management and maintenance of the road infrastructure have often been compromised, which is usually viewed as a great challenge for many road authorities in maintaining good quality of road infrastructure under budget constraint, particularly in developing countries.
Figure 1-1: Examples of road defects Source: the internet
To obtaining road roughness condition data, there are 2 main approaches. The
first approach is subjective rating surveys and the second approach involves the use
of sophisticated profilers. The former approach is labor intensive and very time
4
consuming, because it relies mainly on visual inspection and judgment of trained inspectors. The later approach relies on the use of one or many types of sophisticated road profilers, which are costly to obtain, operate and maintain.
Skillful operators are also recommended. Additionally, in order to properly use such profilers, majority of them would require cumbersome physical calibration before deployment.
For developing countries, mainly due to budget constraint, time consuming and intensive human intervention approach is usually an unavoidable option for road surface condition data collection. However, with the need to update the information regularly, this may put further pressure on already heavy-loaded road authorities in terms of budget for actual maintenance, particularly. Therefore, exploring the use of smartphones to estimate road surface condition may be a great help, since smartphones nowadays are increasingly popular; and they usually come with many useful sensors in which many researchers and developers have been exploring their use for many applications in many fields.
Figure 1-2: Global smartphone penetration per capita
Source: BII estimates, Garner, IDC, Strategy Analytics, company fillings, World Bank 2013
cited in (Heggestuen, 2013)
5
According to an online statistics (Heggestuen, 2013) from a well-known business and technology news website (the Business Insider), global smartphones penetration per capita increases sharply and continuously in since 2010 (See Figure 1-2).
It is believed that smartphones may be also potentially useful for the purpose of road infrastructure maintenance planning because, on the one hand, smartphones already have sensors that are capable of recording useful signal for road surface condition estimation similarly to those used in many high-tech equipment. On the other hand, the number of smartphone users is rapidly increasing, meaning that chance of having plenty of up to date data with inexpensive investment is huge.
Furthermore, it may also be useful for continuous monitoring the soundness of road
infrastructure as a whole. For this purpose, it may be beneficial not only for
developing but also for developed countries.
6 1.2. Objective
The main objective of this dissertation is to study on the development of a method to estimate road roughness condition using smartphone devices. It is one of many interesting topics in recent researches and studies in road maintenance planning and monitoring as well as mobile/sensor data sensing and processing areas. The approach considered in this study is unique in comparison to previous studies and researches. The main advantage of the approach proposed in this dissertation is surrounded on the classification of roughness condition of road sections, using simple techniques, which involve frequency domain analysis and a simple linear estimation model. The method is innovative, in the above mentioned field, in the sense that it is low-cost, simple, and taking advantages from huge data being made available by anonymous users. The method is simple because there will be no fixed location and setting of the smartphones, no time consuming and troublesome physical calibrations, and only real roughness condition data of a small number of road sections would be needed to be used in the estimation process to predict the condition of the remaining road sections in the network.
The approach could be a significant contribution because it could lead to a practicable measuring tool that could be used to collect data more frequently and regularly, which is considerably difficult to achieve in the current practice.
Therefore with up to date data being made available for Road Management System,
road maintenance planning and monitoring, in particular, are believed to be more
efficient and carried out in a timely manner.
7 1.3. Methodology
The basic concept of the proposed approach involves anonymous road users (car owners), who presumably agree to download and install an application onto their smartphones, and enable it to collect data from the relevant sensors, analyze, calculate and estimate, and send back the information for further analysis, which then will be used for the purpose of road maintenance planning and monitoring. See Figure 1-3.
Figure 1-3: Conceptual framework of the proposed system
To realize this goal, the smartphone application must be proposed and put in place (details in Chapter 5), and it must have a considerably good estimation model, so that the accuracy of the estimation is acceptable for the use in road maintenance planning and monitoring.
To achieve this, first of all, there is a need to study on the relationship between smartphone sensor data and the actual road surface roughness condition (details in Chapter 3). The study would enable the understanding on features, parameters and relationship functions, which are very critical for the formulation of the estimation model.
After obtaining prospective functions for the estimation model, the model will
Download Application
Application Analysis
Data Acquisition
Road Condition
Estimation Road Management System (RMS)
GPS Data
Acceleration Data Surface Condition Traffic Condition
- Road Maintenance Programming and Planning
- Traffic Monitoring Upload Data
8
be formulated, investigated and tested to ensure that it works for the purpose. The most important point in the model formulation is that the model must be able to estimate road surface roughness condition from anonymous drivers (detail in Chapter 4). The process of the studies carried out in this dissertation can be summarized in Figure 1-4 below.
Figure 1-4: Main process of the studies included in this dissetation
Testing and piloting Improvement Real estimation
Application Development Formulation
of an estimation model Numerical examples Real data simulation
Model Development Data
processing Relationship of sensor data and road roughness
Analysis Field data
collection
(sensors and
referenced
roughness)
Experiment
9 1.4. Outline of this dissertation
This dissertation is structured into 6 chapters. Chapter 1 introduces background of road maintenance planning and monitoring, the importance of road surface roughness condition information, and the potential of smartphones. The objective, motivation, and the methodology are also introduced in the chapter. Chapter 2 reviews some relevant aspect, previous literature and most relevant work to this dissertation. Chapter 3 presents the study on the relationship and feature between smartphone sensor data and the actual road surface roughness condition. This chapter also describes the data collection experiments and a referenced data measurement tool. Chapter 4 presents the model formulation, numerical example and simulation using real life data. Chapter 5 proposes a smartphone application to be used for the estimation of road surface roughness condition. Finally, Chapter 6 is the conclusion.
Figure 1-5: Structure of the dissertation
10
Chapter 2: L ITERATURE REVIEWS
2.1. Road Roughness condition and road maintenance planning
Road roughness is defined as “the deviations of a pavement surface from a true planar surface with characteristic dimensions that affect vehicle dynamics, ride quality, dynamic loads, and drainage, for example, longitudinal profile, transverse profile, and cross slope.” ASTM E867-87 cited in (Bennett et al., 2007).
Figure 2-1 below shows different levels of roughness condition.
Figure 2-1: Road roughness condition Source: (Sayers & Karamihas, 1998)
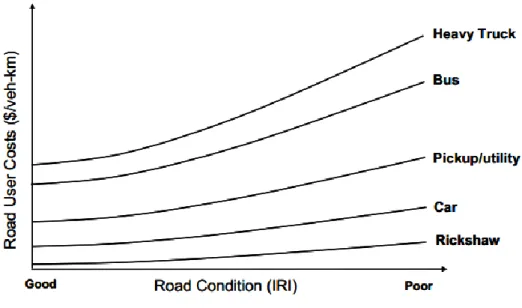
It is widely recognized that road condition has a direct impact on the economic benefits to the road users (Morrow, 2006) and (World Bank, 2005). It is one of the factors that affect and cause increased vehicle operating costs, mainly due to vehicles wear and tear and increased fuel consumption. Roughness also causes unpleasant driving experience, affects travel time and sometimes accidents.
Therefore, roughness is a globally accepted indicator to monitor the performance of road pavement. It is a key performance indicator that is used in the management and planning of road asset maintenance and monitoring.
Roughness can be measured using different methods and in many different units
ranging from counting the number roughness per distance traveled (count/km etc.),
the slope of longitudinal road profile (mm/m, m/km etc.), and ride number (Morrow,
11
2006). Before the adoption of IRI, results of roughness condition measured by different instruments are also different and thus difficult to compare.
Lao RMS uses Highway Development and Management (HDM) based models in its analysis. HDM (latest version is HDM-4) is developed by the World Bank to be used for technical and economic appraisal of road projects, to prepare road investment programs, and to make road network strategy analysis (Kerali et al., 2006). Similar to HDM-4, RMS analytical framework is also based on the concept of pavement life cycle analysis. RMS analyzes different options of maintenance by comparing the total costs to determine economic benefits before prioritizing the maintenance accordingly. The total costs considered include: 1) costs to the road authorities: capital and maintenance costs, which depend on the standard of maintenance selected for the road network (Figure 2-1); and 2) road user costs:
vehicle operating costs (fuel, tires, oil, spare parts, etc.), costs of travel time, economic costs from accidents, and social-environmental costs (emission, traffic noise, etc.)
Figure 2-2: Concept of life cycle analysis Source: (Kerali et al., 2006)
As already mentioned, road user costs are affected directly by road roughness
condition. The effects of the road roughness condition on the vehicle operating
12 costs are shown in the Figure 2-3 below.
Figure 2-3: Effect of road condition on road user costs
Source: (Kerali et al., 2006)
13 2.2. International Roughness Index (IRI)
To standardize the measurement of road pavement roughness across different available methods and profilers, in 1982, the World Bank has funded a large scale International Road Roughness Experiment (IRRE) in Brazil (M.W. Sayers et al., 1986). IRRE uses a quarter-car mathematical model to calculate IRI, which is the quotient of the linear accumulated motion of the suspension divided by the length of the longitudinal road profile (Figure 2-4). Thus, IRI has a measurement unit of slope, such as mm/m, m/km or in/mi, for instances.
The IRRE concludes that factors that are affecting IRI are:
o Measurement vehicle, which can be minimized by calibration;
o Speed, which can also be minimized by calibration; and o Pavement type
Figure 2-4: Quarter-car model Source: (Sayers & Karamihas, 1998)
As a result of this experiment, a standardized measurement indicator (IRI) is adopted. IRI enables the measurement of pavement roughness from different types of tools in different countries to be comparable, reproducible and consistent over time (Sayers & Karamihas, 1998).
Body Mass Suspension Spring & Damper Axle Mass Tire Spring
Measured IRI
Profile
14 2.3. Conventional ways to measure IRI 2.3.1. Types of IRI measuring equipment
The World Bank has classified the measurement techniques of road roughness (IRI) into 4 classes according to their ability to measure precision accuracy (Sayers &
Karamihas, 1998). Class I to III involve the use different types of profilers and class IV is the subjective rating. See Table 2-1.
Table 2-1: IRI measurement methods
Source: (Morrow, 2006; Sayers et al., 1986)
Figure 2-5 below shows some popular IRI measuring tools.
Class Description Example of the equipment
Class I: Precision Profilers
This class of IRI measurement is the most precise and accurate. The measurement (sample) interval is 250mm or less with a precision of no greater than 0.5mm on very smooth road surface. The tools can be laser profilers, which normally are non-contact lightweight and portable devices, as well as manually operated devices.
Face Technology dipstick, ROMDAS Z-250, ARRB walking profilometer
Class II: Other Profilometer Methods
Other devices that do not meet Class I requirement, but still considered as precise and accurate. The maximum sampling intervals of this class are 500mm, with a precision of less than 1mm on smooth roads.
APL Profilometer, California and Rainhart profilographs, optical profilers, and inertial profilers
Class III: Simple profilers or response type tools
This class of instruments machanically or digitally measure the response of the instruments relatively to the road profile. Some other simple profilers are also classified under this class.
Roadmaster, ROMDAS,
Roughometer, TRL Bump Integrator, Rolling straight edge, VIMS
Class IV: Subjective rating
Measurement that is judged by inspectors from visual surveys or the use of uncalibrated roughness meters
Key code rating system, visual inspection, ride over section