Wage Differentials between Foreign
Multinationals and Local Plants and Worker Education in Indonesian Manufacturing
著者(英) Eric D. Ramstetter, Dionisius Narjoko journal or
publication title
AGI Working Paper Series
volume 2013‑23
page range 1‑66
year 2013‑12
URL http://id.nii.ac.jp/1270/00000096/
Creative Commons : 表示 ‑ 非営利 ‑ 改変禁止 http://creativecommons.org/licenses/by‑nc‑nd/3.0/deed.ja
Wage Differentials between Foreign Multinationals and Local Plants and Worker Education
in Indonesian Manufacturing
Eric D. Ramstetter
ICSEAD and Graduate School of Economics, Kyushu University and
Dionisius Narjoko
Economic Research Institute for ASEAN and East Asia Working Paper Series Vol. 2013-23
December 2013
The views expressed in this publication are those of the author(s) and do not necessarily reflect those of the Institute.
No part of this book may be used reproduced in any manner whatsoever without written permission except in the case of brief quotations embodied in articles and reviews. For information, please write to the Centre.
The International Centre for the Study of East Asian Development, Kitakyushu
1
Wage Differentials between Foreign Multinationals and Local Plants and Worker Education in Indonesian Manufacturing
Eric D. Ramstetter
International Centre for the Study of East Asian Development and Graduate School of Economics, Kyushu University
[email protected] and
Dionisius Narjoko
Economic Research Institute for ASEAN and East Asia December 2013
Abstract
This paper reexamines the extent of wage differentials between medium-large (20 or more workers) foreign multinational enterprises (MNEs) and local, private plants in Indonesia’s manufacturing industries in 1996 and compares them to corresponding differentials in 2006.
Mean, unconditional differentials were quite large when the 17 industries sample industries are combined, and declined from 144 to 69 percent for production workers and from 201 to 84 percent for non-production workers. Conditional differentials that account for the tendency of MNEs to hire relatively educated workers, use relatively large amounts of energy and material inputs per worker, and be relatively large, were positive and statistically significant, but much smaller, falling from 26 to 3.5 percent for production workers and from 34 to 15 percent for non-production workers. Industry-level, conditional differentials were also positive in 10-11 industries in 1996, but tended to decline and most became insignificant by 2006. Both aggregate and industry-level results also suggest that differentials were relatively large for non-production workers, but the industry-level results were again relatively weak for 2006.
Finally, the size of MNE-private differentials did not depend significantly on the extent of foreign ownership in most of the samples examined.
Keywords: Multinational corporations, Southeast Asia, manufacturing, wage determination JEL categories: F23, J31, L60, O53
Acknowledgement: This paper is one output of the research project “Multinationals, Wages,
and Human Resources in Asia’s Large Developing Economies”, which was funded by the
International Centre for the Study of East Asian Development (ICSEAD) in fiscal 2013
(ending March 2014). We thank ICSEAD and Economic Research Institute for ASEAN and
East Asia for financial and logistic assistance. Valuable comments were also received from
participants in a seminar at the Asian Development Bank Institute in Tokyo on 25 October
2013. Responsibility for all opinions expressed and any remaining errors or omissions is the
author’s alone.
2 1. Introduction
Lipsey and Sjöholm’s (2004a) study of manufacturing plants in Indonesia in 1996 is one of the most sophisticated studies of wage differentials between foreign multinational enterprises (MNEs) and local plants, and the relationship of the differentials to labor quality, for host, developing economies.
1They estimate Mincer-type equations at the plant level for white- and blue-collar workers and account for the influence of worker educational background, the share of female workers, as well as other as energy per worker, material inputs per worker, and size in sample plants. They found that that MNEs paid significantly higher wages than local plants even after accounting for the educational background of the plant’s work force and these other plant-level characteristics, and that these conditional wage differentials were larger for white- collar workers than for blue-collar workers (22 versus 12 percent).
This paper’s first contribution is to update this analysis to 2006, the next year for which similarly detailed data are available. This update is potentially important because Indonesia went through a wrenching economic crisis beginning in late 1997, with per capita GDP only recovering to 1996 levels in 2004 if measured in constant rupiah or current U.S. dollars, for example (World Bank 2014). The manufacturing sector also experienced a marked increase in the share of activity accounted for by MNEs, particularly heavily-foreign MNEs with foreign ownership shares of 90 percent or more. Increased MNE shares were a direct result of the crisis in many cases, partially because precipitous declines in Indonesian asset prices and the value of the rupiah created a fire sale, which MNEs were better able to take advantage of than local capitalists, many of whom faced severe financial constraints or bankruptcy. Accelerated implementation of policy reforms instituted in the mid-1990s made it easier for MNEs to own large shares in Indonesian manufacturing plants. Privatization of state-owned enterprises (SOEs) and the transfer of SOE ownership from the central government to provincial
1
These authors also examined other aspects of wage differentials and how they change over
time in Lipsey and Sjöholm (2004b, 2005, 2006) and Sjöholm and Lipsey (2006).
3
authorities also changed important aspects of competition in some manufacturing industries.
Correspondingly, the economic and policy environment was substantially different in 2006 than in 1996 for both MNEs and local manufacturing plants. It is thus of interest to examine how MNE-local wage differentials changed during this decade.
Lipsey and Sjöholm (2004a) estimated equations for all manufacturing plants combined.
They allowed intercepts to differ among industries, but assumed that the slope coefficients in their equations, including the conditional MNE-local wage differential (the coefficient on a dummy variable identifying MNEs), were uniform across industries. However, studies of MNE-local wage differentials in Malaysia (Ramstetter 2012a, 2013), Thailand (Movshuk and Matsuoka-Movshuk 2006; Ramstetter 2004), and Vietnam (Ramstetter and Phan 2007) provide strong evidence than many slope coefficients, including the MNE-local wage differential, also differ among industries. Studies of productivity also indicate that MNE-local differentials and other slope coefficients in the production function also differ among industries in Indonesia (Takii 2004; Takii and Ramstetter 2005), Thailand (Ramstetter 2004), and Vietnam (Ramstetter and Phan 2013). The second contribution of this study is thus to relax the assumption of slope coefficient uniformity among industries by estimating equations for 17 manufacturing industries separately, as well as for all plants combined. As might be expected, relaxing the assumption of slope coefficient uniformity reveals that MNE-local wage differentials were small or insignificant in several industries but large and significant in others.
The third contribution is to test whether MNE-local wage differentials differ among types
of MNEs, that is if they differ for heavily-foreign MNEs, majority-foreign MNEs (foreign
shares of 50-89 percent), and minority-foreign MNEs (foreign shares of 33-49 percent). The
primary reason for this investigation is that MNE parents are often thought to be less reluctant
to share their firm-specific assets related to production technology and marketing, for example,
4
with affiliates they do not control tightly. As a result some observers (e.g., Moran 2001) expect affiliates that are tightly controlled to be more closely integrated with the MNE’s network and more efficient as a result. In some contrast, previous results for Indonesia suggest that heavily- or majority-foreign plants are actually less productive than minority- foreign plants in several industries, but that they tend to export relatively large portions of their output (Takii 2004; Takii and Ramstetter 2005; Ramstetter and Takii 2006).
The paper briefly reviews the existing literature in Section 2, and describes the data used and patterns revealed by key descriptive statistics, including unconditional MNE-private (local) differentials in wages and worker education, in Section 3. Section 4 then reviews the evidence emerging from estimates of earnings equations, focusing on patterns of conditional MNE-private wage differentials. Finally, Section 5 concludes and offers suggestions for further research.
2. Literature Review and Methodology
As described in the introduction, Lipsey and Sjöholm (2004a) studied large samples of plants in 1996, finding that MNEs paid higher wages than local plants and that statistically significant wage differentials persisted after accounting for the educational background of the plant’s work force as well as plant size, material inputs per employee, energy per employee, and the female share of a plant’s work force. Recent studies of Malaysian manufacturing plants in 2000-2004 by Ramstetter (2012a, 2013) also accounted for worker occupation, in addition to educational background, female shares, as well as plant size and capital intensity, again finding that significant MNE-local differentials remained in samples of all plants and in most of the industry-level samples examined.
2Ramstetter and Phan (2007) also found
2
The use of material inputs per worker and/or energy per worker is a common proxy for
capital intensity in analyses of Indonesian manufacturing plants because the coverage of the
5
positive wage differentials between MNEs and local, private firms in Vietnam in 2000, 2002, and 2004, after accounting for firm’s size, factor intensity, shares of technical workers, and female shares, both in the aggregate and in most industry group samples. In contrast, results from Lee and Nagaraj’s (1995) sample of workers in the Klang Valley of Malaysia in 1991 suggest that foreign ownership of a plant had no significant effects on wages of either male or female workers, after several aspects of labor quality (education, experience, occupation, training) and numerous other worker- and plant-level variables were accounted for.
3Other studies of Malaysia (Lim 1977), Thailand (Movshuk and Matsuoka-Movshuk 2006, Ramstetter 2004), and Venezuela and Mexico (Aitken et al 1996) have found that MNE-local wage differentials tended to persist after accounting for similar plant- or firm-level characteristics, but were unable to account for the influences of labor force quality. There are also numerous studies of individuals that reveal significant returns to human capital, when measured by worker education, training, and experience, for example.
4Still other studies focus on the gender wage gap, usually finding that females earn less than males, even after accounting for education, experience, and other determinants of earnings.
5There is thus substantial previous evidence that both plant ownership and worker quality have important influences on worker earnings. It is clear that relatively well educated, experienced, and well-trained workers generally expect relatively high returns to their work efforts. Firms or plants hiring high-quality workers usually expect relatively high productivity capital data is often poor. For example, Ramstetter and Narjoko (2012) report that 28-33 percent of sample plants in 12 large energy consuming industries (accounting for 75 percent of total employment and 80-82 percent of output) did not have data on fixed assets in 1996 and 43-48 percent lacked these data for 2006.
3
These variables were union membership, marital status, migration status, total hours worked, plant size, and plant export-orientation.
4
See Purnastuti, et al (2013) and Sohn (2013) for recent evidence on Indonesia.
5
In addition to the study of plant-level data from Lipsey and Sjöholm (2004a), studies of
individuals also provide evidence of a substantial gender pay gap in Indonesia
(Feridhanusetyawan et al. 2001; Pirmana 2006).
6
and offer commensurate compensation. Correspondingly, the primary reason that MNEs pay higher wages than local plants is probably the well documented tendency for MNEs to be relatively technology- or skill-intensive compared to non-MNEs (Caves 2007; Dunning 1993;
Markusen 2002). However, even relatively sophisticated studies like Lipsey and Sjöholm (2004a) fail to fully account for MNE-local differences in labor quality. For example, in addition to differences in worker education, there may be important differences in worker occupation, training, background, and experience, which are often accounted for in studies of wage determination among individuals, but are not measured in plant-level data. In this study of Indonesia, for example, it is possible to account for differences in worker education and sex, but the available data do not contain information on worker background (e.g., race, nationality), occupation, experience, or training.
Other reasons for MNE-local differentials are perhaps less clear, but there are at least three important possibilities. First, there is substantial evidence that MNEs often find it difficult to identify and retain suitably qualified workers. For example, in 1998, securing adequate quantity and quality of labor was the third most common of 27 possible problems for Japanese affiliates operating in the ASEAN-4 (the four largest developing economies in the Association of Southeast Asian Nations: Indonesia, Malaysia, the Philippines, and Thailand), this problem being cited by 8.5 percent of these MNEs (Japan, Ministry of Economy, Trade and Investment 2001, pp. 536-537).
6Other surveys also indicated that securing labor supply was the third most frequently cited of 14 investment motives of Japanese affiliates in Indonesia, being cited by 16 percent of replying firms in 1996 and 13 percent in 2006 (Toyo Keizai, various years).
7Correspondingly, many of the aforementioned studies suggest that
6
The most commonly cited problems were (1) competition for local product markets (11.2 percent and (2) political instability (8.6 percent).
7
The most commonly cited motives were (1) development of local markets (25 percent of
replying affiliates in 1996 and 24 percent in 2006) and (2) strengthening of international
competitiveness (19 percent in 1996 and 34 percent in 2006).
7
MNEs may pay relatively high wages to secure or retain labor in economies like Indonesia.
Second, workers in host economies are often relatively familiar with management practices in local firms and may therefore be relatively reluctant to work for MNEs that often use less familiar management styles. This may lead them to demand a premium for working in the relatively unfamiliar MNE environment. There is relatively little empirical evidence on this point, though many of the studies reviewed above mention it, but there have been well- documented cases where prominent MNEs from Japan (Guerin 2002) and Korea (Hwan 2011), for example, have been accused of labor rights violations in Indonesia. This creates the impression that related bad press may have made some Indonesian workers reluctant to work for MNEs.
Third, MNEs are often hypothesized to have important firm-specific assets in relatively large amounts compared to non-MNEs.
8These firm-specific assets are generally intangible, and many of them are related worker quality. However, even when an MNE’s intangible assets are not directly related to worker skills, they may facilitate higher worker productivity by improving a firm’s marketing and management, for example. In other words, the MNE’s possession of firm-specific assets has the potential to make workers more productive in MNEs than in non-MNEs, even if labor quality is identical in MNEs and non-MNEs. In such cases, MNEs may find it profitable to pay relatively high wages to compensate for their relatively high productivity, especially when the ability to utilize firm-specific assets is related to workers’ firm-specific experience or motivation, for example.
Partially reflecting differences in firm-specific assets, MNE-local wage differentials are
8
Some theorists (especially Dunning) view the possession of firm-specific assets or ownership advantages as a key necessary condition for a firm to become an MNE (in addition to internalization and location advantages). Other theorists (Buckley and Casson 1992;
Casson 1987; Rugman 1980, 1985) dispute this view, choosing instead to emphasize the role
of internalization as the key distinguishing characteristic between MNEs compared to non-
MNEs. However, the important point is that all agree that MNCs tend to possess these kinds
of firm-specific assets in relatively large amounts.
8
thought to result from differences in other plant-level characteristics that might affect labor productivity and/or wages. For example, much of the literature reviewed above suggests that firms or plants which are relatively large or capital- (or input-) intensive often pay relatively high wages and have relatively high labor productivity. In addition, location and industry affiliation are found to have important influences on the wage levels in firms or plants. Thus, this paper will follow the Lipsey and Sjöholm (2004a) and estimate earnings equations that account for the influences of worker quality and sex, plant size, material inputs and energy per worker, location, and industry affiliation, as well as ownership (MNE vs. local owners). The industry dimension will also be carefully considered by the use of industry dummies in samples of all plants in 17 industries combined and by estimating separate equations for each industry (thereby allowing both intercepts and slopes to vary across industries).
3. Data, Unconditional Wage Differentials, and Differences in Worker Education
Plant-level data underlying the industrial censuses of medium-large plants (those with 20 or more employees) for 1996 and 2006 are used in the analysis because they are comprehensive and contain detail on worker educational background which is excluded from annual surveys.
Because a number of plants are jointly owned by MNEs, SOEs, and/or private firms, joint
ventures with foreign shares of 33% or more are classified as MNEs and non-MNE joint
ventures with state shares of 33% or more are classified as SOEs. This cutoff is somewhat
higher than the standard one for defining MNEs (foreign shares of 10% or more), but we
know of no similar standard for defining SOEs and need to avoid ambiguity. As noted in
Table 1, plants with fewer than 20 paid workers and low values of output per worker or value
added per worker (suggesting large, negative profits and/or wage levels well below the
9
minimum wage) were dropped from the samples.
9The exclusion of these plants removes most outliers and simplifies the interpretation of MNE-local differentials because MNEs were generally large, whereas excluded plants were predominately small, local, private plants.
10The left column of Table 1 shows the number of paid workers in sample plants for total manufacturing, the 17 sample industries that this paper focuses on, and five excluded industries.
11We exclude four industries (tobacco, leather, printing and publishing, oil and coal) because they had fewer than 10 MNEs in one or both years and another industry (miscellaneous manufacturing) because it is relatively small and heterogeneously defined. In order to insure sufficient sample size and to include competing plants in the same industry, industries are generally defined at the 2-digit level of revision 3 of Indonesia’s Standard Industrial Classification (ISIC), but four industries are 3-digit categories (footwear, rubber, plastics, furniture) and one is combination of four related 2-digit categories (electronics- related machinery). However, industry definitions for 1996 are based on revision 2 of ISIC and sometimes differ substantially from 2006 definitions. Thus, caution is necessary when interpreting trends over time at the industry level.
129
The value added per worker cutoff was 7.9 percent of the estimated national average (including small plants; Asian Development Bank 2013) but only 4.5 percent of the published average for all medium-large plants (BPS-Statistics various years) in 1996. In 2006 these ratios were 6.5 percent and 4.5 percent, respectively, but excluded plants accounted for a larger share of the overall total in 2006 (19 percent) than in 1996 (15 percent). In other words, the exclusion criteria were slightly laxer in 2006 than in 1996, but the percentage of plants excluded was larger in 2006.
10
98 percent of excluded plants were private in both 1996 and 2006. In contrast, private plants accounted for only 91 percent of sample plants in 1996 and 89 percent in 2006 (authors’ calculations).
11
Paid workers were 99.7 percent of total employment (including unpaid workers; Appendix Table 1d) in both manufacturing and the 17 sample industries, in both 1996 and 2006.
12
It is impossible to construct a precise correspondence between the two revisions, because
several detailed categories (i.e., at the 5- or 4-digit level) in one classification are split among
detailed categories in the other classification; see Appendix Table 7 for the detailed definitions
used in this paper.
10
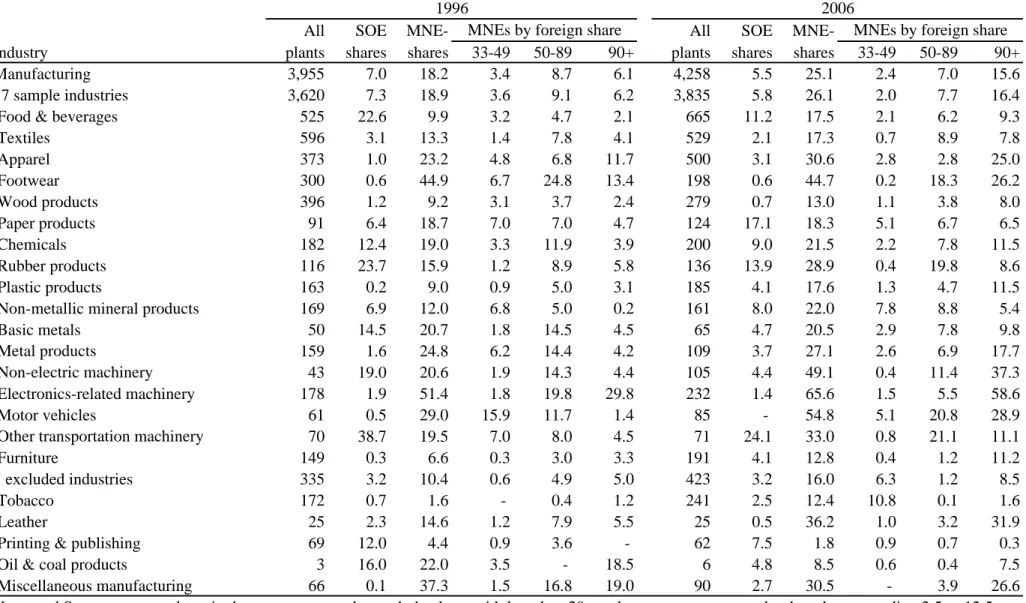
Plants in the 17 sample industries employed 4.0 million paid workers in 1996 and 4.3 million in 2006, or 92 and 90 percent, respectively, of all paid workers in plants meeting the sample criteria (Table 1). MNEs employed 19 percent of paid workers in the 17 sample industries in 1996 and 26 percent in 2006, slightly higher shares than in total manufacturing.
There was a conspicuously large increase in the share of heavily-foreign MNEs from 6.2 to over 16 percent during this period, while shares of minority- and majority-foreign MNEs declined. As mentioned above, the increase in the share of heavily-foreign MNEs was closely related to the fire sale created by the financial crisis in the late 1990s and to changes in the policy environment. Conversely, the share of SOEs declined some, largely as a result of privatization.
In 1996, MNE shares were 25 percent or more only four of the 17 sample industries (electronics-related machinery, footwear, motor vehicles, and metal products) but by 2006 MNE shares exceeded this threshold in eight industries and were above 33 percent in five of them (electronics-related machinery, motor vehicles, non-electric machinery, footwear, and other transportation machinery). Thus, over this decade, MNEs have become more dominant in the four machinery categories (including motor vehicles) they often dominate in other Asian economies (Ramstetter 2012b), and remained relatively large in footwear. The dominance of MNEs in machinery is related to large shares of intangible asset costs (i.e., in technology and marketing) in these industries, because it is relatively easy (cheap) to share intangible assets among different geographical locations (Markusen 2002).
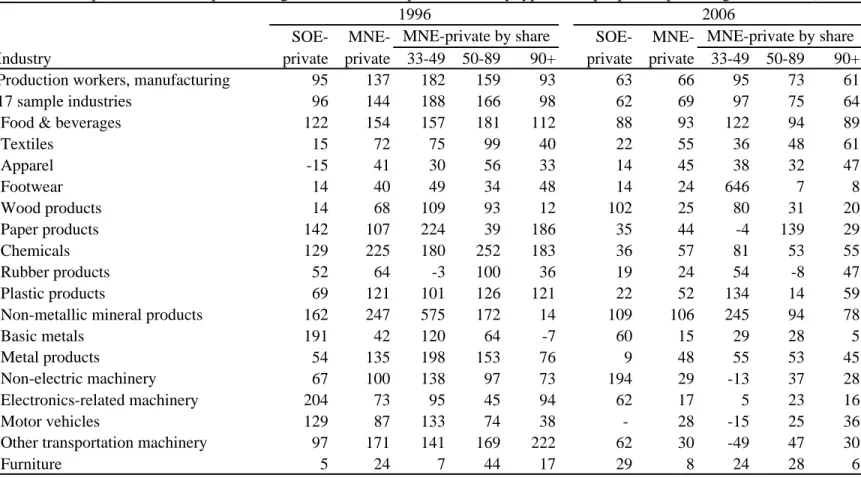
Table 2 shows unconditional wage differentials between MNEs and SOEs on the one hand, and private plants on the other, for both production and non-production workers.
13In both years, the mean MNE-private differential in the 17 sample industries combined was larger for
13
Wage are defined to include all compensation paid to workers including wages/salaries,
overtime, gifts & bonuses, and social security, whether paid in cash or in kind.
11
non-production workers (201 and 84 percent, in 1996 and 2006, respectively) than for production workers (144 and 69 percent, respectively).
14SOE-private differentials also declined for production workers (from 96 to 62 percent) but increased, and were relatively small for non-production workers (9 and 31 percent, respectively). At the industry level, MNE-private differentials of more than 50 percent were common in 1996 (13 of 17 industries for production workers, 16 of 17 for non-production workers), but rarer in 2006 (5 of 17 industries for production workers and 10 of 17 for non-production workers). However, the tendency for MNE-private wage differentials to be larger for non-production workers and to decline for both types of workers is clear in the industry-level data as well as the aggregate.
There was only one negative MNE-local differential for non-production workers in basic metals in 2006; the corresponding differential was positive but very small in 1996 (2 percent).
When MNE ownership groups are distinguished, MNE-private differentials for production workers tended to be largest for minority-foreign plants (188 percent in 1996 and 97 percent in 2006) and smallest for heavily foreign plants (98 and 64 percent, respectively, Table 2).
The pattern is also observed at the industry level. Differentials exceeding 50 percent were observed in 13 and eight industries, respectively, for minority-foreign MNEs and in eight and five industries, respectively, for heavily foreign MNEs. For non-production workers the pattern of MNE-private differentials was less consistent. In 1996, majority-foreign MNEs had the largest mean differentials when all 17 industries were combined, while differentials exceeded 50 percent in 14 industries and 100 percent in 11-12 industries for all ownership groups. In 2006, minority-foreign MNEs had the largest mean differentials, but majority-
14
The 1996 differentials reported here are much larger than those reported by Lipsey and
Sjöholm (2004a, p. 417). The major cause is probably our exclusion of plants with extremely
low labor productivity and fewer than 20 paid employees (see above). In addition, Table 2
shows the difference between unweighted mean wages in sample MNEs and private plants,
whereas Lipsey and Sjöholm’s calculate average wages for different ownership groups at the
three-digit level of ISIC revision 2, and aggregate up to two- and single-digit levels using
shares of total blue-collar and white-collar employees as weights.
12
foreign-private differentials exceeded 50 percent in 12 industries, while minority-foreign- private differentials exceeded this threshold in only 10 industries.
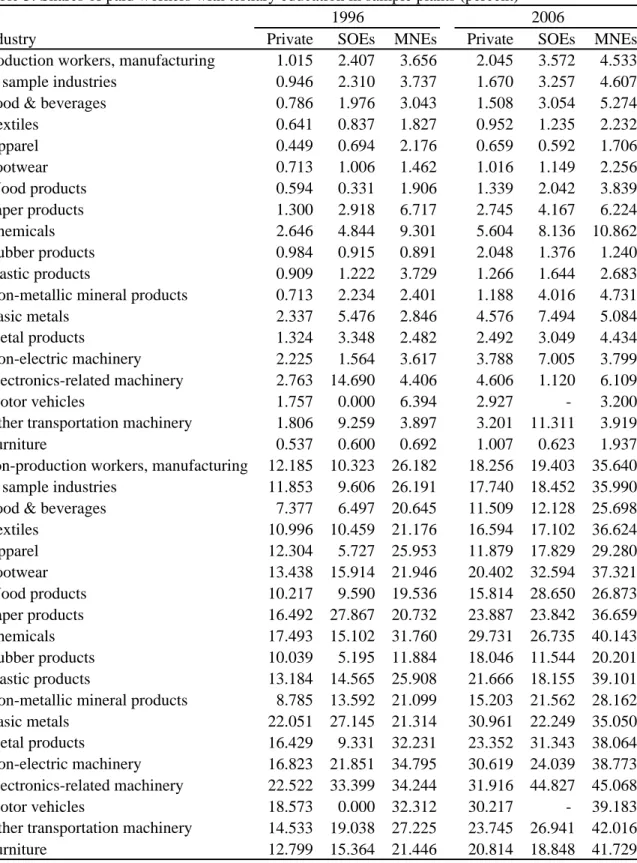
Table 3 shows shares of paid workers with tertiary education. When all sample plants are combined, tertiary shares of production workers were 3.9 times larger in MNEs than in private plants in 1996 (3.7 vs. 0.95 percent), but this differential fell to 2.6 times in 2006 (4.6 vs. 1.7 percent). Not surprisingly, tertiary shares of non-production workers were substantially larger than shares of production workers. However, MNE-private differentials were smaller for non-production workers and declined less, from 2.2-fold (21 vs. 11 percent) in 1996 to 2.0-fold (36 vs. 18 percent) in 2006. Tertiary shares of non-production workers ranked consistently high (7
thor higher) for both MNEs and private plants in four industries (chemicals, non-electric machinery, electronics-related machinery, and motor vehicles) and consistently low (11
thor lower) in five industries (food and beverages, textiles, wood, rubber, and non-metallic mineral products). For production workers, ranks were consistently high in only two industries (chemicals and electronics-related machinery) and consistently low in four (textiles, apparel, footwear, and furniture). The correlation between MNE-local wage differentials and corresponding tertiary share differentials was strong (0.72-0.77) for production workers in 2006 and non-production workers in 1996, but much weaker (0.30- 0.37) for production workers in 1996 and non-production workers in 2006.
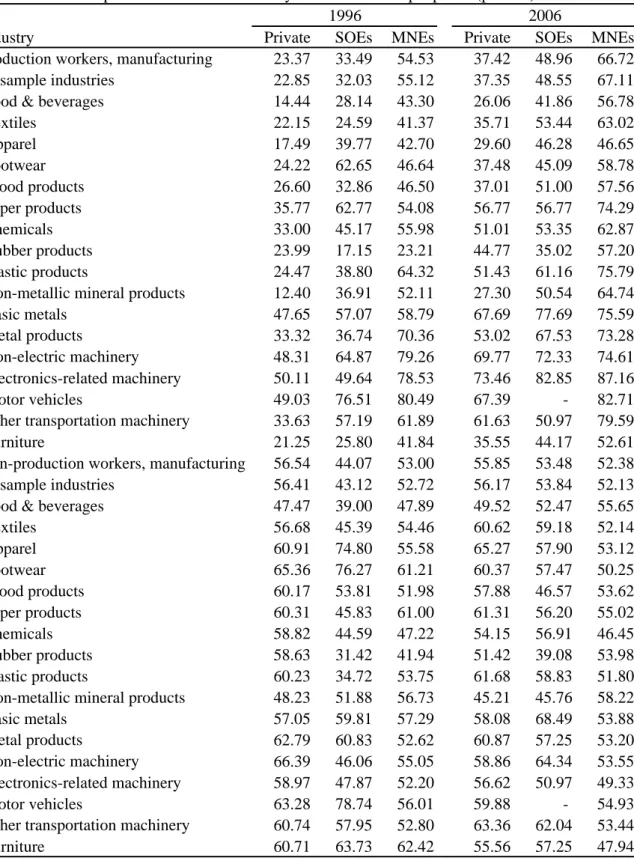
Share of workers with secondary education were much larger than shares of workers with
tertiary education, averaging over half of all paid workers for both production and non-
production workers in MNEs in both years (Table 4). For production workers, mean shares in
all sample plants were much larger than for private plants, but the difference narrowed over
the decade (from 55 vs. 23 percent in 1996 to 67 vs. 37 percent in 2006). The correlation of
percentage differences in these shares to MNE-private wage differentials was quite high in
2006 (0.81) but somewhat lower in 1996 (0.56). For non-production workers, mean secondary
13
shares in the 17 sample industries were actually a few percentage points lower in MNEs (53 percent in 1996, 52 percent in 2006) than in private plants (56 percent in both years).
Nonetheless, the correlation of MNE-private differences in secondary shares to corresponding wage differentials was reasonably strong in 2006 (0.65). On the other hand, this correlation was weaker and negative in 1996 (-0.40).
4. Conditional Wage Differentials from Estimates of Earnings Equations
The discussion above illustrates substantial, unconditional MNE-private wage differentials, and that these wage differentials often appear related to the tendency for MNEs often tend to hire relatively large shares of educated workers and correlated with other plant-level characteristics. Correspondingly, we follow the specification of Lipsey and Sjöholm (2004a) and estimate mean earnings at the plant level as a function of the educational background of workers, worker sex, energy per worker, material inputs per worker, and plant size.
LCE = a0 + a1(LEE) + a2(LME) + a3(LO) + a4(S5) + a5(S4) + a6(S3) + a7(S1) + a8(SF) + a9(DS) + a10(DF) (1) where
LCE=log of compensation per employee (rupiah) LEE=log of energy per employee (rupiah)
LME=log of materials (including parts) per employee (rupiah) LO=plant size, measured as the log of output (rupiah)
S5=share of paid workers with tertiary education (percent)
S4=share of paid workers who completed secondary (high school) education (percent) S3=share of paid workers who completed junior high school education (percent) S1=share of paid workers who did not complete primary school education (percent) SF=share of paid workers that are female (percent)
DS=dummy variable identifying SOE plants (=1 if MNE, 0 otherwise) DF=dummy variable identifying MNE plants (=1 if MNE, 0 otherwise)
Because plants that are energy and material input intensive, large, and skilled-worker
intensive are expected to pay relatively high mean wages, the signs of a1, a2, a3, a4, a5, and
a6 are expected to be positive and a7 negative. The sign of a8 is also expected to be negative
because females generally receive less education and training than men, are often more
14
willing to accept lower wages than men in exchange for time off to care for family members, and are frequently discriminated against in the work place. If the MNE-private differential a10 is significantly positive, MNEs pay relatively high wages after accounting for plant-level
variation in energy and material input intensity, size, and workforce educational background.
Equation (1) is estimated by OLS with robust standard errors for both production and non- production workers in 1996 and 2006. Estimates also include region and industry dummies to account for industry- and region-specific factors affecting mean wages at the plant level.
15A second equation is then estimated to see if MNE-private wage differentials depend on the extent of foreign ownership.
LCE = a0 + a1(LEE) + a2(LME) + a3(LO) + a4(S5) + a5(S4) + a6(S3) + a7(S1) + a8(SF) + a9(DS) + a10(DF1) + a11(DF5) + a11(DF9) (2) where
DF1=dummy variable identifying minority-foreign MNE plants (=1 if minority, 0 otherwise) DF5=dummy variable identifying majority-foreign MNE plants (=1 if majority, 0 otherwise) DF9=dummy variable identifying heavily-foreign MNE plants (=1 if heavy, 0 otherwise)
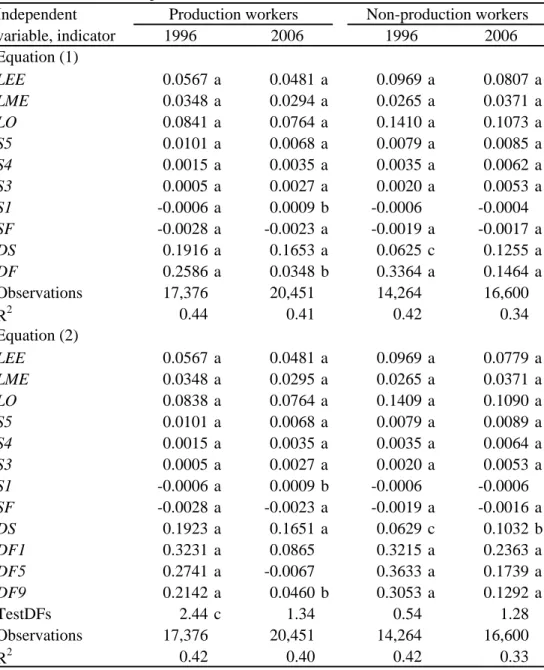
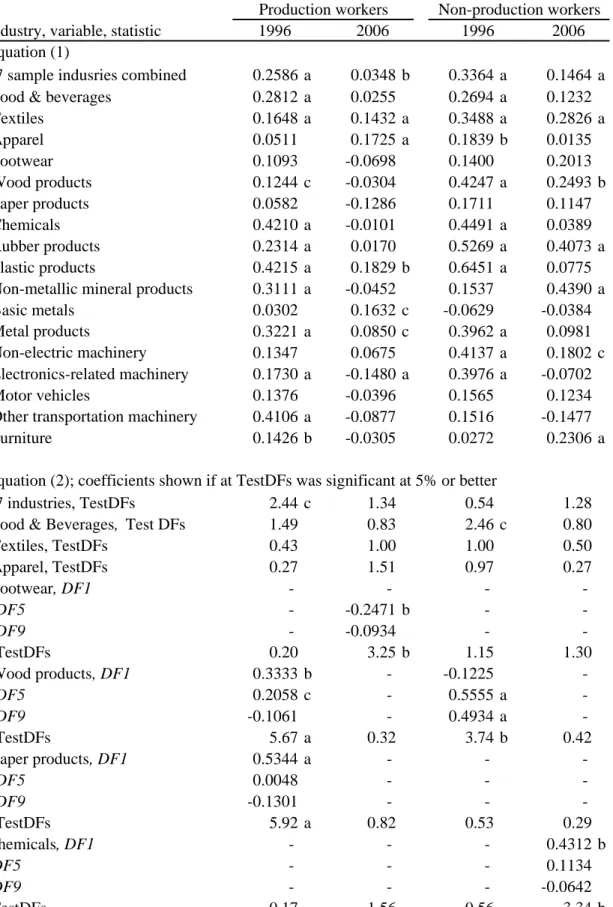
Estimates are performed for sample plants in all 17 industries combined (Table 5), as well as for each of the 17 industries separately to allow all parameters, including wage differentials, to differ among industries (Table 6). In large samples of all 17 industries, estimates of equations (1) and (2) performed more or less as expected. Coefficients on energy and material input intensity, size, and shares of workers with junior high or higher education were positive and significant, while the coefficient on the female share was negative in all estimates. The coefficient on the share of workers not completing primary education was negative and significant for production workers in 1996, but surprisingly, it became significantly positive
15
Industry dummies are defined at the 4-digit level of ISIC revision 2 for 1996 and revision 3
for 2006; this results in a larger number of dummies in 2006. Industry dummies are omitted
from industry-level estimates when the industry is defined at the 4-digit level (footwear in
2006, plastics in both years, motor vehicles in 1996, furniture in 2006). Please see Appendix
Tables 6a-6q for the exact number of industry dummies in each equation. Regional dummies
identify plants in Sumatra, West Java, Central Java (including Yogyakarta), East Java, and
East Indonesia (including Nusa Tenggara, Kalimantan, Sulawesi, Maluku, and Irian Jaya),
using Jakarta as the reference region.
15
in 2006. However, this coefficient was not significant for non-production workers. R
2was 0.33 or higher in all estimates, indicating that these equations explained the variation of wages among plants relatively well in these cross sections. When estimated at the industry level, correlations were weaker in some industries and years (Appendix Tables 6a-6q). For example, equation (1)’s R
2was as low as 0.14-0.19 for production wages in furniture in 1996 and rubber in 2006 and for non-production wages in wood in 2006. Again focusing on equation (1), coefficients were usually significant with the expected sign for plant size (55 of 68 estimates), shares of workers with tertiary and secondary education (41 estimates each), and energy per worker (40 estimates). However, less than half of the industry-level estimates of coefficients on material inputs per worker and the shares of workers with junior high education or those not completing primary education were significant with expected signs.
Estimates of equation (1) for all industries combined yielded positive and significant MNE- private wage differentials for both production and non-production workers in both 1996 and 2006 (Table 5). These conditional differentials were all substantially smaller than the unconditional differentials in Table 2 and declined over the decade, from 26 to 3.4 percent for production workers and from 34 to 15 percent for non-production workers. In contrast, SOE- private differentials remained relatively constant for production workers (19 and 16 percent, respectively) and increased for non-production workers (from 6.3 [significant at 9 percent] to 13 percent, respectively). Estimates of equation (2) indicated that MNE-private differentials did not differ significantly among MNE ownership groups if a standard 5 percent level is used.
The 1996 estimates of MNE-private differentials are substantially larger than the 12 and 22
percent, respectively, estimated by Lipsey and Sjöholm (2004a, p. 421), probably because we
excluded plants with exceedingly low labor productivity from the samples and because of
16
differences in the definitions of industry- and region dummies.
16Nonetheless, the key qualitative patterns were similar in both sets of results; there were positive and significant MNE-private wage differentials that were relatively large for non-production workers. Results also indicated that this pattern persisted in 2006, but that both differentials declined substantially. These trends and patterns are also consistent with those observed in unconditional differentials (Table 2) and with the view that Indonesia’s labor and manufacturing markets have become more competitive over this decade.
When equation (1) is estimated at the industry level, MNE-private wage differentials are found to vary greatly among industries (Table 6). For example, textiles was only industry in which wage differentials for both production and non-production workers were positive and significant (at the standard 5 percent level) in both years. Positive and significant differentials were also observed in both years for production workers in plastics, and for non-production workers in wood and rubber. On the other hand, MNE-private differentials were never significant at standard levels for production workers in six industries (footwear, wood, paper, basic metals, non-electric machinery, and motor vehicles) or non-production workers in five others (footwear, paper, basic metals, motor vehicles, and other transportation machinery). It is tempting to speculate about why differentials were consistently significant or insignificant in certain industries, but these industry groups are heterogeneous and there is no clear reason for distinguishing among them.
In 1996, positive and significant differentials were observed in 10 of the 17 industries for both production and non-production workers (Table 6). By 2006, positive and significant
16
In Table 5, samples were 1,079 plants (5.8 percent) smaller for production workers and 347
(2.4 percent) smaller for non-production workers than in Lipsey and Sjöholm (2004a). As
indicated above, we defined industry dummies at the 4-digit level and used only 6 regional
dummies, whereas Lipsey and Sjöholm used 3-digit level industry definitions and a full set of
provincial dummies. Our estimates of SOE-private differentials were also relatively large (19
vs. 6 percent for production workers and 6 vs. -13 percent for non-production workers).
17
differentials were only observed in four industries for production workers and five industries for non-production workers. There was a single negative and significant differential for production workers in electronics-related machinery in 2006, which contrasts with the positive differential in 1996. In other words, the industry level results suggest that positive and significant MNE-private wage differentials declined or became insignificant in 1996- 2006 for production workers in 10 industries and non-production workers in 11 industries.
The tendency for MNE-private differentials to decline or become insignificant is consistent with results for the large samples of 17 industries combined, but the industry-level results also suggest that MNE-private differentials were not pervasive, especially in 2006.
This is illustrated by substantial variation in the size of differentials among industries (Table 6). For production workers in 1996, positive and significant differentials were relatively large (30 percent or more) in chemicals, plastics, non-metallic mineral products, metal products, and other transportation machinery, but relatively small (17 percent or less) in textiles, wood, electronics-related machinery and furniture. By 2006, all positive and significant differentials were of similar magnitude (14-18 percent), suggesting that the positive and significant differential estimated when all plants were combined (3.5 percent) was driven by plants in the relatively few industries with significant differentials.
For non-production workers, the variation of differentials among industries was more
pronounced in both years (Table 6). In 1996, positive and significant differentials were
relatively large (40 percent or more) in seven industries (wood, chemicals, rubber, plastics,
metal products, non-electric machinery, and electronics-related machinery) and relatively
small (27 percent or less) in only two (textiles and apparel). In 2006, these differentials
remained relatively large in rubber and became relatively large in non-metallic mineral
products. The other three positive and significant differentials were also larger than the
estimate for all plants combined (23-28 percent vs. 15 percent). Thus, as with production
18
workers, the relatively low differential observed for all industries are combined again suggests that the aggregate result reflects the combined influence of large positive differentials in a few industries and insignificant differentials in most industries. Because most differentials were insignificant, significantly positive wage differentials were larger for non-production workers in only five industries in 2006, compared to nine industries in 1996.
Tests of the hypothesis that conditional MNE-private wage differentials varied among foreign ownership groups were not rejected at the standard 5 percent level in about three fourths of the 17 industries in both years (Table 6). And when differentials varied among ownership groups, patterns varied greatly over time and among industries. For production workers in 1996, significant differentials were observed in four industries (wood, paper, non- metallic mineral products, and furniture). In the first three industries, differentials were relatively large for minority-foreign plants and insignificant for heavily-foreign plants, while this pattern was reversed in furniture, but only if a 10 percent significance level is used. In 2006, there were significant differences among MNE ownership groups in five industries.
Three of these results involved negative differentials for majority-foreign (footwear) or minority-foreign (motor vehicles, other transportation machinery) MNEs. The other two involved positive differentials for heavily foreign MNEs (rubber, plastics).
For non-production workers in 1996, there were significant positive differentials involving
minority-foreign MNEs in furniture, majority-foreign MNEs in wood, rubber, and non-
metallic mineral products, as well as heavily-foreign MNEs in rubber. There was also a
significantly negative differential for heavily foreign MNEs in wood. By 2006, there were
only two significant differential coefficients, for minority-foreign MNEs in chemicals and
majority-foreign MNEs in non-electric machinery. The Wald test of coefficient equality also
indicated significant differences among ownership groups in plastics, but none of the
19
individual coefficients were significant at the standard level. Thus, these results suggest that MNE-private wage differentials were not strongly related to the foreign ownership share.
5. Conclusions and Future Research
This paper has extended research on wage differentials between MNEs and private plants in Indonesian manufacturing in three important respects. First, it added analysis of 2006 to 1996, finding that unconditional and conditional wage differentials in most industries appear to have declined during 1996-2006, but that wage differentials tended to be larger for non-production workers than for production workers in both periods. If all sample plants are combined, unconditional wage differentials fell from an average of 144 to 69 percent for production workers and from 201 to 84 percent for non-production workers. Conditional differentials that account for the influences or worker education and sex, as well as plant size, energy per worker, and material inputs per worker, were much smaller but revealed similar trends and patterns, falling from 26 to 3.5 percent for production workers and from 34 to 15 percent for non-production workers. These aggregate results suggest somewhat larger differentials than previous 1996 results in Lipsey and Sjöholm (2004a), mainly because several plants reporting unrealistically low labor productivity and a few small industries were excluded from the samples used in this study. However, both studies observe significantly positive, conditional differentials which were larger for non-production workers than for production workers.
Second, in addition to examining aggregate wage differentials, this study extended the
analysis to cover 17 industries separately. This extension is probably the paper’s most
important contribution and indicates that significant, conditional wage differentials were not
that pervasive among industries, especially for 2006. Even in 1996, industry-level
differentials were not significant at standard levels in about two-fifths of the industries for
both production and non-production workers. By 2006, insignificant differentials
20
predominated, with positive and significant differentials observed for just under one-fifth of the industries for production workers and one fourth for non-production workers. Similarly, wage differentials were larger for non-production workers than for production workers in only five industries in 2006, compared to nine in 1996. On the other hand, the industry-level analysis was consistent with the aggregate analysis in suggesting a tendency for MNE-private differentials to decline in most industries.
Third, the paper asked whether MNE-private differentials depended on the extent of foreign ownership in MNEs. The answer to this question was generally no. And in the few cases when there were significant differences in wage differentials among MNE ownership groups, the emerging patterns were not consistent among ownership groups, industries, or years. In other words, the distinction of MNE ownership groups does not appear particularly meaningful when analyzing MNE-private wage differentials in Indonesia.
As reported for other years in Lipsey and Sjöholm (2004b, 2005, 2006) and Sjöholm and
Lipsey (2006), there are several related but equally important topics that should be examined
in future research. For example, one can investigate how takeovers or changes in ownership
affect both wages and employment, or the effect of MNE presence on wages in local plants
(i.e., wage spillovers). All of these analyses require some degree of data panelization, which is
particularly difficult after the 1998 crisis mainly because of large variations in sample
coverage and the increased share of sample plants reporting unreasonable data. Long panels
spanning the crisis are also likely to be misleading because of large changes in economic
activity, as well as data collection. Nevertheless, it should be possible to create shorter panels
combining the census year data on worker education with census and annual survey data for
other variables in surrounding years, which can help address the issues mentioned above. In
addition, the panel dimension could be used to account for potential simultaneity bias that is
not easily accounted for in cross sections because of the lack of good instruments.
21
Unfortunately, however, as in Lipsey and Sjöholm (2004a), a potentially important omitted variable bias may remain because of the inability to account for aspects of worker quality not related to education such as experience, occupation, and training.
References:
Aitken, Brian, Ann. Harrison and Robert E. Lipsey (1996) “Wages and Foreign Ownership: A Comparative study of Mexico, Venezuela, and the United States”, Journal of International Economics, 40(3-4), 345-371.
BPS-Statistics (various years), Statistik Industri (Industrial Statistics), various volumes and underlying plant-level data, 1990-2009 issues. Jakarta: Badan Pusat Statistik.
Buckley, Peter J. and Mark Casson (1992), The Future of the Multinational Enterprise, 2nd Edition. London: Macmillan.
Casson, Mark (1987), The Firm and the Market: Studies on the Multinational and the Scope of the Firm, Cambridge, MA: MIT Press.
Caves, Richard E. (2007), Multinational Enterprise and Economic Analysis, 3
rdedition, London: Cambridge University Press.
Dunning, John H. (1993), Multinational Enterprises and the Global Economy. Workingham, U.K.: Addison-Wesley Publishing Co.
Feridhanusetyawan, Tubagus, Haryo Aswicahyono and Ari A Perdana (2001), "The Male- Female Wage Differentials in Indonesia", Economics Working Paper Series 059, Jakarta:
Centre for Strategic and International Studies.
Guerin, Bill (2002), “Sony pullout plan rocks Indonesia”, Asia Times, 7 December, http://www.atimes.com/atimes/Southeast_Asia/DL07Ae01.html.
Hwan, Shin Yoon (2011), Labor Relations in Korean Companies in Indonesia: Focusing on the Early Period", Kyoto Review of Southeast Asia (11), http://kyotoreview.org/issue- 11/labor-relations-in-korean-companies-in-indonesia-focusing-on-the-early-period/
Lee, Kiong-Hock and Shyamala Nagaraj (1995), “Sex Differences in Earnings: An Analysis of Malaysian Wage Data”, Journal of Development Studies, 31(3), 467-480.
Lim, David (1977), “Do Foreign Companies Pay Higher Wages than Their Local Counterparts in Malaysian Manufacturing”, Journal of Development Economics, 4(1), 55- 66.
Lipsey, Robert E., and Fredrik Sjöholm (2004a), “Foreign Direct Investment, Education, and Wages in Indonesian Manufacturing“, Journal of Development Economics, 73(1), 415-22.
Lipsey, Robert E., and Fredrik Sjöholm (2004b), “FDI and Wage Spillovers in Indonesian
Manufacturing,” Review of World Economics, 40(2), 321-32.
22
Lipsey, Robert E. and Fredrik Sjöholm (2005), “Host Country Impacts of Inward FDI: Why Such Different Answers?” in Theodore H. Moran, Edward M. Graham, and Magnus Blomstrom, eds., Does Foreign Direct Investment Promote Development?, Washington D.C.: Institute for International Economics, pp. 23-43.
Lipsey, Robert E. and Fredrik Sjöholm (2006), “Foreign Multinationals and Wages in Indonesia” in Eric D. Ramstetter and Fredrik Sjöholm, eds., Multinationals in Indonesia and Thailand: Wages, Productivity and Exports. Hampshire, UK: Palgrave-Macmillan, pp.
35-53.
Markusen, James R. (2002), Multinational Firms and the Theory of International Trade.
Cambridge, MA: M.I.T. Press.
Moran, Theodore H. (2001) Parental Supervision: The New Paradigm for Foreign Direct Investment and Development. Washington, D.C.: Institute for International Economics.
Movshuk, Oleksandr and Atsuko Matsuoka-Movshuk (2006), “Multinationals and Wages in Thai Manufacturing”, in Eric D. Ramstetter and Fredrik Sjöholm, eds., Multinationals in Indonesia and Thailand: Wages, Productivity and Exports. Hampshire, UK: Palgrave- Macmillan, pp. 54-81.
Pirmana, Viktor (2006), “Earnings Differential between Male-Female in Indonesia: Evidence from Sakernas Data”, Working Paper in Economics and Development Studies 2006-08, Bandung: Padjadjaran University.
Purnastuti, Losina, Paul W. Miller, and Ruhul Salim (2013), "Declining rates of return to education, evidence for Indonesia", Bulletin of Indonesian Economic Studies, 49(2), 213- 236.
Ramstetter, Eric D. (2004) "Labor productivity, wages, nationality, and foreign ownership shares in Thai manufacturing, 1996-2000", Journal of Asian Economics, 14(6), 861-884.
Ramstetter, Eric D. (2012a), “Do Multinationals Pay High Wages in Malaysian Manufacturing?”, Working Paper 2012-05, Kitakyushu: International Centre for the Study of East Asian Development.
Ramstetter, Eric D. (2012b), “Foreign Multinationals in East Asia’s Large Developing Economies”, Working Paper 2012-06, Kitakyushu: International Centre for the Study of East Asian Development.
Ramstetter, Eric D. (2013), “Wage Differentials between Foreign Multinationals and Local Plants and Worker Quality in Malaysian Manufacturing”, Working Paper 2013-22, Kitakyushu: International Centre for the Study of East Asian Development.
Ramstetter, Eric D. and Dionsius Narjoko (2012), “Ownership and Energy Efficiency in Indonesia’s Manufacturing Plants”, Working Paper 2012-14, Kitakyushu: International Centre for the Study of East Asian Development.
Ramstetter, Eric D. and Phan Minh Ngoc (2007), “Employee Compensation, Ownership, and Producer Concentration in Vietnam's Manufacturing Industries", Working Paper 2012-07, Kitakyushu: International Centre for the Study of East Asian Development.
Ramstetter, Eric D. and Sadayuki Takii, (2006), “Exporting and Foreign Ownership in Indonesian Manufacturing”, Economics and Finance in Indonesia 54(3), 317–345.
Rugman, Alan M., (1980) "Internalization as a General Theory of Foreign Direct Investment:
A Re-Appraisal of the Literature," Weltwirtschaftliches Archiv, 116(2), 365-379.
23
Rugman, Alan M. (1985) "Internalization is Still a General Theory of Foreign Direct Investment," Weltwirtschaftliches Archiv, 121(3), 570-575.
Sjöholm, Fredrik and Robert E. Lipsey (2006), “Foreign Firms and Indonesian Manufacturing Wages: An Analysis with Panel Data”, Economic Development and Cultural Change, 55(1), 201-221.
Sohn, Katie (2013), “Monetary and Nonmonetary Returns to Education in Indonesia”, The Developing Economies, 51(1), 34-59.
Takii, Sadayuki (2004), “Productivity Differentials between Local and Foreign Plants in Indonesian Manufacturing, 1995,” World Development, 32(11), 1957-1969.
Takii, Sadayuki and Eric D. Ramstetter (2005) “Multinational Presence and Labor Productivity Differentials in Indonesian Manufacturing 1975-2001”, Bulletin of Indonesian Economic Studies, 41(2), 221-242.
Toyo Keizai (various years), Kaigai Shinshutsu Kigyou Souran: Kaisha Betsu Hen [A Comprehensive Survey of Firms Overseas: Compiled by Company], 1997 and 2007 issues.
Tokyo: Toyo Keizai.
World Bank (2014), World Development Indicators, data downloaded 21 January.
http://databank.worldbank.org/data/views/variableselection/selectvariables.aspx?source=w
orld-development-indicators#.
Table 1: Total paid workers (production & non-production) in sample plants (all plants in 1000s; SOE & MNE shares in % of industry subtotals)
1996 2006
All SOE MNE- All SOE MNE-
Industry plants shares shares 33-49 50-89 90+ plants shares shares 33-49 50-89 90+
Manufacturing 3,955 7.0 18.2 3.4 8.7 6.1 4,258 5.5 25.1 2.4 7.0 15.6
17 sample industries 3,620 7.3 18.9 3.6 9.1 6.2 3,835 5.8 26.1 2.0 7.7 16.4
Food & beverages 525 22.6 9.9 3.2 4.7 2.1 665 11.2 17.5 2.1 6.2 9.3
Textiles 596 3.1 13.3 1.4 7.8 4.1 529 2.1 17.3 0.7 8.9 7.8
Apparel 373 1.0 23.2 4.8 6.8 11.7 500 3.1 30.6 2.8 2.8 25.0
Footwear 300 0.6 44.9 6.7 24.8 13.4 198 0.6 44.7 0.2 18.3 26.2
Wood products 396 1.2 9.2 3.1 3.7 2.4 279 0.7 13.0 1.1 3.8 8.0
Paper products 91 6.4 18.7 7.0 7.0 4.7 124 17.1 18.3 5.1 6.7 6.5
Chemicals 182 12.4 19.0 3.3 11.9 3.9 200 9.0 21.5 2.2 7.8 11.5
Rubber products 116 23.7 15.9 1.2 8.9 5.8 136 13.9 28.9 0.4 19.8 8.6
Plastic products 163 0.2 9.0 0.9 5.0 3.1 185 4.1 17.6 1.3 4.7 11.5
Non-metallic mineral products 169 6.9 12.0 6.8 5.0 0.2 161 8.0 22.0 7.8 8.8 5.4
Basic metals 50 14.5 20.7 1.8 14.5 4.5 65 4.7 20.5 2.9 7.8 9.8
Metal products 159 1.6 24.8 6.2 14.4 4.2 109 3.7 27.1 2.6 6.9 17.7
Non-electric machinery 43 19.0 20.6 1.9 14.3 4.4 105 4.4 49.1 0.4 11.4 37.3
Electronics-related machinery 178 1.9 51.4 1.8 19.8 29.8 232 1.4 65.6 1.5 5.5 58.6
Motor vehicles 61 0.5 29.0 15.9 11.7 1.4 85 - 54.8 5.1 20.8 28.9
Other transportation machinery 70 38.7 19.5 7.0 8.0 4.5 71 24.1 33.0 0.8 21.1 11.1
Furniture 149 0.3 6.6 0.3 3.0 3.3 191 4.1 12.8 0.4 1.2 11.2
5 excluded industries 335 3.2 10.4 0.6 4.9 5.0 423 3.2 16.0 6.3 1.2 8.5
Tobacco 172 0.7 1.6 - 0.4 1.2 241 2.5 12.4 10.8 0.1 1.6
Leather 25 2.3 14.6 1.2 7.9 5.5 25 0.5 36.2 1.0 3.2 31.9
Printing & publishing 69 12.0 4.4 0.9 3.6 - 62 7.5 1.8 0.9 0.7 0.3
Oil & coal products 3 16.0 22.0 3.5 - 18.5 6 4.8 8.5 0.6 0.4 7.5
Miscellaneous manufacturing 66 0.1 37.3 1.5 16.8 19.0 90 2.7 30.5 - 3.9 26.6
Notes and Sources: - = no plants in the category; samples exclude plants with less than 20 employees, output per worker less than exceeding 2.5 or 12.5 million rupiah in 1996 and 2006, respectively, and value added per worker less than 1.0 or 5.0 million rupiah, respectively; see Appendix Table 7 for detailed industry definitions, which differ in important respects between 1996 and 2006; authors' compilations from BPS-Statistics (various years).
MNEs by foreign share MNEs by foreign share
24
Table 2: SOE-private and MNE-private wage differentials for paid workers by type in sample plants (percentage differences)
1996 2006
SOE- MNE- SOE- MNE-
Industry private private 33-49 50-89 90+ private private 33-49 50-89 90+
Production workers, manufacturing 95 137 182 159 93 63 66 95 73 61
17 sample industries 96 144 188 166 98 62 69 97 75 64
Food & beverages 122 154 157 181 112 88 93 122 94 89
Textiles 15 72 75 99 40 22 55 36 48 61
Apparel -15 41 30 56 33 14 45 38 32 47
Footwear 14 40 49 34 48 14 24 646 7 8
Wood products 14 68 109 93 12 102 25 80 31 20
Paper products 142 107 224 39 186 35 44 -4 139 29
Chemicals 129 225 180 252 183 36 57 81 53 55
Rubber products 52 64 -3 100 36 19 24 54 -8 47
Plastic products 69 121 101 126 121 22 52 134 14 59
Non-metallic mineral products 162 247 575 172 14 109 106 245 94 78
Basic metals 191 42 120 64 -7 60 15 29 28 5
Metal products 54 135 198 153 76 9 48 55 53 45
Non-electric machinery 67 100 138 97 73 194 29 -13 37 28
Electronics-related machinery 204 73 95 45 94 62 17 5 23 16
Motor vehicles 129 87 133 74 38 - 28 -15 25 36
Other transportation machinery 97 171 141 169 222 62 30 -49 47 30
Furniture 5 24 7 44 17 29 8 24 28 6
MNE-private by share MNE-private by share
25
Table 2 (continued)
1996 2006
SOE- MNE- SOE- MNE-
Industry private private 33-49 50-89 90+ private private 33-49 50-89 90+
Non-production workers, manufacturing 11 194 179 222 161 30 82 114 90 76
17 sample industries 9 201 190 230 166 31 84 117 92 78
Food & beverages 26 225 158 293 157 33 106 155 110 97
Textiles 14 144 46 215 82 -1 106 311 102 95
Apparel -26 188 120 224 179 69 52 69 90 45
Footwear 68 82 11 82 104 43 95 -43 96 101
Wood products -5 205 90 285 146 32 37 16 23 43
Paper products 19 66 111 42 87 28 28 18 55 23
Chemicals -3 198 222 198 181 40 46 90 61 30
Rubber products 16 160 -30 222 126 51 91 23 95 93
Plastic products -33 183 146 140 228 13 33 87 -11 43
Non-metallic mineral products 51 156 148 207 -14 80 162 198 143 170
Basic metals -0 2 80 -5 -15 46 -13 7 -11 -18
Metal products -38 218 185 291 92 9 66 71 77 63
Non-electric machinery 18 170 332 131 118 -36 56 27 83 47
Electronics-related machinery 89 107 80 84 132 -64 36 8 17 40
Motor vehicles -22 171 170 148 270 - 72 80 68 72
Other transportation machinery 46 168 191 176 101 11 32 60 43 27
Furniture -37 60 455 35 42 42 64 104 138 54
Notes and Sources: see Table 1.
MNE-private by share MNE-private by share
26
Table 3: Shares of paid workers with tertiary education in sample plants (percent)
1996 2006
Industry Private SOEs MNEs Private SOEs MNEs
Production workers, manufacturing 1.015 2.407 3.656 2.045 3.572 4.533
17 sample industries 0.946 2.310 3.737 1.670 3.257 4.607
Food & beverages 0.786 1.976 3.043 1.508 3.054 5.274
Textiles 0.641 0.837 1.827 0.952 1.235 2.232
Apparel 0.449 0.694 2.176 0.659 0.592 1.706
Footwear 0.713 1.006 1.462 1.016 1.149 2.256
Wood products 0.594 0.331 1.906 1.339 2.042 3.839
Paper products 1.300 2.918 6.717 2.745 4.167 6.224
Chemicals 2.646 4.844 9.301 5.604 8.136 10.862
Rubber products 0.984 0.915 0.891 2.048 1.376 1.240
Plastic products 0.909 1.222 3.729 1.266 1.644 2.683
Non-metallic mineral products 0.713 2.234 2.401 1.188 4.016 4.731
Basic metals 2.337 5.476 2.846 4.576 7.494 5.084
Metal products 1.324 3.348 2.482 2.492 3.049 4.434
Non-electric machinery 2.225 1.564 3.617 3.788 7.005 3.799 Electronics-related machinery 2.763 14.690 4.406 4.606 1.120 6.109
Motor vehicles 1.757 0.000 6.394 2.927 - 3.200
Other transportation machinery 1.806 9.259 3.897 3.201 11.311 3.919
Furniture 0.537 0.600 0.692 1.007 0.623 1.937
Non-production workers, manufacturing 12.185 10.323 26.182 18.256 19.403 35.640 17 sample industries 11.853 9.606 26.191 17.740 18.452 35.990 Food & beverages 7.377 6.497 20.645 11.509 12.128 25.698
Textiles 10.996 10.459 21.176 16.594 17.102 36.624
Apparel 12.304 5.727 25.953 11.879 17.829 29.280
Footwear 13.438 15.914 21.946 20.402 32.594 37.321
Wood products 10.217 9.590 19.536 15.814 28.650 26.873
Paper products 16.492 27.867 20.732 23.887 23.842 36.659
Chemicals 17.493 15.102 31.760 29.731 26.735 40.143
Rubber products 10.039 5.195 11.884 18.046 11.544 20.201
Plastic products 13.184 14.565 25.908 21.666 18.155 39.101 Non-metallic mineral products 8.785 13.592 21.099 15.203 21.562 28.162
Basic metals 22.051 27.145 21.314 30.961 22.249 35.050
Metal products 16.429 9.331 32.231 23.352 31.343 38.064
Non-electric machinery 16.823 21.851 34.795 30.619 24.039 38.773 Electronics-related machinery 22.522 33.399 34.244 31.916 44.827 45.068
Motor vehicles 18.573 0.000 32.312 30.217 - 39.183
Other transportation machinery 14.533 19.038 27.225 23.745 26.941 42.016
Furniture 12.799 15.364 21.446 20.814 18.848 41.729
Notes and Sources: see Table 1.
27
Table 4: Shares of paid workers with secondary education in sample plants (percent)
1996 2006
Industry Private SOEs MNEs Private SOEs MNEs
Production workers, manufacturing 23.37 33.49 54.53 37.42 48.96 66.72
17 sample industries 22.85 32.03 55.12 37.35 48.55 67.11
Food & beverages 14.44 28.14 43.30 26.06 41.86 56.78
Textiles 22.15 24.59 41.37 35.71 53.44 63.02
Apparel 17.49 39.77 42.70 29.60 46.28 46.65
Footwear 24.22 62.65 46.64 37.48 45.09 58.78
Wood products 26.60 32.86 46.50 37.01 51.00 57.56
Paper products 35.77 62.77 54.08 56.77 56.77 74.29
Chemicals 33.00 45.17 55.98 51.01 53.35 62.87
Rubber products 23.99 17.15 23.21 44.77 35.02 57.20
Plastic products 24.47 38.80 64.32 51.43 61.16 75.79
Non-metallic mineral products 12.40 36.91 52.11 27.30 50.54 64.74
Basic metals 47.65 57.07 58.79 67.69 77.69 75.59
Metal products 33.32 36.74 70.36 53.02 67.53 73.28
Non-electric machinery 48.31 64.87 79.26 69.77 72.33 74.61 Electronics-related machinery 50.11 49.64 78.53 73.46 82.85 87.16
Motor vehicles 49.03 76.51 80.49 67.39 - 82.71
Other transportation machinery 33.63 57.19 61.89 61.63 50.97 79.59
Furniture 21.25 25.80 41.84 35.55 44.17 52.61
Non-production workers, manufacturing 56.54 44.07 53.00 55.85 53.48 52.38
17 sample industries 56.41 43.12 52.72 56.17 53.84 52.13
Food & beverages 47.47 39.00 47.89 49.52 52.47 55.65
Textiles 56.68 45.39 54.46 60.62 59.18 52.14
Apparel 60.91 74.80 55.58 65.27 57.90 53.12
Footwear 65.36 76.27 61.21 60.37 57.47 50.25
Wood products 60.17 53.81 51.98 57.88 46.57 53.62
Paper products 60.31 45.83 61.00 61.31 56.20 55.02
Chemicals 58.82 44.59 47.22 54.15 56.91 46.45
Rubber products 58.63 31.42 41.94 51.42 39.08 53.98
Plastic products 60.23 34.72 53.75 61.68 58.83 51.80
Non-metallic mineral products 48.23 51.88 56.73 45.21 45.76 58.22
Basic metals 57.05 59.81 57.29 58.08 68.49 53.88
Metal products 62.79 60.83 52.62 60.87 57.25 53.20
Non-electric machinery 66.39 46.06 55.05 58.86 64.34 53.55 Electronics-related machinery 58.97 47.87 52.20 56.62 50.97 49.33
Motor vehicles 63.28 78.74 56.01 59.88 - 54.93
Other transportation machinery 60.74 57.95 52.80 63.36 62.04 53.44
Furniture 60.71 63.73 62.42 55.56 57.25 47.94
Notes and Sources: see Table 1.
28
Independent Production workers Non-production workers
variable, indicator 1996 2006 1996 2006
LEE 0.0567 a 0.0481 a 0.0969 a 0.0807 a
LME 0.0348 a 0.0294 a 0.0265 a 0.0371 a
LO 0.0841 a 0.0764 a 0.1410 a 0.1073 a
S5 0.0101 a 0.0068 a 0.0079 a 0.0085 a
S4 0.0015 a 0.0035 a 0.0035 a 0.0062 a
S3 0.0005 a 0.0027 a 0.0020 a 0.0053 a
S1 -0.0006 a 0.0009 b -0.0006 -0.0004
SF -0.0028 a -0.0023 a -0.0019 a -0.0017 a
DS 0.1916 a 0.1653 a 0.0625 c 0.1255 a
DF 0.2586 a 0.0348 b 0.3364 a 0.1464 a
Observations 17,376 20,451 14,264 16,600
R2 0.44 0.41 0.42 0.34
LEE 0.0567 a 0.0481 a 0.0969 a 0.0779 a
LME 0.0348 a 0.0295 a 0.0265 a 0.0371 a
LO 0.0838 a 0.0764 a 0.1409 a 0.1090 a
S5 0.0101 a 0.0068 a 0.0079 a 0.0089 a
S4 0.0015 a 0.0035 a 0.0035 a 0.0064 a
S3 0.0005 a 0.0027 a 0.0020 a 0.0053 a
S1 -0.0006 a 0.0009 b -0.0006 -0.0006
SF -0.0028 a -0.0023 a -0.0019 a -0.0016 a
DS 0.1923 a 0.1651 a 0.0629 c 0.1032 b
DF1 0.3231 a 0.0865 0.3215 a 0.2363 a
DF5 0.2741 a -0.0067 0.3633 a 0.1739 a
DF9 0.2142 a 0.0460 b 0.3053 a 0.1292 a
TestDFs 2.44 c 1.34 0.54 1.28
Observations 17,376 20,451 14,264 16,600
R2 0.42 0.40 0.42 0.33
Table 5: OLS Estimates of MNE-Private Compensation Differentials and Other Slope Coefficients from Equations (1) and (2); all p-values based on robust standard errors; 17 sample industries combined
Equation (1)
Equation (2)
Note: a=signficant at the 1% level, b=significant at the 5% level, c=significant at the 10% level; the TestDFs rows show Wald tests of the hypothesis that
coefficients on all foreign ownership dummies are equal and associated p-values;
all estimates include 5 regional dummies and 91 (1996) or 102 (2006) industry dummies (see the text for definitions); full results including the constant and all dummy coefficients are available from the authors.
29
Production workers Non-production workers
Industry, variable, statistic 1996 2006 1996 2006
17 sample indusries combined 0.2586 a 0.0348 b 0.3364 a 0.1464 a
Food & beverages 0.2812 a 0.0255 0.2694 a 0.1232
Textiles 0.1648 a 0.1432 a 0.3488 a 0.2826 a
Apparel 0.0511 0.1725 a 0.1839 b 0.0135
Footwear 0.1093 -0.0698 0.1400 0.2013
Wood products 0.1244 c -0.0304 0.4247 a 0.2493 b
Paper products 0.0582 -0.1286 0.1711 0.1147
Chemicals 0.4210 a -0.0101 0.4491 a 0.0389
Rubber products 0.2314 a 0.0170 0.5269 a 0.4073 a
Plastic products 0.4215 a 0.1829 b 0.6451 a 0.0775
Non-metallic mineral products 0.3111 a -0.0452 0.1537 0.4390 a
Basic metals 0.0302 0.1632 c -0.0629 -0.0384
Metal products 0.3221 a 0.0850 c 0.3962 a 0.0981
Non-electric machinery 0.1347 0.0675 0.4137 a 0.1802 c Electronics-related machinery 0.1730 a -0.1480 a 0.3976 a -0.0702
Motor vehicles 0.1376 -0.0396 0.1565 0.1234
Other transportation machinery 0.4106 a -0.0877 0.1516 -0.1477
Furniture 0.1426 b -0.0305 0.0272 0.2306 a
17 industries, TestDFs 2.44 c 1.34 0.54 1.28
Food & Beverages, Test DFs 1.49 0.83 2.46 c 0.80
Textiles, TestDFs 0.43 1.00 1.00 0.50
Apparel, TestDFs 0.27 1.51 0.97 0.27
Footwear, DF1 - - - -
DF5 - -0.2471 b - -
DF9 - -0.0934 - -
TestDFs 0.20 3.25 b 1.15 1.30
Wood products, DF1 0.3333 b - -0.1225 -
DF5 0.2058 c - 0.5555 a -
DF9 -0.1061 - 0.4934 a -
TestDFs 5.67 a 0.32 3.74 b 0.42
Paper products, DF1 0.5344 a - - -
DF5 0.0048 - - -
DF9 -0.1301 - - -
TestDFs 5.92 a 0.82 0.53 0.29
Chemicals, DF1 - - - 0.4312 b
DF5 - - - 0.1134
DF9 - - - -0.0642
TestDFs 0.17 1.56 0.56 3.34 b
Table 6: OLS Estimates of MNE-Private Compensation Differentials from Equations (1) and (2); all p-values based on robust standard errors; industry-level estimates
Equation (1)
Equation (2); coefficients shown if at TestDFs was significant at 5% or better