1
Ⅳ . 研究成果の刊行物・別刷
2
0892-6638/14/0028-0001 © FASEB 1
The FASEB Journal article fj.13-245522. Published online January 3, 2014.
The FASEB Journal • Research Communication
Noninvasive and quantitative live imaging r eveals a potential str ess-r esponsive enhancer in the
failing hear t
Ken Matsuoka,*,† Yoshihiro Asano,*,†,1 Shuichiro Higo,*,† Osamu Tsukamoto,† Yi Yan,† Satoru Yamazaki,§ Takashi Matsuzaki,* Hidetaka Kioka,*,† Hisakazu Kato,†
Yoshihiro Uno,‡ Masanori Asakura, Hiroshi Asanuma,¶ Tetsuo Minamino,*
Hiroyuki Aburatani,# Masafumi Kitakaze, Issei Komuro,* and Seiji Takashima*,†
*Department of Cardiovascular Medicine and †Department of Medical Biochemistry and ‡Laboratory of Reproductive Engineering, Institute of Experimental Animal Sciences, Osaka University Graduate School of Medicine, Suita, Japan; §Department of Cell Biology and Department of Clinical Research and Development, National Cerebral and Cardiovascular Center Research Institute, Suita, Japan;
¶Department of Cardiovascular Science and Technology, Kyoto Prefectural University School of Medicine, Kyoto, Japan; and #Genome Science Division, Research Center for Advanced Science and Technology, University of Tokyo, Tokyo, Japan
ABSTRACT Recent advances in genome analysis have enabled the identification of numerous distal enhancers that regulate gene expression in various conditions. However, the enhancers involved in patho- logical conditions are largely unknown because of the lack of in vivo quantitative assessment of enhancer activity in live animals. Here, we established a noninva- sive and quantitative live imaging system for monitoring transcriptional activity and identified a novel stress- responsive enhancer of Nppa and Nppb, the most common markers of heart failure. The enhancer is a 650-bp fragment within 50 kb of the Nppa and Nppb loci. A chromosome conformation capture (3C) assay revealed that this distal enhancer directly interacts with the 5=-flanking regions of Nppa and Nppb. To monitor the enhancer activity in a live heart, we established an imaging system using the firefly luciferase reporter.
Using this imaging system, we observed that the novel enhancer activated the reporter gene in pressure over- load-induced failing hearts (failing hearts: 5.7±1.3- fold; sham-surgery hearts: 1.0±0.2-fold; P<0.001, re- peated-measures ANOVA). This method will be particularly useful for identifying enhancers that func- tion only during pathological conditions.—Matsuoka, K., Asano, Y., Higo, S., Tsukamoto, O., Yan, Y., Ya- mazaki, S., Matsuzaki, T., Kioka, H., Kato, H., Uno, Y., Asakura, M., Asanuma, H., Minamino, T., Aburatani, H., Kitakaze, M., Komuro, I., and Takashima, S. Non- invasive and quantitative live imaging reveals a poten-
tial stress-responsive enhancer in the failing heart.
FASEB J. 28, 000 – 000 (2014). www.fasebj.org
Key Words: natriuretic peptide · transcriptional regulation · in vivo assessment
Gene expression is regulated through the inte- grated action of many cis-regulatory elements, includ- ing core promoters, proximal promoters, distant en- hancers, and insulators (1). Several methods have been used to explore the function of cis-regulatory elements during a variety of developmental stages (2, 3). How- ever, the identification of gene regulatory elements with pathophysiological roles has been technically dif- ficult because there are few appropriate models for monitoring transcriptional activity in live animals un- der pathological conditions.
Here, we focused on the regulatory elements that are responsive to heart failure. The natriuretic peptides, atrial natriuretic peptide (ANP) and brain natriuretic peptide (BNP), encoded by the neighboring genes Nppa and Nppb are activated in the embryonic heart, down-regulated after birth, and then reactivated during heart failure. Both peptides are well-known biomarkers that are strongly induced during heart failure and represent its severity. Cardiologists frequently use these peptides as natriuretic and vasorelaxant agents to treat various clinical conditions (4 – 8). Many studies have tried to elucidate the mechanisms of their transcrip- tional regulation because factors that regulate these Abbreviations: 3C, chromosome conformation capture;
ANP, atrial natriuretic peptide; BNP, brain natriuretic pep- tide; ChIP-seq, chromatin immunoprecipitation sequencing;
CMV, cytomegalovirus; CR, conserved region; CTCF, CCCTC- binding factor; H3K4me1, histone H3 monomethylated at lysine 4; H3K4me3, histone H3 trimethylated at lysine 4; PE, phenylephrine; TAC, transverse aortic constriction
1 Correspondence: Osaka University Graduate School of Medicine, 2-2 Yamadaoka, Suita, Osaka 565– 0871, Japan.
E-mail: [email protected] doi: 10.1096/fj.13-245522
This article includes supplemental data. Please visit http://
www.fasebj.org to obtain this information.
2 Vol. 28 April 2014 The FASEB Journal · www.fasebj.org MATSUOKA ET AL.
natriuretic peptides are potential therapeutic targets for heart disease (9 –14).
Mice transgenic for various loci, including the 5=- flanking regions of the natriuretic peptide genes, have been used to identify the regulatory elements required for transcriptional activation either during heart devel- opment or in the diseased heart. These studies re- ported that the 5=-flanking regions of the natriuretic peptide genes regulated their expression during heart development (9, 10, 13); however, the 5=-flanking re- gions were not responsible for their specific reactiva- tion in the diseased heart (11, 12). A recent study identified the distal enhancer elements regulating the natriuretic peptide genes in the developing heart by examining cardiac-specific transcription factor binding sites; however, these enhancer elements did not re- spond to heart failure (14). Therefore, the stress- responsive regulatory elements that function during heart failure have not yet been identified and are potentially located outside the 5=-flanking regions.
In this study, we aimed to identify the novel stress- responsive enhancer elements of the Nppa and Nppb genes in the failing heart. Furthermore, we established a noninvasive and quantitative live imaging assay to monitor the transcriptional activity of candidate en- hancers in the failing heart. In vivo live imaging of the firefly luciferase reporter in a single mouse enabled us to analyze the sequential changes in enhancer activity during the progression of heart failure. Combined with a fine mapping technique using epigenetic markers, we identified a 650-bp stress-responsive enhancer that was strongly activated by cardiac hypertrophy and heart failure.
MATERIALS AND METHODS
Animals
All procedures were performed according to the U.S. Na- tional Institutes of Health (NIH) Guide for the Care and Use of Laboratory Animals (NIH publication no. 85-23, revised 1996) and were approved by the Animal Experiments Com- mittee, Osaka University (approval no. 21-78-10).
Reagents and antibodies
Phenylephrine (PE) was purchased from Sigma-Aldrich (St.
Louis, MO, USA). The anti-RNA polymerase II and anti- histone H3 trimethylated at lysine 4 (H3K4me3) antibodies used for chromatin immunoprecipitation sequencing (ChIP- seq) were kind gifts from Dr. H. Kimura (Graduate School of Frontier Biosciences, Osaka University).
Primary culture of neonatal rat cardiomyocytes
Ventricular myocytes obtained from 1- or 2-d-old Wistar rats were prepared and cultured overnight in Dulbecco’s modi- fied Eagle’s medium (Sigma-Aldrich) containing 10% FBS, as described previously (15).
Comparative genomics
Genome-wide multiple alignments of the genomic sequences containing the Nppa and Nppb genes were performed using the University of California Santa Cruz (UCSC) Genome Browser (16); 8 vertebrate species were compared, including mouse (mm9, July 2007), rat (m4, Nov. 2004), human (hg18, Mar. 2006), orangutan (ponAbe2, July 2007), dog (canFam2, May 2005), horse (equCab1, Jan. 2007), opossum (mon- Dom4, Jan. 2006), and chicken (galGal3, May 2006). We used vertebrate Multiz alignment of DNA sequences (17) to ana- lyze the homology of DNA sequences among mouse and other species. We used the Placental Mammal Basewise Conservation assessed by PhyloP (18) to assess the degree of mammalian conservation. Next, we identified discrete con- served fragments. The transcribed sequences within the con- served set were filtered out using known genes, spliced ESTs, and mRNA annotations obtained from the UCSC genome browser. Finally, we manually curated the data set to remove any additional false positives by visual examination of the UCSC genomic data. We defined the noncoding conserved regions (CRs) that were homologous at least in the human and mouse genomes and at least 1 kb away from the tran- scription start sites as the enhancer candidates.
ChIP sequencing on mouse heart tissues
Whole hearts were isolated from 8-wk-old C57BL6 mice, perfused rapidly with cold PBS, flash-frozen in liquid nitro- gen, homogenized using a sterile tissue grinder, and cross- linked with 0.3% paraformaldehyde. Subsequently, chroma- tin isolation, sonication, and immunoprecipitation using an anti-RNA polymerase II antibody and an anti-H3K4me3 anti- body were performed. The ChIP DNA and input samples were sheared by sonication, end-repaired, ligated to the sequencing adapters, and amplified. The purified ChIP DNA library samples were sequenced using the Illumina Genome Analyzer II (Illumina, Inc., San Diego, CA, USA). Unfiltered sequence reads were aligned to the mouse reference genome [U.S. National Center for Biotechnology Information (NCBI) build 37, mm9] using Bowtie. RNA polymerase II- and H3K4me3-enriched regions were identified using MACS (19) with the default parameters.
Lentiviral enhancer assay
Eleven CRs were PCR amplified from the mouse BAC clone containing the Nppa and Nppb loci (clone RP23-128E8;
BACPAC Resources Center, Children’s Hospital Oakland, Oakland, CA, USA; primers and probes are listed in Supple- mental Table S1). The PCR fragments were subcloned into the pCR-Blunt II-TOPO vector (Invitrogen, Carlsbad, CA, USA) and recombined into a lentiviral vector encoding the firefly luciferase reporter (pGreenFire Transcriptional Re- porter Lentivector; System Biosciences, Mountain View, CA, USA). The lentiviral particles were produced by transfection of 293T cells with the 3 lentiviral packaging plasmids (i.e., pMDLg/pRRE, pRSV-Rev, and pMD2.VSV.G) using Lipo- fectamine 2000 (Invitrogen). The supernatant from 293T cells containing the lentiviral particles was collected 48 h after transfection, sterilized using a 0.45-�-Lm cellulose acetate filter, and concentrated by centrifugation (Peg-it Virus Precipita- tion Solution, System Biosciences).
Rat neonatal cardiomyocytes isolated as described above were plated in 96-well plates. The next day, the medium was replaced with a serum-free medium containing the lentiviral vector, and the cells were incubated for 12 h. Subsequently, the cardiomyocytes were exposed to 100 �-LM PE for 48 h prior to the luciferase assay.
LIVE IMAGING FOR MONITORING THE ENHANCER ACTIVITY 3 RNA extraction and quantitative RT-PCR
The total RNA was prepared from rat cardiomyocytes, rat cardiac fibroblasts, murine hearts, and murine brains using the RNA-Bee RNA isolation reagent (Tel-Test, Friendswood, TX, USA) and then converted to cDNA using the high-capacity cDNA reverse transcription kit (Applied Biosystems, Foster City, CA, USA), according to the manufacturer’s instructions. The quantitative RT-PCR was performed using the TaqMan technol- ogy and the StepOnePlus real-time PCR System (Applied Bio- systems). All samples were processed in duplicate. The level of each transcript was quantified according to the threshold cycle (Ct) method using GAPDH as an internal control. Inventoried TaqMan gene expression assays were used: Nppa, Rn0056661, Mm01255748; Nppb, Rn00580641, Mm01255770; Gapdh, rodent GAPDH control reagent.
3C analysis
The whole hearts of the mice were isolated, perfused rapidly with cold PBS, flash-frozen in liquid nitrogen, homogenized using a sterile tissue grinder, and fixed with 1% paraformal- dehyde. The cross-linked tissues utilized for 3C experiments were subjected to digestion with BamHI following standard protocols (20, 21). The mouse BAC DNA containing Nppa and Nppb (clone RP23-128E8) was used as a control. The TaqMan real-time PCR was performed using probes near the restriction sites; the primers and probes are listed in Supple- mental Table S2.
Transgenic mouse enhancer assay
The candidate enhancer regions were cloned into a vector encoding the minimal CMV promoter driving the luciferase gene as described above. Transgenic mouse embryos were generated by pronuclear injection into the zygotes of BDF1 mice using standard methods. Because black fur attenuates light transmission, albino mice were generated by crossing the transgenic founders to ICR albino mice.
In vivo bioluminescence imaging
Prior to in vivo imaging, the mice were anesthetized using isoflurane, and the black mice were shaved from the neck to the lower torso to allow the optimal visualization of fluores- cence without interference from the black fur. A d-luciferin solution was injected intraperitoneally (150 mg/kg i.p.) or intravenously (75 mg/kg i.v.). The mice were imaged using an in vivo live imaging system (IVIS Lumina II; Caliper Life Sciences, Waltham, MA, USA). For quantification, the biolu- minescence light intensity was measured at the region of interest and expressed in relative light units (RLU/min) using Living Image 4.0 (Caliper Life Sciences). To calculate the enhancer activity in the heart, we defined the ratio of heart to brain luciferase intensities as the cardiac-specific enhancer activity.
Transverse aortic constriction (TAC)
Transgenic mice aged 8 wk and weighing 20 –25 g were subjected to pressure overload, as described previously (22).
Briefly, the chest was entered via the second intercostal space at the upper left sternal border. After the arch of the aorta was isolated, a TAC was created using a 7-0 suture tied twice around a 27-gauge needle and the aortic arch, between the innominate and left common carotid arteries. After the
suture was tied, the needle was gently removed, yielding 60 – 80% constriction of the aorta.
PE-induced hypertrophy
Transgenic mice aged 8 wk and weighing 20 –25 g were treated with PE (75 mg/kg/d) using an osmotic minipump (Alzet, Cupertino, CA, USA) to induce cardiac hypertrophy, as previously reported (23, 24).
Statistical analysis
Data are expressed as means ± se. The 2-tailed Student’s t test and repeated ANOVA were used to analyze differences be- tween the groups. Values of P < 0.05 were considered to represent a significant difference.
RESULTS
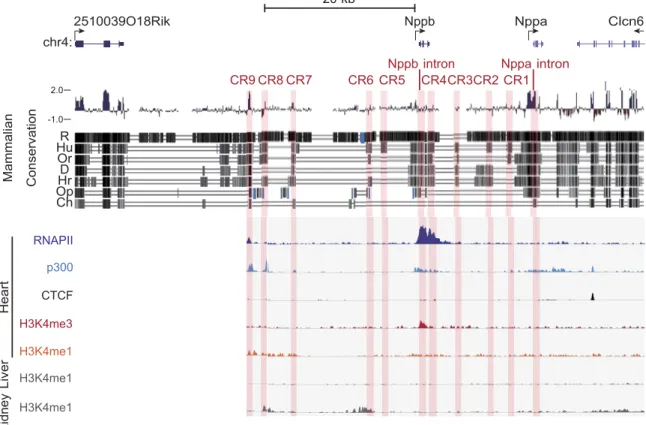
Identification of candidate enhancers near the Nppa- Nppb locus using comparative genomics and ChIP-seq To identify potential enhancers, we performed a com- parative analysis of the genomic sequences of mouse and divergent species and identified CRs that may function as common regulatory sequences (25–27). We defined CRs that were homologous at least in the human and mouse genomes and at least 1 kb away from the transcription start sites of Nppa and Nppb as the candidate enhancers. First, we analyzed the 50-kb Nppa- Nppb locus bounded by the binding sites of 2 CCCTC- binding factors (CTCFs), which can function as insula- tors (28, 29). Using a genome database (30), we identified 11 CRs, including the Nppa and Nppb introns in the 50-kb region (Fig. 1).
Next, we performed a ChIP-seq analysis on RNA polymerase II and H3K4me3 in the adult mouse heart.
We analyzed the epigenetic modifications near the Nppa and Nppb genes combined with the ChIP-seq analysis using a public database of the adult mouse heart (30). We hypothesized that the normal heart would have activated epigenetic marks because Nppa and Nppb are expressed, albeit at low levels, in normal conditions. Recent genome-wide studies have deter- mined that enhancers can be defined as DNA se- quences bound by the RNA polymerase II and tran- scriptional coactivator protein p300, and where histone H3 monomethylated at lysine 4 (H3K4me1) accumu- lates instead of H3K4me3 (31–34). Among the 11 CRs identified, only CR9 coincided with the binding sites of RNA polymerase II and p300, and overlapped with the gene areas modified by H3K4me1, and filled all criteria for the enhancer (Fig. 1). In addition, H3K4me1 modifications in CR9 were only observed in the heart but not in the other organs (Fig. 1 and Supplemental Fig. S1). Therefore, we analyzed the 11 CRs, including CR9, as the most likely distal candidate enhancers for the stress-responsive regulatory regions of the natri- uretic peptide genes.
4 Vol. 28 April 2014 The FASEB Journal · www.fasebj.org MATSUOKA ET AL.
Kidney LiverHeartMammalian Conservation chr4:
2510039O18Rik
20 kb
Nppb Nppa
Nppb intron Nppa intron
Clcn6
2.0
-1.0
Hu R Or D Op Hr Ch
CR9 CR8 CR7 CR6 CR5 CR4CR3CR2 CR1
RNAPII p300 CTCF H3K4me3 H3K4me1 H3K4me1 H3K4me1
Figure 1. Mammalian evolutionarily conserved regions and ChIP-seq data surrounding the murine Nppa and Nppb loci. We used an open database on the University of California Santa Cruz (UCSC) Genome Browser to assess the degree of DNA sequence conservation around Nppa and Nppb gene loci. Blue and red vertical lines, the Placental Mammal Basewise Conservation assessed by PhyloP; black vertical lines, the vertebrate Multiz alignment of DNA sequences among mice and 7 other species (rats, humans, orangutans, dogs, horses, opossums, and chickens). We defined noncoding conserved regions (CRs) that were homologous at least in the human and mouse genomes and at least 1 kb away from the transcription start sites of Nppa and Nppb as the candidate enhancers. CRs are highlighted as light red vertical bars (CR1-9, Nppa intron, and Nppb intron). ChIP-seq data for H3K4me1, p300, and CTCF were obtained from an open database of the adult mouse heart. Some CRs coincided with the peaks for H3K4me1, RNA polymerase II, and the transcriptional coactivator protein p300. R, rat; Hu, human; Or, orangutan;
D, dog; Hr, horse; Op, opossum; Ch, chicken.
Identification of a distal enhancer element responsive to an a1-adrenergic receptor agonist
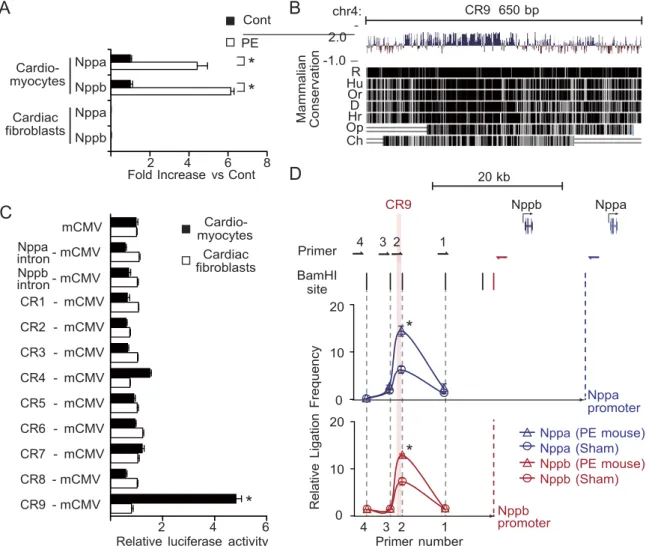
We screened the candidate enhancers for potential stress-responsive regulatory regions. We analyzed the enhancer activity of these 11 CRs after treatment with PE, an a1-adrenergic receptor agonist, which mimics cardiac overload and induces Nppa and Nppb expres- sion in cardiomyocytes (35). We confirmed that PE induced the expression of endogenous Nppa and Nppb specifically in cardiomyocytes but not in cardiac fibro- blasts (Fig. 2A). Then, we introduced the 11 CRs with a minimum human cytomegalovirus (CMV) promoter and the luciferase gene into rat cardiomyocytes using a lentiviral vector system.
Among the 11 CRs tested, only CR9, which is located 22 kb upstream from the Nppb transcription start site and shows high mammalian conservation score in the Placental Mammal Basewise Conservation by PhyloP (Fig. 2B), reproducibly increased the PE-induced lu- ciferase activity by �5-fold compared to the minimal CMV promoter alone (Fig. 2C). However, CR9 did not respond to PE in cardiac fibroblasts (Fig. 2C). These
results suggest that CR9 is the regulatory element that is responsive to PE specifically in cardiomyocytes.
Long-range physical interaction between the distal enhancer element and the proximal promoters of the Nppa and Nppb genes
Confirming the looping interactions between distal elements and promoters is one way to demonstrate the transcriptional regulatory activity of distal elements. We performed a 3C assay (20) to comprehensively investi- gate whether the genomic region containing CR9 moved closer to the Nppa or Nppb promoter in an adult murine heart treated with a continuous infusion of PE in vivo.
The ligation frequencies were quantified by TaqMan real-time PCR using specific primers and probes and were compared to the ligation frequency of noncross- linked BamHI-digested BAC DNA containing the Nppa- Nppb locus. We observed that CR9 interacts with both the Nppa and Nppb promoter regions at a higher frequency relative to other gene areas (Fig. 2D); fur- thermore, PE treatment strengthened these interac-
LIVE IMAGING FOR MONITORING THE ENHANCER ACTIVITY 5
Matsuoka_Figure 2
Mammalian ConservationRelative Ligation Frequency
A B
chr4: CR9 650 bpCont
Cardio- myocytes
Cardiac fibroblasts
C
Nppa Nppb Nppa Nppb
PE
*
*
2 4 6 8 Fold Increase vs Cont
D
2.0 -1.0
Hu R Or D Op Hr Ch
CR9
20 kb
Nppb Nppa mCMV
Nppa - mCMV intron Nppb - mCMV intron
CR1 - mCMV CR2 - mCMV CR3 - mCMV CR4 - mCMV CR5 - mCMV CR6 - mCMV CR7 - mCMV CR8 - mCMV CR9 - mCMV
Cardio- myocytes
Cardiac fibroblasts
*
4 3 2 1 Primer
BamHI site
20
*
10
0 20
*
10
0 Nppb
Nppa promoter Nppa (PE mouse) Nppa (Sham) Nppb (PE mouse) Nppb (Sham)
2 4 6
Relative luciferase activity 4 3 2 1 Primer number
promoter
Figure 2. Identification of a distal enhancer element that is responsive to an a1-adrenergic receptor agonist. A) Relative transcript levels of Nppa and Nppb in rat neonatal cardiomyocytes and cardiac fibroblasts 48 h after treatment with PE (100 �-LM).
Values are means ± se (n=3 cultures). *P < 0.01 vs. control; t test. B) CR9 is a highly conserved genomic region in vertebrates.
C) Relative luciferase reporter activities of CRs in rat neonatal cardiomyocytes and cardiac fibroblasts 48 h after treatment with PE (100 �-LM). PE-induced luciferase activity driven by the mCMV promoter was defined as 1. Values are means ± se (n=5 cultures). *P < 0.001 vs. mCMV alone; t test. D) In vivo 3C analysis of the murine Nppa and Nppb loci, showing relative ligation frequencies of each primer to the Nppa promoter (blue triangle, mouse with PE treatment; blue circle, mouse without PE) and the Nppb promoter (red triangle, mouse with PE treatment; red circle, mouse without PE). Vertical bars and arrows show the positions of BamHI sites and primers. Data were normalized to the amplification value of a BamHI-digested and religated BAC clone, which included the Nppa and Nppb loci (means ± se; n=2 hearts). R, rat; Hu, human; Or, orangutan; D, dog; Hr, horse;
Op, opossum; Ch, chicken. *P < 0.05 vs. control; t test.
tions (Fig. 2D). These results suggest that there is a close proximity between the distal genomic region containing CR9 and the proximal promoters of the Nppa and Nppb genes in the PE-induced hypertrophic heart.
Establishment of an in vivo live imaging system for gene expression in a murine model of heart disease We confirmed the activity of the newly identified en- hancer CR9 in the heart in vivo. The conventional histological evaluation of LacZ reporter expression in the heart only provides data at a single time point;
therefore, this method cannot be employed for kinetic assessments or time course analyses of reporter expres- sion in a live heart.
To overcome this difficulty, we established a nonin-
vasive and quantitative live imaging system that allowed real-time monitoring of the firefly luciferase reporter.
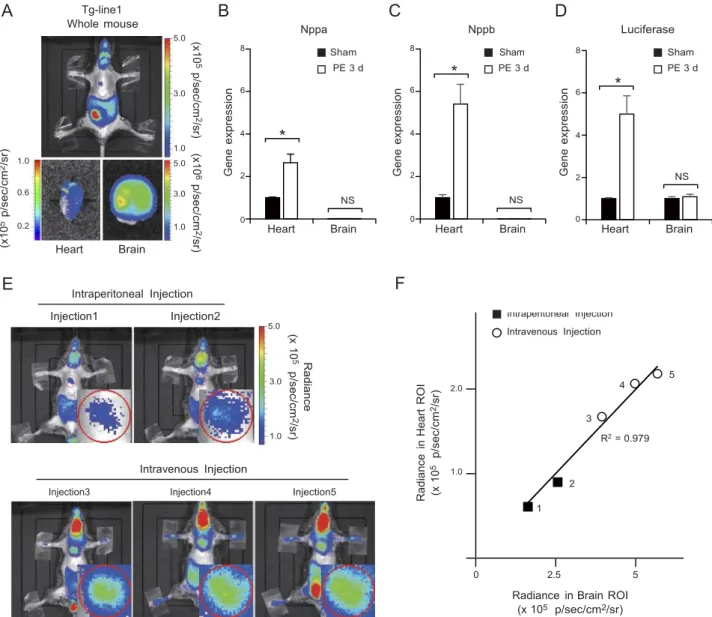
We generated 3 transgenic mouse lines (Tg-line1, Tg- line2, and Tg-line3) in which the CR9 enhancer ele- ment and a minimal CMV promoter driving the lu- ciferase reporter gene were introduced into the germline.
The live-imaging system detected luciferase expression in the heart, brain, and intestine of the Tg-line1 (Fig. 3A), in the heart, salivary glands, and skin of the Tg-line2 (Supplemental Fig. S2A), and in the heart of the Tg-line3 (Supplemental Fig. S2E).
To identify the organs in which CR9 functioned as a stress-responsive enhancer, we examined the luciferase reporter expression in each organ by quantitative PCR.
Continuous infusion of PE increased the blood pres- sure and resulted in cardiac hypertrophy (24, 36). The
6 Vol. 28 April 2014 The FASEB Journal · www.fasebj.org MATSUOKA ET AL.
Intraperitoneal Injection Intravenous Injection
4 5
3
R2 = 0.979
2 1
Radiance(x 105 p/sec/cm2/sr) (x105 p/sec/cm2/sr) (x106 p/sec/cm2/sr)
(x105 p/sec/cm2/sr) Gene expression Gene expression Radiance in Heart ROI (x 105 p/sec/cm2/sr) Gene expression *
A Tg-line1 B C D
Whole mouse
5.0 Nppa Nppb Luciferase
1.0
0.6
3.0
1.0 5.0
3.0
8 Sham
PE 3 d 6
4 *
2
NS 0
8 Sham 8
* PE 3 d
6 6
4 4
2 2
NS
0 0
Sham PE 3 d
NS
0.2
Heart Brain
1.0 Heart Brain Heart Brain Heart Brain
E Intraperitoneal Injection Injection1 Injection2
F
5.0
3.0
1.0
2.0
Intravenous Injection 1.0
Injection3 Injection4 Injection5
0 2.5 5
Radiance in Brain ROI (x 105 p/sec/cm2/sr)
Figure 3. Establishment of an in vivo live imaging system for enhancer activity. A) Chemiluminescence imaging of CR9 in a mouse of Tg-line1. Top panel: result from whole-animal in vivo live imaging. Bottom panels: chemiluminescence images of the heart and brain in the same mouse. B, C) Relative transcript levels of Nppa and Nppb in the ventricular myocardium and brain of CR9 Tg-line1 mice treated with continuous infusion of PE for 3 d. Average transcript level in the ventricular myocardium of preinfused mice was defined as 1 (means ± se; n=5 hearts). *P < 0.01 vs. sham-infused mice; t test. D) Relative transcript levels of luciferase reporter in the ventricular myocardium and brain of the CR9 Tg-line1 mice continuously infused with PE for 3 d.
Average transcript level in the ventricular myocardium and brain of preinfused mice was defined as 1. (means ± se; n=5 hearts).
*P < 0.01 vs. sham-infused mice; t test. E) Comparison of the chemiluminescence intensities obtained using different luciferin injection methods in a Tg-line1 mouse; injections 1 and 2, intraperitoneal injections (top panels), injections 3, 4, and 5, intravenous injections (bottom panels). Injections were performed >4 h apart to eliminate the effect of the previous injection.
Inset in each panel shows a magnified image of the heart. F) Scatterplots of the chemiluminescence intensities in the heart and brain. Plots indicate the independent experiments shown in each panel in E. There is a linear relationship between the expression in the heart and the brain, R2 = 0.979.
expression of endogenous Nppa and Nppb mRNA in- creased 3 d after the PE infusion began (Fig. 3B, C and Supplemental Fig. S2B, C, F, G). Concomitantly, the quantitative PCR analysis of the CR9 luciferase mRNA expression showed enhanced expression in the ventric- ular myocardium 3 d after the PE infusion (Fig. 3D and Supplemental Fig. S2D, H). On the other hand, in the brain and the salivary glands where neither Nppa nor Nppb is highly expressed, the CR9-driven luciferase mRNA expression did not respond to PE (Fig. 3B–D and Supplemental Fig. S2B–D, F–H). Therefore, the
patterns of PE-induced luciferase expression suggest that CR9 is almost exclusively active in the heart.
Because the integration sites were random in these three lines, the patterns of luciferase expression de- pend on CR9 or other enhancers near the integrated sites. The expression of luciferase in the brain of Tg-line1 and salivary glands of Tg-line2, both of which express neither Nppa nor Nppb, might be driven by other enhancers near the integrated sites.
To evaluate the accuracy and reproducibility of this method, we measured the luminescence in the heart of
LIVE IMAGING FOR MONITORING THE ENHANCER ACTIVITY 7
a mouse from Tg-line1. In this transgenic line, the brain, intestine, and testis expressed the reporter pro- tein due to positional effects of the insertion site and most likely not due to CR9 activity. Because the lu- ciferase mRNA expression in the brain remained un- changed after PE treatment (Fig. 3D), we used the reporter activity in the brain as a control. The absolute luminescence values of the heart were affected by the injection method and the amount of luciferase sub- strate injected (Fig. 3E). However, using brain lumines- cence as a control, we successfully eliminated the signal variations caused by these differences. The ratio of the luminescence in the heart and brain remained constant within each mouse, independent of the injection method (Fig. 3F). Therefore, we defined the ratio of heart to brain luciferase intensities as the cardiac- specific enhancer activity.
Distal enhancer element was activated in the murine model of heart failure
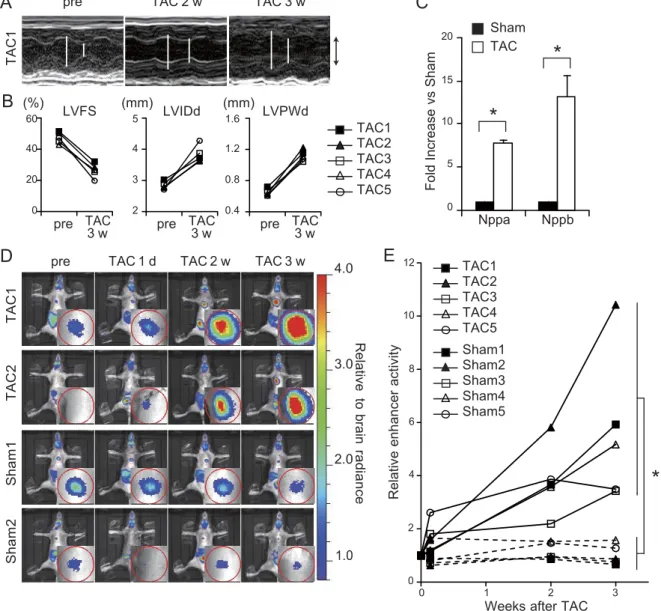
To examine whether the CR9 enhancer was also re- sponsible for gene expression in other pathological conditions, we subjected Tg-line1 mice to heart failure induced by TAC and compared them with sham-sur- gery mice. This model mimics the heart condition of patients with hypertension who suffer a continuous pressure overload on the heart. The pressure overload by TAC caused potent cardiac hypertrophy at 2 wk postsurgery and reduced cardiac contractility at 3 wk postsurgery (Fig. 4A, B), as previously reported (22).
The endogenous Nppa and Nppb expression increased severalfold in the ventricular myocardium 3 wk after the TAC surgery (Fig. 4C). The heart to brain luciferase intensity ratio also increased severalfold 3 wk following the TAC surgery (Fig. 4D, E and Supplemental Fig. S3).
However, the heart to brain luciferase intensity ratio of sham-surgery mice did not change after the surgery (Fig. 4D, E and Supplemental Fig. S3; 3 wk after TAC surgery: 5.7±1.3 fold; 3 wk after sham surgery: 1.0±0.2 fold; P < 0.001, repeated ANOVA). These results suggest that CR9 increases transcriptional activity dur- ing mechanical pressure overload-induced hypertrophy and subsequent heart failure.
DISCUSSION
Here, we focused on the stress-responsive regulatory elements of Nppa and Nppb in heart failure. By screen- ing the evolutionarily conserved and epigenetically modified regions around the Nppa and Nppb gene loci, we identified a 650-bp transcriptional enhancer that was responsive to an a1-adrenergic receptor agonist in vitro. Furthermore, in vivo 3C analysis revealed that this distal enhancer directly interacted with the 5=-flanking regions of both Nppa and Nppb. Using in vivo live imaging of luciferase reporter gene expression, we observed that this 650-bp enhancer caused cardiac- specific activation of reporter gene expression during
the progression of pressure overload-induced heart failure. Notably, this is the first study to provide a time series analysis for monitoring enhancer activity under pathological conditions in an individual live mouse.
Although numerous approaches have been used to explore the stress-responsive regulatory elements driv- ing gene transcription during heart failure (11, 12, 14), these elements have not yet been identified due to the technical difficulty involved. To detect the elements that are responsive to pathological conditions such as heart failure, it is essential to confirm the activity of the responsive element using a beating heart that remains connected to the systemic cardiovascular system. There- fore, it would be beneficial to establish transgenic mouse lines carrying a reporter plasmid to assess the responsive elements driving the expression of specific genes. However, the creation of multiple stable adult mouse lines to identify these elements is time-consum- ing.
In this study, we utilized two improved methods for reporter analysis and successfully identified a novel potent enhancer.
First, by performing an enhancer analysis using a lentiviral vector, we accurately identified candidate enhancers in cardiomyocytes and subsequently gener- ated transgenic reporter mice. Previous promoter anal- yses used electroporation or lipofection to transfect cultured cardiomyocytes with plasmids (37, 38), but the transfection efficiency of these methods in primary cardiomyocytes is too low to accurately measure re- porter activity during the stress response. In this study, greater than 90% transduction efficiency of cardiomy- ocytes was achieved using a lentiviral vector, which enabled us to accurately identify a specific enhancer fragment. Using this method, we efficiently minimized the number of reporter plasmids to be subsequently integrated into the mouse genome to screen for poten- tial enhancers.
Second, by sequentially measuring the enhancer activity in a single live mouse, we collected robust data to assess enhancer activity in the heart in vivo. LacZ is not a suitable reporter for this purpose because LacZ activity can only be assessed after animal euthanization.
Therefore, we overcame this limitation using the lu- ciferase reporter plasmid. Recent advances in high- sensitivity luminescence imaging have made it possible to evaluate enhancer-driven luciferase activity without operating on the mice. Therefore, we sequentially assessed reporter activity and hemodynamic changes in the same mouse throughout the time course of the development of heart failure. These data were highly reproducible and enabled us to identify an enhancer element that was activated by cardiac overload. Because this method can be applied to any organ, the in vivo luciferase reporter assay may be used for assessing the in vivo enhancer or promoter activities responsible for clinically important diseases. The noninvasive nature of this method also enabled us to simultaneously assess the hemodynamic and metabolic parameters in vivo along with reporter activity. Specifically, the Tg-line1
8 Vol. 28 April 2014 The FASEB Journal · www.fasebj.org MATSUOKA ET AL.
Relative to brain radiance
Sham2Sham1TAC2TAC1TAC1 Relative enhancer activity Fold Increase vs Sham
A
pre TAC 2 w TAC 3 wC
20 Sham
TAC
*
15
B
(%)60 40 20 0
LVFS
pre TAC 3 w
(mm)
5 4 3 2
LVIDd
pre TAC 3 w
(mm)
1.6 1.2 0.8 0.4
LVPWd
pre TAC 3 w
TAC1 TAC2 TAC3 TAC4 TAC5
10
*
5
0 Nppa Nppb
D
pre TAC 1 d TAC 2 w TAC 3 w4.0
3.0
2.0
E
1210
8
6
4
TAC1 TAC2 TAC3 TAC4 TAC5 Sham1 Sham2 Sham3 Sham4 Sham5
*
2
1.0
0
0 1 2 3
Weeks after TAC
Figure 4. Distal enhancer element is reactivated in the murine model of heart failure. A) Representative M-mode echocardiograms in a mouse of Tg-line1 (TAC1) before and after TAC. Open bars indicate maximal left ventricular internal dimension in diastole (LVIDd) and maximal left ventricular internal dimension in systole (LVIDs). Up and down arrows represent 3 mm. B) Echocardiographic changes in left ventricular fractional shortening (LVFS), LVIDd, and left ventricular posterior wall thickness in diastole (LVPWd) in 5 mice of Tg-line1 (TAC1-5) before and after TAC. C) Relative Nppa and Nppb transcript levels in the ventricular myocardium 3 wk after the TAC procedure (means ± se; n=3 hearts). *P < 0.05 vs.
sham-surgery mice; t test. D) Sequential in vivo live imaging of 4 representative Tg-line1 mice before and after TAC or sham surgery at each time point. Top 2 and bottom 2 panels represent sequential imaging data of TAC and sham-surgery mice, respectively. Sequential imaging of the 6 other surgically treated mice is shown in Supplemental Fig. S3. Insets in images show magnified images of the heart. Color scale depends on the ratio relative to brain intensity. E) Cardiac-specific enhancer activity plots of 10 Tg-line1 mice (TAC1, TAC2, and Sham1, Sham2, shown in D) and TAC3–5 and Sham3–5 shown in Supplemental Fig. S3). Heart to brain luciferase intensity ratio represents the cardiac-specific enhancer activity; enhancer activity in presurgery mice was defined as 1. 3 wk after TAC surgery: 5.7 ± 1.3 fold; 3 wk after sham surgery: 1.0 ± 0.2 fold; means ± se; n = 5.
*P < 0.001, repeated ANOVA.
mice enabled us to accurately quantify the expression level of the natriuretic peptides. These mice are useful tools for repeatedly assessing the degree of heart failure to screen various cardiovascular drugs.
The integration of activities from multiple enhancers could confer specificity and robustness to transcrip- tional regulation (1). Warren et al. (14) identified the Nppa enhancer in the embryonic heart by examining Nkx2-5 binding regions around the Nppa locus, but the
enhancer did not respond to heart failure. This en- hancer does not overlap with CR9 and might regulate Nppa expression only during the embryonic stage (14).
On the other hand, Horsthuis et al. (11) showed that the regulatory region from -27 to +58 kb relative to the transcription start site of Nppa was sufficient for Nppa gene expression in the failing heart, similar to CR9. However, because this 85-kb regulatory region does not include CR9, Nppa may have multiple enhanc-
LIVE IMAGING FOR MONITORING THE ENHANCER ACTIVITY 9
ers that regulate its expression during heart failure.
Furthermore, the length of the 85-kb region poses a challenge for understanding its specific biological role.
This is the first study to provide a time course imaging analysis of enhancer activity using an individ- ual live diseased mouse model. Using this new method, we identified a novel heart enhancer. This method can be widely used for identifying enhancers that regulate transcriptional activity only under patholog- ical conditions.
This research was supported by the Japan Society for the Promotion of Science (JSPS) through the Funding Program for Next Generation World-Leading Researchers (NEXT Pro- gram), which was initiated by the Council for Science and Technology Policy (CSTP); grants-in-aid from the Ministry of Health, Labor, and Welfare of Japan; grants-in-aid from the Ministry of Education, Culture, Sports, Science, and Technol- ogy of Japan; and grants-in-aid from the Japan Society for the Promotion of Science. This research was also supported by grants from the Japan Heart Foundation, the Japan Cardio- vascular Research Foundation, the Japan Medical Association, the Japan Intractable Diseases Research Foundation, the Uehara Memorial Foundation, the Takeda Science Founda- tion, the Ichiro Kanehara Foundation, the Inoue Foundation for Science, the Mochida Memorial Foundation, a Heart Foundation/Novartis Grant for Research Award on Molecu- lar and Cellular Cardiology, the Japan Foundation of Applied Enzymology, the Naito Foundation, the Banyu Foundation, and Showa Houkoukai. The authors thank Hiroshi Kimura for antibodies, Seitaro Nomura for the ChIP-seq analysis, Saori Ikezawa and Eri Takata for technical assistance, and Yuko Okada and Hiromi Fujii for secretarial support.
REFERENCES
1. Spitz, F., and Furlong, E. E. (2012) Transcription factors: from enhancer binding to developmental control. Nat. Rev. Genet. 13, 613–626
2. Chien, K. R., Domian, I. J., and Parker, K. K. (2008) Cardiogen- esis and the complex biology of regenerative cardiovascu- lar medicine. Science 322, 1494 –1497
3. Olson, E. N. (2006) Gene regulatory networks in the evolution and development of the heart. Science 313, 1922–1927
4. Burley, D. S., and Baxter, G. F. (2007) B-type natriuretic peptide at early reperfusion limits infarct size in the rat isolated heart.
Basic Res. Cardiol. 102, 529 –541
5. Holtwick, R., van Eickels, M., Skryabin, B. V., Baba, H. A., Bubikat, A., Begrow, F., Schneider, M. D., Garbers, D. L., and Kuhn, M. (2003) Pressure-independent cardiac hypertrophy in mice with cardiomyocyte-restricted inactivation of the atrial natriuretic peptide receptor guanylyl cyclase-A. J. Clin. Invest.
111, 1399 –1407
6. Kitakaze, M., Asakura, M., Kim, J., Shintani, Y., Asanuma, H., Hamasaki, T., Seguchi, O., Myoishi, M., Minamino, T., Ohara, T., Nagai, Y., Nanto, S., Watanabe, K., Fukuzawa, S., Hirayama, A., Nakamura, N., Kimura, K., Fujii, K., Ishihara, M., Saito, Y., Tomoike, H., and Kitamura, S. (2007) Human atrial natriuretic peptide and nicorandil as adjuncts to reperfusion treatment for acute myocardial infarction (J-WIND): two randomised trials.
Lancet 370, 1483–1493
7. Li, P., Wang, D., Lucas, J., Oparil, S., Xing, D., Cao, X., Novak, L., Renfrow, M. B., and Chen, Y. F. (2008) Atrial natriuretic peptide inhibits transforming growth factor beta-induced Smad signaling and myofibroblast transformation in mouse cardiac fi- broblasts. Circ. Res. 102, 185–192
8. Tamura, N., Ogawa, Y., Chusho, H., Nakamura, K., Nakao, K., Suda, M., Kasahara, M., Hashimoto, R., Katsuura, G., Mu- koyama, M., Itoh, H., Saito, Y., Tanaka, I., Otani, H., and
Katsuki, M. (2000) Cardiac fibrosis in mice lacking brain natriuretic peptide. Proc. Natl. Acad. Sci. U. S. A. 97, 4239 –4244 9. De Lange, F. J., Moorman, A. F., and Christoffels, V. M. (2003)
Atrial cardiomyocyte-specific expression of Cre recombinase driven by an Nppa gene fragment. Genesis 37, 1–4
10. Habets, P. E., Moorman, A. F., Clout, D. E., van Roon, M. A., Lingbeek, M., van Lohuizen, M., Campione, M., and Christof- fels, V. M. (2002) Cooperative action of Tbx2 and Nkx2.5 inhibits ANF expression in the atrioventricular canal: implica- tions for cardiac chamber formation. Genes Dev. 16, 1234 –1246 11. Horsthuis, T., Houweling, A. C., Habets, P. E., de Lange, F. J., el
Azzouzi, H., Clout, D. E., Moorman, A. F., and Christoffels, V. M.
(2008) Distinct regulation of developmental and heart disease- induced atrial natriuretic factor expression by two separate distal sequences. Circ. Res. 102, 849 –859
12. Knowlton, K. U., Rockman, H. A., Itani, M., Vovan, A., Seidman, C. E., and Chien, K. R. (1995) Divergent pathways mediate the induction of ANF transgenes in neonatal and hypertrophic ventricular myocardium. J. Clin. Invest. 96, 1311–1318
13. Small, E. M., and Krieg, P. A. (2003) Transgenic analysis of the atrialnatriuretic factor (ANF) promoter: Nkx2-5 and GATA-4 binding sites are required for atrial specific expression of ANF.
Dev. Biol. 261, 116 –131
14. Warren, S. A., Terada, R., Briggs, L. E., Cole-Jeffrey, C. T., Chien, W. M., Seki, T., Weinberg, E. O., Yang, T. P., Chin, M. T., Bungert, J., and Kasahara, H. (2011) Differential role of Nkx2-5 in activation of the atrial natriuretic factor gene in the develop- ing versus failing heart. Mol. Cell. Biol. 31, 4633–4645
15. Simpson, P., McGrath, A., and Savion, S. (1982) Myocyte hypertrophy in neonatal rat heart cultures and its regulation by serum and by catecholamines. Circ. Res. 51, 787–801
16. Siepel, A., Bejerano, G., Pedersen, J. S., Hinrichs, A. S., Hou, M., Rosenbloom, K., Clawson, H., Spieth, J., Hillier, L. W., Richards, S., Weinstock, G. M., Wilson, R. K., Gibbs, R. A., Kent, W. J., Miller, W., and Haussler, D. (2005) Evolutionarily conserved elements in vertebrate, insect, worm, and yeast genomes. Genome Res. 15, 1034 –1050
17. Blanchette, M., Kent, W. J., Riemer, C., Elnitski, L., Smit, A. F., Roskin, K. M., Baertsch, R., Rosenbloom, K., Clawson, H., Green, E. D., Haussler, D., and Miller, W. (2004) Aligning multiple genomic sequences with the threaded blockset aligner.
Genome Res. 14, 708 –715
18. Pollard, K. S., Hubisz, M. J., Rosenbloom, K. R., and Siepel, A.
(2010) Detection of nonneutral substitution rates on mamma- lian phylogenies. Genome Res. 20, 110 –121
19. Zhang, Y., Liu, T., Meyer, C. A., Eeckhoute, J., Johnson, D. S., Bernstein, B. E., Nusbaum, C., Myers, R. M., Brown, M., Li, W., and Liu, X. S. (2008) Model-based analysis of ChIP-Seq (MACS).
Genome Biol. 9, R137
20. Dekker, J., Rippe, K., Dekker, M., and Kleckner, N. (2002) Capturing chromosome conformation. Science 295, 1306 –1311 21. Hagege, H., Klous, P., Braem, C., Splinter, E., Dekker, J.,
Cathala, G., de Laat, W., and Forne, T. (2007) Quantitative analysis of chromosome conformation capture assays (3C- qPCR). Nat. Protoc. 2, 1722–1733
22. Liao, Y., Ishikura, F., Beppu, S., Asakura, M., Takashima, S., Asanuma, H., Sanada, S., Kim, J., Ogita, H., Kuzuya, T., Node, K., Kitakaze, M., and Hori, M. (2002) Echocardiographic assess- ment of LV hypertrophy and function in aortic-banded mice:
necropsy validation. Am. J. Physiol. Heart Circ. Physiol. 282, H1703–H1708
23. Saadane, N., Alpert, L., and Chalifour, L. E. (1999) Expression of immediate early genes, GATA-4, and Nkx-2.5 in adrenergic- induced cardiac hypertrophy and during regression in adult mice. Brit. J. Pharmacol. 127, 1165–1176
24. Vecchione, C., Fratta, L., Rizzoni, D., Notte, A., Poulet, R., Porteri, E., Frati, G., Guelfi, D., Trimarco, V., Mulvany, M. J., Agabiti-Rosei, E., Trimarco, B., Cotecchia, S., and Lembo, G.
(2002) Cardiovascular influences of a1j3-adrenergic receptor defect in mice. Circulation 105, 1700 –1707
25. Nobrega, M. A., Ovcharenko, I., Afzal, V., and Rubin, E. M.
(2003) Scanning human gene deserts for long-range enhancers.
Science 302, 413
26. Thomas, J. W., Touchman, J. W., Blakesley, R. W., Bouffard, G. G., Beckstrom-Sternberg, S. M., Margulies, E. H., Blanchette, M., Siepel, A. C., Thomas, P. J., McDowell, J. C., Maskeri, B., Hansen, N. F., Schwartz, M. S., Weber, R. J., Kent, W. J.,