Building Datasets of Aerial Videos Using Drone and Extending Datasets with Logistic Map
Ryuta Yoshimura, Yoko Uwate and Yoshifumi Nishio Dept. of Electrical and Electronic Eng., Tokushima University
2-1 Minami-Josanjima, Tokushima 770–8506, Japan Email: { nakashima, uwate, nishio } @ee.tokushima-u.ac.jp
Abstract—The drone is noticed that it is possible to acquire the
disaster situation in detail and promptly when natural disasters occur. The drone is easy to deploy in case of disasters and the cost of pilot development can be reduced. At this stage, the rescuer is searching for rescuee through a drone camera manually.
We aim to develop the automated discovery system using CNN, so we constructed the data set which is necessary for learning of CNN. In addition, our method for extending the dataset is to add chaotic noise to the learning data.
I. I
NTRODUCTIONThe drone is noticed that it is possible to acquire the disaster situation in detail and promptly when natural disasters occur. Last year, 124 people were rescued by drone, such as the discovery of the victims left behind in the hill, river and mountainous areas. In June, 2018, Police in the United Kingdom used a drone with a thermal imaging camera to find a semi-conscious man at the edge of a cliff. Further, the case of a car crash in rural Lincolnshire proved the usefulness of the drone rescue. Police arrived on the accident scene after dark, however it was unable to find the driver. They used a drone equipped with a thermal imaging camera and found him unconscious in the groove. In the past year, the drone with thermal imaging cameras saved the lives of at least 15 victims hidden from the emergency team’s vision due to darkness and obstacles. It is also able to find in burn buildings and disaster zones to find people hiding in smoke and dust. As search and rescue teams and firefighters continue to accept drone with a thermal camera, the number is expected to increase over the next few years [1].
The rescuer currently is searching for rescuee through a drone camera manually. We aim to develop the automated discovery system using convolutional neural network (CNN), so we constructed the data set which is necessary for learning of CNN. First, we obtain data by using drone. Second, we extend data to add chaotic noise to. Finally, we investigate recognition accuracy with dataset we make with noise.
II. N
EURALN
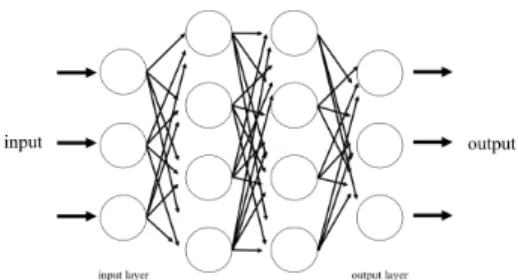
ETWORKFigure 1 shows the construction of neural network. The information moves from the input nodes, through the hidden nodes and to the output nodes. The most simplest neural network is a single-layer perceptron network, and the network consists of a single layer of output nodes. The sum of the products of the weights and the inputs is calculated in each
Fig. 1.
Feedforward Neural Network.
node, and if the value is above some threshold the neuron fires. Deep learning is a multilayered structured neural network modeled on human and animal cranial nerve circuits. Deep learning is a type of machine learning model, and in this model you learn a classification method directly from images, movies, texts and sounds. CNN is one of the most common algorithm in deep learning. CNN is particularly good at finding patterns in images and recognizing objects, faces, and scenes.
By learning directly from image data using image classifica- tion by pattern, extraction of features by hand is unnecessary.
Along with the progress of GPU and parallel computing, CNN has become a key technology for new development in the field of automatic driving and face recognition. Applications that require object recognition and computer vision, such as automated driving vehicles and face recognition applications, rely heavily on CNN. CNN is used to confirm thousands of pathological reports and visual cancer cells I am finding it.
CNN has also been adopted for automatic driving vehicles and is used for object exploration and learning to distinguish between pedestrians and road signs [2]-[4].
III. P
ROPOSED METHODFirst, we describe the data collection for data set construc- tion. We obtained videos by letting the drones pass over the sky of the five targets. After that, we cut out the videos into a frame image using OpenCV, and excluded the images in which the targets were not shown. We divided one-third of the obtained images for testing and others for learning.
Figure 2 shows the some of the images we obtained using drone. There is a man who wears different color shirt which are black, blue, white, yellow, white in the image. Finally, we obtained 198 images for learning.
- 1 -
IEEE Workshop on Nonlinear Circuit Networks December 7-8, 2018
(a) (b)
(c) (d)
(e)
Fig. 2.
(a) wearing black shirt, (b) wearing blue shirt, (c) wearing white shirt, (d) wearing yellow shirt, (e) wearing red shirt
Next, we added salt and pepper noise to increase the data.
The probability of applying noise to each image is the output of the logistic map. It is known that random noise with a uniform probability distribution is used. However, using this noise due to non-uniform output of this probability distribution increases the robustness of the network and improves the learning system expect. For that reason, noise caused by the logistic map is used. The logistic map behaves like various chaos depending on the parameters. The proposed method of this research is to generate noise with nonuniform frequency distribution and use this chaos. The formula of the logistic map is as follows.
x
n+1= ax
n(1 − x
n) (1) n means the number of steps. When x
nis determined, the next value x
n+1is uniquely determined. Similar to x
nand x
n+1, there is continuity also in images extracted from moving images, so we expect each image to be affected by the dynamics of this noise. If the value of the map outputs 0 to 1, it is set to 0 to 100%
Fig. 3.
Bifurcation diagram of logistic map.
Figure 3 shows vary complicated behavior when the param-
eter value of the logistic map is changed. The logistic map is a logarithmic map in which the change in the value depends on what value is given to the parameter a, converging to a constant value, cyclically repeating multiple values Vibrations, non- periodic and extremely complicated behavior called chaos..
We set the values of a = 4.0 and a = 3.828327 in this study.
When a = 4.0, it shows a behavior close to a random number called pure chaos.
Fig. 4.
Logistic map at the time when a = 3.828327.
Figure 4 shows a behavior of intermittency chaos which is switching between laminar part and burst part. The time range in which x
nis causing irregular behavior and the time range in which periodic behavior of three cycles are occurring alternately. Laminar means the periodic state and burst means the chaotic state. When we determine the parameter a = 3.828327, the logistic map shows intermittency chaos [5]-[6].
TABLE I
T
HE PARAMETERS AND THE NUMBER OF IMAGES OF THE LEARNING DATASET.
Parameter Number of images
I. basic(without noise) 198
II. a=4.0 396
III. a=3.828327 396
IV. a=4.0, a=3.828327 594
V. a=4.0(contained) 396
VI. a=3.828327(contained) 396 VII. a=4.0, a=3.828327(contained) 594
Table 1 shows the parameters and the number of images of the learning data used in this study. IV and VII are made to learn two types simultaneously with noise added by each parameter. V, VI, VII contain the noise application rate from 0 to 10 percent. We practiced the above-mentioned seven types of noise application, we obtained the number of images as shown in Table 1. We obtained 396 pictures for II, III, IV and VI and 594 pictures for IV and VII.
Figure 5 shows one of the images added noise to. As you can see, (a) and (b) are more dense noise than (c) and (d).
The reason for this is that the ratio of noise applied to c and d is contained in 0 to 10 percent.
- 2 -
(a) (b)
(c) (d)
Fig. 5.
One of images due to (a) noise of II, (b) noise of III, (c) noise of V, (d) noise of VI
(a) Location (b) Drone
Fig. 6.
(a) Sakura Park, Naka, Tokushima (b) holystone HS200
【
hs200Wr
】Figure 6 shows the location at the time of data collection and photographing equipment. We obtained videos in Sakura Park, Naka-cho, Tokushima-city, Tokushima-Prefecture. The weather at that time was cloudy. We used the drone which is HS200 from Holystone as a photographic equipment.
IV. C
ONVOLUTIONAL NEURAL NETWORKIn this research, we used a convolutional neural network (CNN) widely used for image and video recognition. The CNN consists of dozens of layers, each layer learning to detect different features of one image. For each learning image, multiple filters with different resolutions are applied and the output of each convolution image is used as input to the next layer. Filters begin with the detection of very simple features such as brightness and edges and increase the level of complexity of features that uniquely define objects.
As with other neural networks, CNN consists of an input layer, an output layer, and many hidden layers in between, each layer learning features unique to the data. CNN is generally composed of convolutional layers and a pooling layer, fully connected layers. The convolution layer and the pooling layer are feature amount extraction parts that read images and create feature maps.
The pooling layer performs nonlinear down sampling to simplify the output while also reducing the number of pa- rameters required to learn the network. These processes are repeated for dozens or hundreds of layers, learning is done so that each layer distinguishes different features. The fully
connected layer is the identification part that obtains the final output by repeating the calculation.
In addition to the above, the important structure is the softmax function. Since the output of the neural network can take an arbitrary numerical value, it must be converted to a probability (a value of 0.0 to 1.0). The softmax function real- izes faster and more efficient learning by mapping a negative value to zero and holding a positive value. This process is also called activation, because only activated features are sent to the next layer. The softmax function is useful in that case. The softmax function is defined as follows.
p
i= exp(y
i)
∑
Cj=1
exp(y
j) (2) p
iis the probability of becoming class i, y is the output of the neural network, and C is the total number of discriminant classes. exp is an exponential function. In this study, the total number of discriminant classes is 5, so C is 5. For all classification classes i, p satisfies 0 ≤ p ≤ 1 and the sum is 1.
CNN identifies and classifies features of images, letters, sounds, and movies. In this study, CNN extracts features by convolution and pooling of the imported image and acquires final output at full connected layer to recognize it.
Figure 7 shows the structure of CNN in this study. This model consists of an input layer, two convolution layers, two pooling layers, two full connected layers and an output layer.
Fig. 7.
Flow of learning by CNN.
V. S
IMULATION RESULTSWe investigated learning accuracy by learning these data with CNN and how noise influences learning accuracy. The number of learning is 1000 times. Table 2 shows learning accuracy with various parameters.
TABLE II
L
EARNING ACCURACY.
step=100 step=200 step=500 step=1000
I 0.3080 0.6515 0.7525 0.7626
II 0.3333 0.6136 0.8712 0.8863
III 0.4154 0.6497 0.8550 0.8623
IV 0.3280 0.5946 0.8186 0.8517
V 0.5346 0.8448 0.9809 0.9880
VI 0.5580 0.9362 0.984 0.9886
VII 0.5969 0.9121 1.0000 1.0000
The learning accuracy improves as the number of times of learning increases. When the number of steps is 200, VI is the
- 3 -
highest training accuracy, and VII is the best after 500 steps.
As VII converges to 1, it is a possibility of over learning.
VI. C
ONCLUSIONSWe did not do left/right flipping, zooming, shrinking, and rotation of the image, which is said to be a general way to extend the number of images at this time. Instead, we extended the dataset by adding noise to the image. As a result, the learning accuracy was successfully improved by increasing the number of images. Learning accuracy was improved by increasing the number of data due to adding noise. However, when some of results in learning accuracy converge to 1, it may be over learning.
In the future, we will investigate the generalization ability and judge the existence of over-learning. We will also inves- tigate other parameters and salt and pepper noise. Also, in considering the results, it is difficult to investigate which image data was useful for accuracy. This is because it depends on the structure of CNN that we do not know which feature of image the inference results were made. In order to build a more robust data set in the future, we will collect more data and build a data set that extended them and learn it.
R
EFERENCES[1] The DJI policy & Legal affairs Department, https://bit.ly/2HC5f7C,
“More Lives Saved: A Year Of Drone Rescues Around The World, [2] M. Masakazu, K. Mori, Y Mitari and Y. Kaneda, “Subject independent
facial expression recognition with robust face detection using a con- volutional neural network, Neural Networks 16., vol.5, pp.555–559, 2003.
[3] P. Tahmasebi and A. Hezarkhani, “Application of a Modular Feed- forward Neural Network for Grade Estimation,” Natural Resources Research 20., vol.1, pp.25–32, 2011.
[4] Y. Pomeau and P. Manneville, “Intermittent Transition to Turbulence in Dissipative Dynamical Systems,” Comm. Math. Phys., vol.74, pp.189- 197, 1980.
[5] K. Kaneko, “Spatiotemporal Intermittency in Coupled Map Lattice,”
Prog. Theor. Phys., vol.75, no.5, pp.1033-1044, 1985.
[6] Y. Fujisawa, K. Ago, Y. Uwate and Y. Nishio, “Intermittency Chaos of Two Coupled Maps with Delay Coupling,” Proceedings of RISP International Workshop on Nonlinear Circuits, Communications and Signal Processing (NCSP’16), pp. 459-462, Hawaii, Mar. 2016.