【原著・臨床】
抗菌薬および手指消毒薬使用量と MRSA 分離率の検討
小西 寿子1)・後藤亜江子2)・平井 由児3)・相野田祐介3)
藤田 崇宏3)・木村 利美1)・戸塚 恭一3)
1)東京女子医科大学病院薬剤部*
2)同 中央検査部細菌検査室
3)東京女子医科大学感染対策部感染症科
(平成24年10月22日受付・平成25年2月1日受理)
JANISの報告によれば,日本のStaphylococcus aureusにおけるMRSAの割合(MRSA分離率)は2004
年67%,2011年55% であり,近年減少傾向にあるが依然として高い。抗菌薬と手指消毒薬の使用動向
がMRSA分離率にどのように影響しているか,2004年4月から2012年3月の入院患者を対象とし関連 性を検討した。
2004年度から2011年度の総検体中のMRSA分離率は43.5%→31.9%,血液培養検体中は60.6%→
40.6% と減少した。MRSA分離率低下と抗菌薬使用量(AUD)においてr=0.8以上のきわめて強い相関
を示したのは,第1世代セファロスポリン系(r=−0.90,−0.99;総検体,血液),ペニシリン系(r=−0.87,
−0.82),グリコペプチド系(r=−0.84,−0.86)の使用量増加および第2世代セファロスポリン系(r=
0.85,0.91)の減少であり,擦式消毒用アルコール(r=−0.77,−0.89)の増加も相関が認められた。
バンコマイシンとともにMRSA分離率増加の危険因子である第3世代セファロスポリン系の使用量 増加も認められたが,全AUDに占める割合は10% 程度と低く,相対的使用量が少なければMRSA増加 要因とならないことが考えられた。また,第1世代セファロスポリン系,ペニシリン系の使用量が増加 し全AUDに占める割合が60% を超えていたことがMRSA分離率低下との関連を示唆していた。擦式 消毒用アルコールの使用量増加とMRSA分離率低下は他施設でも報告され,院内教育による手指衛生の 向上や経路別感染対策表示などが,水平伝播を抑え,新規MRSA患者の減少につながったと思われる。
低いMRSA分離率の維持には,ICTを中心とした病院全体における包括的な抗菌薬適正使用管理・感 染対策を継続していくことが重要と考える。
Key words: MRSA,antimicrobial use density (AUD),alcohol-based hand-rub,antimicrobial stewardship,ICT
院 内 感 染 の 重 要 な 原 因 菌 と し て 知 ら れ るmethicillin- resistantStaphylococcus aureus(MRSA)はβ―ラクタム系薬な ど多くの抗菌薬に耐性であり,MRSA感染症は世界各国で問 題となっている。MRSAのS. aureusに対する割合(以下,
MRSA分離率)は国ごとに異なっており1),厚生労働省院内感 染対策サーベイランス事業(JANIS)による日本のMRSA 分離率調査では2003年〜2004年は67%,2010年58%,2011
年55% である2)。近年,一部の施設で53.8% に低下したとい
う報告もあり,減少傾向ではあるが依然として高い3)。MRSA の菌血症は死亡率も高く4,5),治療に難渋することもあるため,
適切な抗菌薬投与や管理,MRSA感染対策が重要であるとさ れている。MRSA分離率やMRSA感染症の発症減少には,感 染対策チーム(以下,ICT)の介入や擦式消毒用アルコールに よる手指衛生,抗菌薬の使用制限等が重要であることが報告
されている6〜12)。また,MRSAが蔓延した背景には第3世代 セ フ ァ ロ ス ポ リ ン 系 薬 と キ ノ ロ ン 系 薬 の 関 連 が 示 唆 さ れ10,11,13〜15),MRSA分離率の調査には水平感染に加え抗菌薬の 選択圧1)の影響も検討する必要がある。
東京女子医科大学病院においても2006年度からカルバペ ネム系薬の届出制を契機にICTによるラウンドやリンクド クターを中心とした抗菌薬適正使用を推進し,1996年からの 手指消毒の講習,2008年からの年2回の院内感染対策講習会 の実施などさまざまな感染対策介入等を行ってきた。近年 MRSA分離率が減少してきたため, 感染対策とのかかわり,
抗菌薬と手指消毒薬の使用実態等がどのようにMRSA分離 率に影響しているのか関連性を検討した。
*東京都新宿区河田町8―1
I. 材 料 と 方 法 1.調査項目および実施期間
2004年4月〜2012年3月までの当院(1,432床)の入院 患者における下記項目①〜⑦を調査した。
①入院患者の総在院日数(bed days):厚生労働省の厚 生統計用の計算式を用いた院内医療統計データを活用し た。②全細菌検査検体(血液・痰・膿・尿・便の培養;
以下,全検体)数,血液培養検査検体(以下,血培検体)
数:細菌検査室へ提出された入院患者の検体数をもとに 算出した。③全検体中のMRSA・methicillin-susceptible Staphylococcus aureus(MSSA)の 各 分 離 株 数 とMRSA 分離率(%),④血培検体中のMRSA・MSSAの各分離株 数とMRSA分離率(%)は,院内細菌検査室においてMi- cro ScanⓇWalk AwayⓇ-96 si(シーメンス)を用いて,菌 名を同定し,微量液体希釈法により,オキサシリンの最 小発育阻止濃度(MIC)が4μg!mL以上をMRSAとし た。⑤各年度のMRSA新規分離 患 者 数:入 院 早 期 に MRSAが分離された患者を含めすべての入院患者にお いてMRSAが新規に分離された患者とした。⑥各抗菌薬
〔β―ラクタム系薬・フルオロキノロン系薬・グリコペプ チ ド 系 薬〕の 使 用 量(Antimicrobial Usage Density:
AUD):薬剤部からの出納データを使用量として用い た。⑦擦式消毒用アルコールの規格別使用量(60 mL,350 mL,1 L):薬剤部からの出納データを使用量として用 い,リットル換算した。
・ただし,③〜⑤において重複患者,重複株は除外した。
・AUDはAnatomical Therapeutic Chemical!Defined Daily Dose(ATC!DDD)システムにより,以下の式 で算出した。
抗菌薬使用量(g)×100 AUD=DDD(g)*1×入院患者の総在院日数
*1;DDD(Defined Daily Dose)はWHOのATC!DDD index(http:!!www.whocc.no!atcddd!)から引用し た。
2.統計解析
統計解析にはStatview5.0(SASコーポレーション)を 用い,p<0.05を統計学的に有意と判定した。
・全検体中および血培検体中のMRSA分離率(%)と系 統別抗菌薬AUDとの相関分析ならびにMRSA分離 率を従属変数,各系統別抗菌薬AUDを独立変数とし たステップワイズ法による重回帰分析を行った。各系 統別抗菌薬は,β―ラクタム系薬(第1世代・2世代・3 世代・4世代セファロスポリン系,オキサセフェム系,
カルバペネム系),フルオロキノロン系薬,グリコペプ チド系薬について実施した。
・全検体中および血培検体中のMRSA分離率(%)と 個々の抗菌薬,擦式消毒用アルコール使用量(L)との 相 関 分 析 を 行 っ た。個 々 の 抗 菌 薬 はpenicillin G
(PCG),sulbactam!ampicillin(SBT!ABPC),tazobac- tam!piperacillin(TAZ!PIPC)+piperacillin(PIPC),
cefazolin(CEZ),cefotiam(CTM),cefmetazole
(CMZ),ceftazidime(CAZ),ceftriaxone(CTRX),
cefotaxime(CTX),sulbactam!cefoperazone(SBT! CPZ),cefpirome(CPR),cefepime(CFPM),cefo- zopran(CZOP),latamoxef(LMOX),flomoxef
(FMOX),meropenem(MEPM),imipenem!cilasta- tin(IPM!CS),panipenem!betamipron(PAPM!BP),
biapenem(BIPM),doripenem(DRPM),ciproflox- acin(CPFX),pazufloxacin(PZFX),vancomycin
(VCM),teicoplanin(TEIC)について実施した。
II. 結 果
1.細菌検査全検体数と総在院日数
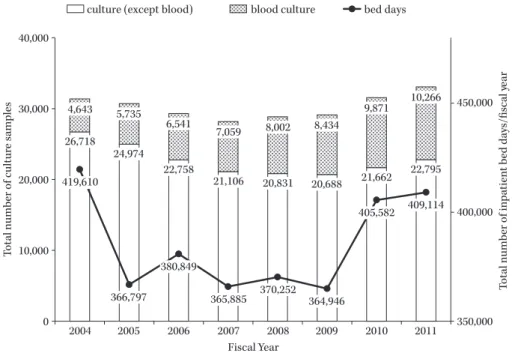
全検体数における血培検体数とそれ以外の検体数の内 訳をFig. 1に示した。全検体数は2007年度まで減少し,
以降増加した。血培検体数は漸増した。
総在院日数は2004年度から2005年度にかけて減少し たが,2005年度から2009年度は大きな変動はなく,2010 年度以降増加した(Fig. 1)。
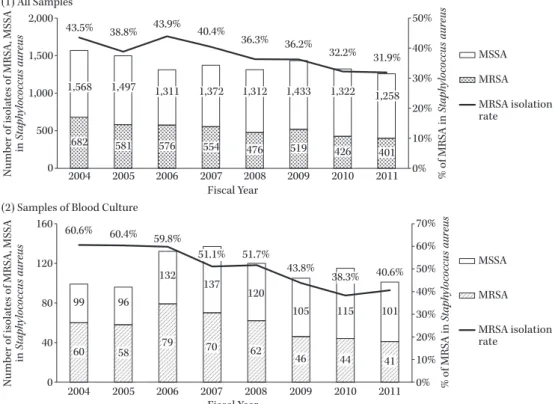
2.MRSA・MSSA分離株数と分離率(Fig. 2)
全検体中のS. aureusの分離株総数の推移は2004年度 1,568株から2011年度1,258株まで減少した。
全検体中のMRSA分離率は2006年度の43.9% より 減少傾向を示し,2011年度には31.9% であった。
血培検体中のMRSA分離率は2004年度60.6% から 減少傾向を示し,2011年度40.6% で20% の減少が認め られた。
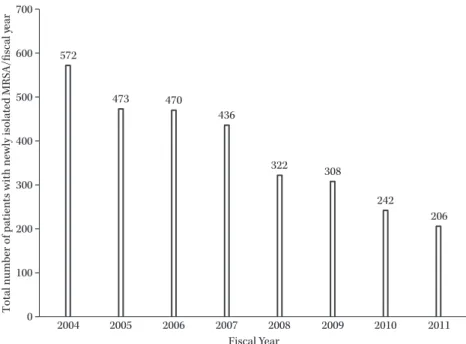
3.各年度のMRSA新規分離患者数
年間のMRSA新規分離患者数は2004年度の572人か ら2011年度の206人へと減少した(Fig. 3)。
4.抗菌薬使用量(AUD)の年度推移
β―ラクタム系薬のAUDをFig. 4に示した。ペニシリ ン系,第1世代セファロスポリン系は漸増した。第2世 代セファロスポリン系は減少傾向であった。第3世代セ ファロスポリン系および,第4世代セファロスポリン系 は増加傾向であった。セファロスポリン系全体としては,
2010年度を除き増加していた。オキサセフェム系は2006 年度以降減少していた。カルバペネム系は2006年度以降 減少傾向を示したが,2010年度以降増加した(Fig. 4)。
フルオロキノロン系薬は2007年度をピークに2009年 度まで減少傾向であった(Fig. 5)。
グリコペプチド系薬は,全体として増加,VCMは毎年 増加し,TEICは2005年度以降減少した(Fig. 5)。
各抗菌薬では,ペニシリン系は2009年度からTAZ!
PIPCが 増 加 し た。第3世 代 セ フ ァ ロ ス ポ リ ン 系 は CTRXが78.5%,第4世代セファロスポリン系はCFPM が96.5%,カルバペネム系はMEPMが79.3% を占めた
(Fig. 6)。
Fig. 1. Total number of culture samples and inpatient bed days.
The white columns represent the total number of bacterial culture samples (excluding blood cul- ture samples) in each fiscal year, and the spotted columns represent the total number of blood culture samples in each fiscal year. The line graph represents the number of inpatient bed days for each fiscal year. All data were collated for April to March on a fiscal year basis.
Total number of culture samples
Fiscal Year
Total number of inpatient bed days/fiscal year
26,718 24,974
22,758
21,106 20,831 20,688 21,662 22,795 4,643 5,735
6,541
7,059 8,002 8,434
9,871 10,266
419,610
366,797 380,849
365,885 370,252 364,946
405,582 409,114 450,000
400,000
350,000 40,000
30,000
20,000
10,000
0 2004 2005 2006 2007 2008 2009 2010 2011
culture (except blood) blood culture bed days
5.擦式消毒用アルコール年間総使用量の年度推移 2004年度から漸増し,2009年度には新型インフルエン ザの影響で約2倍に増加した。個人携帯用の消毒薬(60 mL),病室前や包交車に設置されている消毒薬(350 mL)
も同様に増加し, 個人携帯用は20倍に増加した。ICU,
検査室等で使用している消毒薬(1 L)は特に変化はみら れなかった(Fig. 7)。
6.系統別抗菌薬AUD・擦式消毒用アルコール使用
量とMRSA分離率
各系統別抗菌薬AUDおよび擦式消毒用アルコール使 用量と,全検体および血培検体中のMRSA分離率の相関
係数をTable 1にまとめた。全検体と血培検体の両方に
おいてMRSA分離率の減少とr=0.8以上のきわめて強 い相関を示したのは,第1世代セファロスポリン系,ペ ニシリン系,グリコペプチド系,擦式消毒用アルコール の使用量増加,ならびに第2世代セファロスポリン系の AUD減少であった(Table 1)。
重回帰分析では,最終的に相関性が最も強かった第1 世代セファロスポリン系のみがMRSA分離率の有意な 独立因子であった。
7.各抗菌薬AUDとMRSA分離率の相関
各抗菌薬AUDと全検体および血培検体中のMRSA 分離率のいずれにおいてもr=0.75以上で有意に相関し た抗菌薬は,PCG(r=−0.76,r=−0.79),TAZ!PIPC
+PIPC(r=−0.92,r=−0.97),CEZ(r=−0.90,r=
−0.99),CTRX(r=−0.75,r=−0.88),CFPM(r=−0.76,
r=−0.79),VCM(r=−0.85,r=−0.80)であり,負の 相関を示した。CMZ(r=0.90,r=0.89),CAZ(r=0.86,
r=0.85),CPR(r=0.87,r=0.87),PZFX(r=0.87,r=
0.77)は正の相関を示した。
III. 考 察
2005年度〜2009年度は改築に伴い,総在院日数は減少 したが,血培検体数は増加傾向にあった。アミノグリコ シド系薬の使用量は全体の1% にも満たなく,MRSA 分離率との関連の報告がないため今回は除外した。
JANISの公開情報では2011年の全検体提出患者にお
けるS. aureusの検出患者数は全体の16.1%,210,382人 で あ り,MRSA分 離 率 は54.6% と 報 告 さ れ て い る。
Nakamuraら3)は自施設のMRSA分離率が68.5%(1995
年)から53.8%(2008年)に減少したことを報告し,本
邦全体としても減少傾向にあるが未だ高値にある。当院 の2011年における全検体中のMRSA分離率は31.9%,
血培検体は40.6% と低値を示した。医療機関における MRSAの検出増加は,すでにmecA遺伝子を有するS.
aureusが抗菌薬の選択圧によって増殖し,水平伝播する
という2つのステップにおける要因を考えなければなら ないが,MRSA分離率が低値を示してもどちらの要因が 最も関連したかを区別することは必ずしも容易ではな い。
抗菌薬の使用量の動向は,院内における抗菌薬の適正
Fig. 2. Number of methicillin-resistant and methicillin-susceptible Staphylococcus aureus isolates and the isolation rate of methicillin-resistant Staphylococcus aureus.
(1) All the bacterial culture samples (blood, sputum, pus, urine, and stool): The spotted columns rep- resent the number of methicillin-resistant Staphylococcus aureus (MRSA) isolates among the SA iso- lates in all the samples. The white columns represent the number of methicillin-susceptible Staphylo- coccus aureus (MSSA) isolates among the SA isolates in all the samples. The line graph represents the isolation rates of MRSA (%) among the SA isolates in all the samples. (2) Blood culture samples: The shaded columns represent the number of MRSA isolates among the SA isolates in the blood culture samples. The white columns represent the number of MSSA isolates among the SA isolates in the blood culture samples. The line graph represents the MRSA isolation rates (%) among the SA isolates in the blood culture samples.
682 581 576 554 476 519 426 401
43.5% 38.8% 43.9%
40.4%
36.3% 36.2%
32.2% 31.9%
50%
40%
30%
20%
10%
0%
2,000
1,500
1,000
500
0 2004 2005 2006 2007 2008 2009 2010 2011
MSSA MRSA MRSA isolation rate
1,568 1,497 1,311 1,372 1,312 1,433 1,322 1,258
60 58 79 70 62
46 44 41
60.6% 60.4% 59.8%
51.1% 51.7%
43.8%
38.3% 40.6%
70%
60%
50%
40%
30%
20%
10%
0%
160
120
80
40
0 2004 2005 2006 2007 2008 2009 2010 2011
MSSA MRSA MRSA isolation rate
99 96
132 137
120
105 115 101
(1) All Samples
(2) Samples of Blood Culture
Number of isolates of MRSA, MSSA in Staphylococcus aureusNumber of isolates of MRSA, MSSA in Staphylococcus aureus % of MRSA in Staphylococcus aureus% of MRSA in Staphylococcus aureus
Fiscal Year Fiscal Year
使用の推進に基づくところが大きく,2006年2月からカ ルバペネム系薬使用届出制を,4月からICTによる週1 回の院内ラウンドを開始し,カルバペネム系薬の使用量 は2009年までに約60% 減少し(2010年度以降のカルバ ペネム系の増加は,MEPM添付文書改定に伴うもの),フ ルオロキノロン系の使用量減少にも努めてきた。これに 伴い第3・4世代セファロスポリン系のAUDは増加し たが,さまざまな種類の第3・4世代セファロスポリン系 の使用は,それぞれCTRX,CFPMが主体となり,院内 で使用される抗菌薬が管理されてきたことが明らかであ る(Fig. 6)。2007年からは携帯用アンチバイオグラムを 毎年発行しており,2009年度以降にはリンクドクター会 を毎月1回開催し抗菌薬使用動向等のフィードバックを 行い,感染症科の介入時のみならずより広い範囲で処方 管理が行われるようになったと考えられる。また薬剤部 においても2006年よりTDMの介入が開始され,現在ほ ぼ全例がモニタリングされているために,VCMにおい ては耐性化の進展防止に平均トラフ濃度が15μg!mL
を超え,使用量増加の大きな要因になっている。
これらの抗菌薬使用動向の変化について,系統別抗菌 薬AUDとMRSA分離率減少の関係を見ると,第1世代 セファロスポリン系,ペニシリン系,グリコペプチド系 の使用量増加,ならびに第2世代セファロスポリン系の 使用量減少ときわめて強い相関が認められた。抗菌薬使 用動向とMRSA分離率の関連については多くの報告が なされているが,Tacconelliらが76件のスタディから 行ったMRSA分離率とリスクファクターとなる抗菌薬 に関するシステマティックレビューでは,抗菌薬に曝露 されることで危険比(risk ratio:RR)が1.8倍高まり,
系統別ではフルオロキノロン系RR=3,グリコペプチド 系RR=2.9,セファロスポリン系RR=2.2,その他のβ― ラクタム系RR=1.9とされている16)。また,セファロスポ リン系の各世代別による報告では,第1〜4世代いずれも がMRSA分離率や患者数の増加と関連し3,17),第3世代 セファロスポリン系薬の使用制限がMRSA分離率を減 少させる報告が多い6,13)。ペニシリン系に関しては,SBT!
Fig. 3. Total number of patients per month with newly identified methicillin-resistant Staphylococcus aureus cultures.
The monthly number of patients with a newly identified MRSA culture was added together to obtain the total number for each fiscal year.
Fiscal Year
Total number of patients with newly isolated MRSA/fiscal year
572
473 470
436
322 308
242
206 700
600
500
400
300
200
100
0 2004 2005 2006 2007 2008 2009 2010 2011
Fig. 4. Antimicrobial usage density: β-lactam antibiotics.
The AUD of β-lactam antibiotics per 100 bed days was calculated on a fiscal year basis.
25
20
15
10
5
0 2004 2005 2006 2007 2008 2009 2010 2011
Carbapenems Oxacephems
4th-generation cephalosporins 3rd-generation cephalosporins 2nd-generation cephalosporins 1st-generation cephalosporins Penicillins
Total amount of antimicrobials (DDDs/100 bed days)
Fiscal Year
ABPCおよび広域 ス ペ ク ト ル を 有 す るTAZ!PIPCで あっても,それらの使用を増加させ,セファロスポリン 系やカルバペネム系を減少させることでMRSA分離率 が減少することが報告されている6,18)。
既報とわれわれの使用動向を比較してみると,フルオ ロキノロン系に関しては,曝露によるMRSA分離率増 加13,14),使用制限によるMRSA分離率減少10,15)が数多く報
告されリスク因子である妥当性は高く,われわれも2007 年度をピークにフルオロキノロン系AUDが減少し,同 様の結果であった。次にリスク因子と考えられるVCM および第3世代セファロスポリン系のAUDは増加して いるが,抗菌薬全体のAUDに占める割合はいずれも
10% 前後と少なく,変動としては全体の5% 程度である
こと,われわれの施設では実際にMRSAの分離率が低下
Fig. 5. Antimicrobial usage densities: fluoroquinolones and glycopeptides.
The AUD of fluoroquinolones and glycopeptide antibiotics per 100 inpatient bed days was calculated on a fiscal year basis.
2
1.5
1
0.5
0 2004 2005 2006 2007 2008 2009 2010 2011
Ciprofloxacin Pazufloxacin Vancomycin Teicoplanin
Total amount of antimicrobials (DDDs/100 bed days)
Fiscal Year
Fig. 6. Rate of antimicrobial usage densities: penicillins, 3rd-generation cephalosporins, 4th-generation cephalosporins and carbapenems.
The rate (%) of AUD for penicillins, 3rd-generation cephalosporins, 4th-generation cephalosporins and carbapenems antibiotics per 100 inpatient bed days was calculated on a fiscal year basis.
100%
80%
60%
40%
20%
0%
100%
80%
60%
40%
20%
0%
100%
80%
60%
40%
20%
0%
100%
80%
60%
40%
20%
0%
TAZ/PIPC rPIPC SBT/ABPC PCG
SBT/SPZ CTX CTRX CAZ
Fiscal Year 3rd-generation Cephalosporins
DRPM BIPM PAPM/BP IPM/CS MEPM
Fiscal Year Carbapenems
CZOP CFPM CPR
Fiscal Year 4th-generation Cephalosporins
% of AUD (Antimicrobial usage density)
2004 2005 2006 2007 2008 2009 2010 2011 2004 2005 2006 2007 2008 2009 2010 2011
2004 2005 2006 2007 2008 2009 20102011 2004 2005 2006 2007 2008 2009 20102011 Fiscal Year
Penicillins
していることから,単なる使用量の増加のみが影響する ものではなく,全抗菌薬における比率なども考慮する必 要性があると考えられる。
Westhらは,北欧においてMRSA分離率は非常に低
く,先進国においては総じて高いとし,国々の使用特性 を分析している1)。MRSA分離率の低下には,抗菌スペク
Table 1. Correlation between methicillin-resistant Staphylococcus aureus isolation rates and antimicrobial usage density or al- cohol-based hand-rub use
AUD vs. MRSA isolation rate in all samples (%) AUD vs. MRSA isolation rate in blood (%)
Penicillins r=−0.87 P<0.01 r=−0.82 P=0.01
1st-generation cephalosporins r=−0.90 P<0.01 r=−0.99 P<0.01
2nd-generation cephalosporins r=0.85 P<0.01 r=0.91 P<0.01
3rd-generation cephalosporins r=−0.57 P=0.14 r=−0.71 P=0.05
4th-generation cephalosporins r=−0.66 P=0.07 r=−0.68 P=0.06
Oxacephems r=0.69 P=0.06 r=0.77 P=0.02
Carbapenems r=0.84 P=0.08 r=0.30 P=0.48
Fluoroquinolones r=0.20 P=0.63 r=0.18 P=0.67
Glycopeptides r=−0.84 P<0.01 r=−0.86 P<0.01
Alcohol-based hand rub r=−0.77 P=0.03 r=−0.89 P<0.01
This table shows the correlation coefficients between the methicillin-resistant Staphylococcus aureus (MRSA) isolation rates in all the samples and the antimicrobial use density (AUD) for each antibiotic class or the alcohol-based hand-rub (ABHR) use. Correla- tions between the MRSA isolation rates in the blood culture samples and the AUD of each antibiotic class or the ABHR use are also shown.
Fig. 7. Volume of use of alcohol-based hand rub.
This figure shows the total volume of use of ABHR for each fiscal year, according to the specifica- tions: 60 mL (portable units for personal use), 350 mL (unit for use before entering a patientʼs room or at bedside), and 1,000 mL (unit used in the intensive care unit, laboratory, etc.).
Total amount of consumption (L)
Fiscal Year
130.0 103.0 115.0 78.0 75.0 85.0 88.0 70.8
886.2 1,024.8 967.8 1,149.8 1,224.0
1,776.5 1,455.0
1,387.9
10.1 8.0 62.3
53.9 37.5
203.4
223.3 245.2 2,000
1,500
1,000
500
0 2004 2005 2006 2007 2008 2009 2010 2011
60 mL 350 mL 1,000 mL
トル別の使用比率が寄与しており,Old(狭域スペクト ル)群(β―ラクタマーゼ阻害薬配合を除くペニシリン系)
とNew(広域スペクトル)群(セファロスポリン系,カ ルバペネム系,キノロン系など)に分けた場合,Old群の
使用量が50% 以上を占める国々はMRSA分離率が低い
一要因であると報告している。一方,第1世代セファロ スポリン系CEZは,S. aureusに対する選択圧となっては いるが,外科領域において第3世代からの切り替えに よってMRSA分離率を低下させることが報告されてお り19),また,当院の多変量解析結果において,MRSA分 離率の低下に最も寄与していたのは第1世代セファロス ポリン系のAUD増加であった。同様にβ―ラクタマーゼ
阻害薬配合ペニシリン系もMRSA分離率低下が報告さ れ,それぞれの系統は単独でもMRSA分離率低下と高い 相関性(r=0.8以上)が認められていることから,Old 群に第1世代セファロスポリン系およびβ―ラクタマー ゼ阻害薬配合ペニシリン系を加えた分類のAUDが占め る割合は,MRSA分離率と抗菌薬の選択圧を考えるうえ でより論理的である。それらに群分けした場合の狭域ス ペクトル群の当院の総AUDの値も全体の約60% 以上 と高く,考慮すべき要因であると考えられた。
抗菌薬AUDとMRSA分離率に関する報告は施設に より異なっているが,擦式消毒用アルコールの使用量の 増加とMRSA分離率減少の報告は同傾向にある。擦式消
毒用アルコールによる手指衛生の奨励は抗菌薬使用量に 関係なくMRSA分離率を減少させ7,11),また,すべての部 屋に擦式消毒用アルコールを配置し医療行為の前後に使 用すること8),WHOの手指衛生5つのタイミングを遵守 すること9)などは,MRSA感染発生率の減少に寄与する ことが報告されている。本調査においても病室前に設置 している消毒薬(350 mL)は増加しているが,重要なこ とは一処置一消毒を実施することであり,病室前の消毒 薬の対応だけでは難しい面もある。個人携帯用の消毒薬 の使用は一処置一消毒を容易にするため,教育訓練に よって,この使用量を増加させることが重要である。当 院では手指衛生の向上を目的とし,1996年より毎年4 月に新入職員全員を対象とし,個別に手洗い実習と蛍光 塗料を使用した手洗い検証,一処置一消毒による擦式消 毒用アルコールの使用を指導してきた。2001年には医療 スタッフの院内教育として,毎年1回手洗い強化月間を 設け,リンクナースおよび各部署ICTが中心となり医療 スタッフへのパームスタンプ法の導入,また個人携帯用 の消毒薬の使用を推奨してきた。2008年から年2回の院 内感染対策講習会を実施し,医療スタッフ全員の出席を とり,手指衛生をはじめ感染対策にかかわる内容を受講 させている。消毒薬の規格別消費データでは,2009年以 降は個人携帯用の消毒薬(60 mL)の使用量が2004年比 で約20倍の増加となっており,MRSA分離率も低下し ていることからMRSAの水平伝播が回避されたと考え る。
ICT介入による処方管理も影響しており,MRSA分離 率低下と抗菌薬の選択圧との関係を単純なAUDとのレ トロスペクティブスタディで明らかにすることは困難で あるが,MRSA増加リスクの高い抗菌薬の系統であって も相対的使用量が少なければMRSA増加要因とならな い可能性があること,β―ラクタマーゼ阻害薬配合を含ん だペニシリン系と第1世代セファロスポリン系の相対的 使用量の多さはMRSA分離率の低下に関連する要因で あることが示唆された。さまざまな形で院内における抗 菌薬選択の適正化を図り,手指衛生の向上によって水平 伝播が抑えられなければ,新規MRSA患者減少につなが らない。MRSA分離率改善にはICTを中心とした病院 全体における感染対策を継続していくことが重要と考え る。
謝 辞
本論文の執筆にあたり,ご指導いただきました大友陽 子副看護部長をはじめ,感染対策実務委員の皆様に深謝 いたします。
本論文の主要な部分は,第58回日本化学療法学会総会 において発表した。
利益相反自己申告:申告すべきものなし。
文 献
1) Westh H, Zinn C S, Rosdahl V T: An international
multicenter study of antimicrobial consumption and resistance inStaphylococcus aureus isolates from 15 hospitals in 14 countries. Microb Drug Resist 2004;
10: 169-76
2) http:!!www.nih-janis.jp!report!kensa.html
3) Nakamura A, Miyake K, Misawa S, Kuno Y, Horii T, Hori S, et al: Association between antimicrobial con- sumption and clinical isolates of methicillin-resistant Staphylococcus aureus: a 14-year study. J Infect Che- mother 2012; 18: 90-5
4) Hanberger H, Walther S, Leone M, Barie P S, Rello J, Lipman J, et al: Increased mortality associated with methicillin-resistant Staphylococcus aureus ( MRSA ) infection in the intensive care unit: results from the EPIC II study. Int J Antimicrob Agents 2011; 38: 331- 5
5) Pastagia M, Kleinman L C, Lacerda de la Cruz E G, Jenkins S G: Predicting risk for death from MRSA bacteremia. Emerg Infect Dis 2012; 18: 1072-80 6) Smith D W: Decreased antimicrobial resistance after
changes in antibiotic use. Pharmacotherapy 1999; 19:
129S-32S
7) Jarlier V, Trystram D, Brun-Buisson C, Fournier S, Carbonne A, Marty L, et al: Curbing methicillin- resistantStaphylococcus aureusin 38 French hospitals through a 15-year institutional control program.
Arch Intern Med 2010; 170: 552-9
8) Gordin F M, Schultz M E, Huber R A, Gill J A: Re- duction in nosocomial transmission of drug-resistant bacteria after introduction of an alcohol-based hun- drub. Infect Control Hosp Epidemiol 2005; 26: 650-3 9) Monistrol O, Calbo E, Riera M, Nicolás C, Font R,
Freixas N, et al: Impact of a hand hygiene educa- tional programme on hospital-acquired infections in medical wards. Clin Microbiol Infect 2012; 18: 1212-8 10) Madaras-Kelly K J, Remington R E, Lewis P G, Ste-
vens D L: Evaluation of an intervention designed to decrease the rate of nosocomial methicillin-resistant Staphylococcus aureus infection by encouraging de- creased fluoroquinolone use. Infect Control Hosp Epidemiol 2006; 27: 155-69
11) Mahamat A, MacKenzie F M, Brooker K, Monnet D L, Daures J P, Gould I M: Impact of infection control interventions and antibiotic use on hospital MRSA: a multivariate interrupted time-series analysis. Int J Antimicrob Agents 2007; 30: 169-76
12) Sroka S, Gastmeier P, Meyer E : Impact of alcohol hand-rub use on meticillin-resistant Staphylococcus aureus: an analysis of the literature. J Hosp Infect 2010; 74: 204-11
13) Paterson D L : “ Collateral damage ” from cepha- losporin or quinolone antibiotic therapy. Clin Infect Dis 2004; 38(Suppl 4): S341-5
14) Weber S G, Gold H S, Hooper D C, Karchmer A W, Carmeli Y : Fluoroquinolones and the risk for methicillin-resistantStaphylococcus aureusin hospital- ized patients. Emerg Infect Dis 2003; 9: 1415-22 15) Liebowitz L D, Blunt M C: Modification in prescrib-
ing practices for third-generation cephalosporins and ciprofloxacin is associated with a reduction in meticillin-resistantStaphylococcus aureusbacteraemia
rate. J Hosp Infect 2008; 69: 328-36
16) Tacconelli E, De Angelis G, Cataldo M A, Pozzi E, Cauda R: Does antibiotic exposure increase the risk of methicillin-resistantStaphylococcus aureus(MRSA) isolation? A systematic review and meta-analysis. J Antimicrob Chemother 2008; 61: 26-38
17) Ota R, Takahashi C, Shiraishi T, Tominaga M: [Gene- sis of methicillin-resistant Staphylococcus aureusand selective antibacterial injection pressure ]. Kansen- shogaku Zasshi 2007; 81: 370-8
18) Landman D, Chockalingam M, Quale J M: Reduction in the incidence of methicillin-resistant Staphylococ- cus aureus and ceftazidime-resistantKlebsiella pneu- moniaefollowing changes in a hospital antibiotic for- mulary. Clin Infect Dis 1999; 28: 1062-6
19) Fukatsu K, Saito H, Matsuda T, Ikeda S, Furukawa S, Muto T: Influences of type and duration of antimi- crobial prophylaxis on an outbreak of methicillin- resistantStaphylococcus aureusand on the incidence of wound infection. Arch Surg 1997; 132: 1320-5
A study of the usage of antibiotics and hand disinfectants and their effect on methicillin-resistant Staphylococcus aureus isolation rates
Toshiko Konishi1), Aeko Goto2), Yuji Hirai3), Yusuke Ainoda3), Takahiro Fujita3), Toshimi Kimura1)and Kyoichi Totsuka3)
1)Department of Pharmacy, Tokyo Womenʼs Medical University Hospital, 8―1 Kawada-cho, Shinjuku-ku, Tokyo, Japan
2)Department of Clinical Laboratory, Tokyo Womenʼs Medical University Hospital
3)Department of Infectious Disease, Tokyo Womenʼs Medical University
Methicillin-resistantStaphylococcus aureus(MRSA) is an important pathogenic bacterium causing noso- comial infections, accounting for 67% and 55% of allS. aureusisolates in Japan in 2004 and 2011, respectively.
MRSA bacteremia is associated with a high mortality rate and is difficult to treat; therefore, the control and treatment of MRSA infections with antibiotics is important. Using data from patients hospitalized between April 2004 and March 2012, we examined how the use of antibiotics and hand disinfectants affected the MRSA isolation rates.
The prevalence of MRSA amongS. aureusisolates from all the samples and blood culture samples (herein- after referred to as the MRSA isolation rate) decreased from 43.5% and 60.6% in 2004 to 31.9% and 40.6% in 2011, respectively. The antimicrobial usage density (AUD) and the MRSA isolation rates from all the sam- ples and blood culture samples were correlated for first-generation cephalosporins (r=−0.90, −0.99), penicil- lin antibiotics (r=−0.87, −0.82), glycopeptide antibiotics (r=−0.84, −0.86), and alcohol-based hand rub (ABHR ) (r= − 0.77, − 0.89 ) ; the MRSA isolation rates decreased with the increased use of the above- mentioned antibiotics!disinfectants. In addition, as the use of second-generation cephalosporins (r=0.85, 0.91) decreased, the MRSA isolation rates also decreased. The AUDs of vancomycin and third-generation cepha- losporins, which are correlated with the MRSA isolation rates, both increased. However, the AUD of the third-generation cephalosporins per total amount of the AUD was approximately 10%. The low comparative use of antibiotics did not affect the increase in the MRSA isolation rates. The AUDs of the first-generation cephalosporins and penicillin antibiotics increased by more than 60%. Our results suggested that the in- creasing AUDs of narrow-spectrum antibiotics might reduce the MRSA isolation rates. The use of ABHR, which has increased across institutions, appears to be strongly associated with the MRSA isolation rates. Im- proved hand hygiene after in-hospital education and the prevention of horizontal transmission through the use of infection control measures according to the infection transmission routes may also have contributed to the decrease in the number of patients with newly identified MRSA cultures. We consider it important to continue the implementation of hospital-wide infection control programs and antimicrobial stewardship, mainly by infection control teams.