A Recognition Method for Thoracic Aortic
Aneurysm for Automated Design of Stent Graft
著者 Shi Weihao
出版者 法政大学大学院情報科学研究科
journal or
publication title
法政大学大学院紀要. 情報科学研究科編
volume 14
page range 1‑6
year 2019‑03‑31
URL http://doi.org/10.15002/00021918
A Recognition Method for Thoracic Aortic Aneurysm for Automated Design of Stent Graft
Weihao Shi
Graduate School of Computer and Information Science, Hosei University
3-7-2 Kajino-cho, Koganei, Tokyo, 184-8584, Japan [email protected]
Abstract— A recognition method was proposed for detecting aortic dissection and aneurysm segment from multi-CT images. The recognition technique was based on the fact that the diseased area cross sections were deformed from healthy aortic lumen, i.e nearly circular cross sections. This method gave us some useful data are provided such as aortic diseased area, central line of aortic lumen, cross section shape of diseased area and circularity of aortic cross section for designing of aortic stent graft and aortic surgery. The doctor can use these data to make judgments in the actual diagnosis. The proposed method was successfully applied to some types of patients data, identified the type of aneurysm and gave out the data for stent designing.
Keywords—Multi-Slice CT, Thoracic Aneurysm, Successive Region Growing, Center Line, Alpha Shape.
I. INTRODUCTION
Stent grafting uses a stent graft to reinforce the wall of the aorta and to help keep the damaged area from rupturing. The stent graft is placed inside of the aortic aneurysm with the help of a long, very thin, soft, plastic tube called a delivery catheter [1]. As the description, each person’s aortic vessel has own shape and diameter, so stent graft with fixed diameter and curvature may hurt the vessel wall or cause the position shift due to insufficient fixation to the vessel wall. For preventing these troubles, the stent should be designed separately to fit every small segment of cross sections along the aortic lumen central line. Thus, measurement of the shape and the diameter of patient’s thoracic aorta is the key for the stent grafting [2].
Multi-slice CTs, which have rapidly developed in a decade, are used as a tool for the measurement of the shape of thoracic aorta. Using CT Angiography (CTA), we are actually able to reconstruct the three-dimensional shape of aortic vessel of a patient. This means that we can get the detailed shape and the diameter of the thoracic aorta vessel in principle. However, the manual measurement by doctors always takes long time.
Large number of slice images of thoracic CTA provide three- dimensional shape of the target thoracic aorta, but they also output those of rib bones and pulmonary vein and artery, which have noise components against the target vessel. So before the measurement, doctors have to separate the target aortic vessel from other noise components which also takes time [3]. Recently, computer assistance systems are making the aorta extraction and measurement more efficient than before. Although the doctor’s role cannot be replaced, but providing some new efficient ways for computer assistance systems are becoming important to make medical diagnosis more efficient.
For the purpose of computer assistance diagnosis for stent grafting, a workflow of recognizing aortic dissection and aneurysm is proposed. In this workflow, we will focus on target aorta lumen extracting, diseased aorta area detection, cross section shape rebuilds and cross section information calculation. The successive region growing (SRG) method is taken to extracting the target aorta lumen; The alpha shape (concave hull) method is taken to rebuild the slicing shape of aortic dissection segment for generating the lumen central line;
The distance from border (DFB) values for each pixel are calculated for generating the initial central line; The levenberg-marquardt method is taken to calibrate the central line. By the end of the workflow, some useful information will be generated for the automated designing of stent and arterial surgery. In this thesis, at first the general workflow will be explained and then the detailed methods for each step will be proposed.
II. RELATED WORKS
In this part, related current research about thoracic aorta aneurysm using CT images and medical knowledge about stent graft will be introduced.
Kento Horikoshi proposed an automated recognition technique for aorta aneurysm using thoracic multi-slice CT images [1]. In his research, a cylinder model is proposed for fitting the shape aorta lumen segment and used as stent graft designing. Based on his method, the aorta target area extracting method with successive region growing is used; and his method also inspired our method on central line calibration.
But for the enhancement, our target CT data sets consist of different kinds of aneurysm such as ascending aneurysm, aortic arc aneurysm, descending aneurysm and aortic dissection. So we proposed a workflow of methods dealing with these different types of aneurysm diseases in a more general way. Some pre-processing methods are taken into use such as alpha shape; and for the efficiency, another central line generation method is proposed by using the distance from border value; At last, our aneurysm detection method is based on common medical knowledge for realistic basis.
III. PRINCIPLE AND PROCEDURES A. General Approach
The recognition method for thoracic aortic aneurysm for automated design of stent graft workflow in general requires five fundamental steps, including CT image pre-processing, target aorta lumen extraction, central line generation, cross section information calculation and diseased vessel information generation. Decisions on the design of the workflow were taken towards generalization and precision on one hand, and efficiency on the other hand.
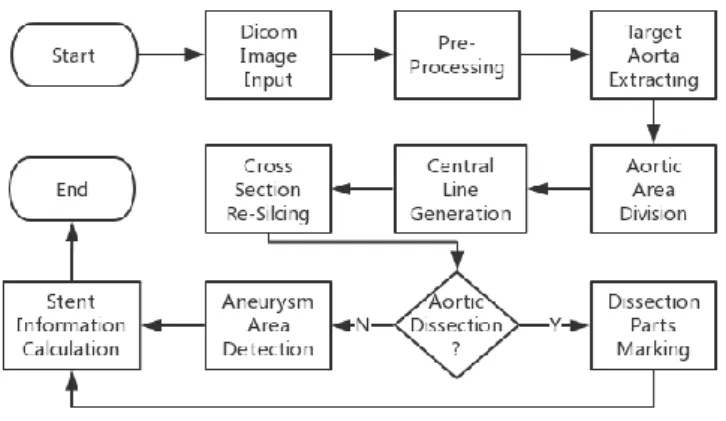
As described above, we have different methods for the aortic dissection and non-aortic dissection detection. These methods are arranged in a total workflow shown in Fig. 1.
Fig. 1. Total workflow of methods.
The detailed work for the five steps are listed as follow:
Step1: CT image pre-processing. This step includes the first four processes on the figure. The dicom format multi- slice CT data are taken as the input. Useful information such as Hounsfield Unit (HU) value and rescale parameters will be read and transformed to normal grey scale images [4]; Because of the noise generated during CT scanning, noise cancelling method such as Gaussian filter will be applied to get better quality of images.
Step2: Target aorta lumen extracting. This step includes a successive region growing method (SRG) and an alpha shape method. The SRG uses HU value as threshold and needs a start point and an end point defined manually. After three-dimensional SRG is performed, an alpha shape method will be applied to all slices to full fill the gaps caused by aortic dissection that may occur. It is a very important pre-step for the central line generation.
Step3: Central line generation. For this step, a distance from border (DFB) value field will be generated in the target lumen area. Refer to the DFB values, we can generate a minimum spanning tree [5], along the tree, we can generate a continuous initial central line of the target aorta lumen. To reduce the noise on the initial central line, a calibration method of linking the minimum cross sections central points calculated by the levenberg–marquardt method will be performed. At last we will get a relatively accurate central line.
Step4: Cross section information calculation. Along the central line we get, new slices perpendicular to tangent vectors on the central line will be calculated. By using these slices that reflect the actual three-dimensional shapes of aorta lumen, we can calculate the results such as slice area, circularity and the radius of the circle has the same area with the slice. These results are important for providing assistance on the stent designing.
Step5: Diseased aorta area detection. Actually, many benchmarks that are generated from the new three- dimensional slices can be taken to diseased area detection. Based on doctor’s diagnostics, the circularity and the radius of the circle that has the same
area with cross section seems to be the most similar to doctor's diagnosis.
In the following sections, we will explain in detail our workflow and methods for recognition of thoracic aortic aneurysm for automated design of stent graft.
B. Dicom CT Image Pre-Processing
CT images are stored in dicom format. For this research, the target aorta area will be extracted. The HU (Hounsfield Unit) value from dicom file provides us an extracting criteria for distinguishing different tissues in the human. The Hounsfield unit (HU) scale is a linear transformation of the original linear attenuation coefficient measurement into one in which the radio density of distilled water at standard pressure and temperature (STP) is defined as zero Hounsfield units (HU), while the radio density of air at STP is defined as -1000 HU [3].
Due to the use of contrast agents, the HU value scale of aorta part is from 250HU to 450HU [1]. The HU value is calculated by a linear transformation consists of the parameters read from the dicom file as writes in (1).
HU = 𝑉𝑝𝑖𝑥𝑒𝑙× 𝑉𝑟𝑒𝑠𝑐𝑎𝑙𝑒_𝑠𝑙𝑜𝑝𝑒+ 𝑉𝑟𝑒𝑠𝑐𝑎𝑙𝑒_𝑖𝑛𝑡𝑒𝑟𝑐𝑒𝑝𝑡 (1) where 𝑉𝑝𝑖𝑥𝑒𝑙 represents for pixel value, 𝑉𝑟𝑒𝑠𝑐𝑎𝑙𝑒_𝑠𝑙𝑜𝑝𝑒
represents for value of rescale slope and 𝑉𝑟𝑒𝑠𝑐𝑎𝑙𝑒_𝑖𝑛𝑡𝑒𝑟𝑐𝑒𝑝𝑡
represents for intercept value.
C. Noise Cancelling
Gaussian low pass filter is a type of linear smoothing filter whose transfer function is a Gaussian function. Besides, Gaussian functions are normally distributed density functions.
In this research a Gaussian low-pass filter is chosen for removing noise in original CT images [6].
D. Successive Region Growing
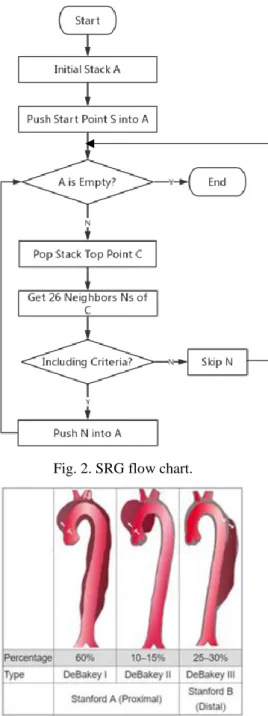
The Successive Region Growing(SRG) is a simple region- based image segmentation method originally proposed by Levine et al. The specific implementation process is to first give a seed point or a seed region in the image area that to be segmented, and then continuously incorporate its neighboring pixels with some including criteria, and finally all the pixels that meet the criteria in the region of interest will be obtained to form a complete three-dimensional image [7]. In this paper, the SRG method takes 26 neighbor pixels of current processing point as including area and uses a HU value scale of aorta part as including criteria. In this research, the including criteria writes in (2).
250 ≤ H(x) ≤ 450 (2) where H(x) represents the HU value in point x and all the points that have the HU value in the scale will be included as the region of interest. Workflow of the SRG shows in Fig. 2.
E. Aortic Area Segment
By the processing of successive region growing and alpha shape method, a thoracic aorta lumen has been extracted as our target area. In this three-dimension area, three parts of thoracic aorta should be distinguished: the ascending aorta, the aortic arc and the descending aorta. For another medical reason, a “Stanford Classification” is widely used and by dividing different aortic parts, we can indicate which type of aortic dissection the patient has [8]. The sample classification image shows in Fig. 3.
Fig. 2. SRG flow chart.
Fig. 3. Aorta area classification [10].
The processing order starts from the bottom slice and goes up until the aortic arc top slice. For every slice, if there is only one connected area detected, we regard this slice as part of ascending aorta, if the process meets two connected areas and the difference in area is within 50% [9], then we regard the connected area on the left as part of descending area; then with the processing going on, then number of connected area will become one again, then we mark the number of this slice as the start of the aortic arc, and all slices above make up the aortic arc.
So after the aortic area segmentation, combined with the diseased area detection, we can indicate the area that aneurysm occurs in.
F. Alpha Shape
When processing the aorta slices which has aortic dissection, the SRG result may generate some gaps in three- dimensional aorta images [11]. These gaps will affect the
following processing step of “Central Line Generation”, so we should fill the gaps and keep the original shape of aorta as much as possible. Then an Alpha Shape method will be taken into use to solve this problem.
Alpha Shapes is a way to abstract the intuitive shape from discrete point sets. In short, get a rough outline from an unordered set of points. In computational geometry, an alpha shape is a family of piecewise linear simple curves in the Euclidean plane associated with the shape of a finite set of points [12].
We apply the Alpha Shape method to the image slices that generated from the SRG method. Every slice should be a binary image with aorta area pixel value 255 in 8 bit, and background pixel value 0. Above our explanation above, the Alpha Shape method will traverse all the input point set, for the aorta area in one slice is always above 1000 pixels, so the edge of the aorta area should be extracted first, then we can use the point set of this edge to process the Alpha Shape method. After this is done, gaps along the aorta should be filled and the original shape of the aorta won’t be changed as well. A sample results of alpha shape is shown in Fig. 5.
Fig. 5. Alpha shape result sample.
G. Aortic Dissection Part Detecting Method
Along the central line, projection will be done on the plane that perpendicular to tangent vector on the central line. It generates a series of new three-dimensional slices that reflect the real shape of aorta lumen. On the same point on central line, the projection of alpha shape processed and the projection before the process will both be generated to calculate the area difference of aorta lumen. The conditions write in (3) and (4).
) (
) ( )
) ( (
D S n
n S n n S
original original alphashape
−
=
(3)
Normal T
tion Dis
T n
,
sec )
( D
,
(4)
where Salphashape(n) represents for the projection area of aorta lumen after the alpha shape process at point n and Soriginal(n) represents for the projection area of aorta lumen before the alpha shape process at point n. And T represents for the threshold to determine the aortic dissection.
If D(n) is larger than the threshold T, then aortic dissection is detected; if 𝐷(n) is smaller than T, we treat it as a normal lumen part. The threshold T is set to 0.05 in this method.
H. Center Line Generation
In a tubular object like the thoracic aorta, there is normally only one central line that spans it. A concise definition of center line is the locus of centers of minimal disks (in two dimensions) or balls (in three dimensions) contained in the three-dimensional shape [13].
Our algorithms considered the use of a distance from each inside voxel to the nearest object boundary, to improve the centricity of the shortest path. We call this the DFB-distance in this paper (the distance from the boundary) [7]. A simple Euclidian DFB-distance is shown in Fig. 6. In Fig. (a), pixel 0 represents for the boundary and pixel 1 represents for image shape. In Fig. (b), the Euclidian distance to the nearest boundary of each pixel 1 is calculated as DFB-distance.
(a) (b) Fig. 6. DFB calculation sample.
Then the central line is generated according the three- dimensional DFB-distance field as following steps:
Step1: Select a start point S in bottom slice and an end point E in slice near the heart. Mark E as the current processing point C;
Step2: For the 26 neighbors of S, find all points Ns that were not visited, insert N into a sort heap with weight 1/DFB(N);
Step3: Get the head H of the sort heap, record H and mark H as the current processing point C;
Step4: Repeat Step2 and Step3 until point C reach the start point S;
Step5: Get all Hs in order as the extracted central line.
I. Center Line Generation
Since the initial central line includes some noise and is not stable enough, the central line correction process will be done by finding the center points of minimum cross sections along the initial central line.
From the methods of getting normal cutting plane stated above, for a sample point Ps on central line we can get the points in the target aorta area. Suppose a global coordinate system (X, Y, Z) to which the CT images are read and a local coordinate system (X’, Y’, Z’) whose Z’ axis is parallel to the tangent vector of the normal cutting plane. In order to calculate the area of cross section that passes point Ps, we have to control the rotation of both X’ axis and Y’ axis. The coordinates between global and local system should obey the relation in (5).
( 𝑥′
𝑦′
𝑧′
𝑡′
) = 𝑅𝑟𝑜𝑡𝑎𝑡𝑒⋅ ( 𝑥 𝑦 𝑧 1
) (5)
The rotation matrix 𝑅𝑟𝑜𝑡𝑎𝑡𝑒 can be decomposed into the combination of a rotation matrix Rx in X’ axis, a rotation matrix Ry in Y’ axis and a translation matrix T as (6).
𝑅𝑟𝑜𝑡𝑎𝑡𝑒= 𝑇(−𝑢,−𝑣,−𝑤)𝑅𝑥𝑅𝑦𝑇(𝑢,𝑣,𝑤) (6) Where the Rx , Ry and T writes like:
Rx= (
0 0 0 1
0 cos 𝜃 sin 0 0 0 sin 𝜃 cos 𝜃 0
0 0 0 1
) (7)
Ry= (
cos 𝜑 0 sin 𝜑 0
0 1 0 0
− sin 𝜑 0 cos 𝜑 0
0 0 0 1
) (8)
T(u,v,w)= (
1 0 0 𝑢 0 1 0 𝑣
0 0 1 𝑤
0 0 0 1
) (9)
Through the coordinate transformation, we can generate an area function that returns the area of aorta lumen cross section part with the rotation angel θ and φ called S(𝜃, 𝜑) .
Then the processing of the Levenberg–Marquardt method will be run, and we can get the minimum value of cross section area function S(𝜃, 𝜑) and also the rotation angel 𝜃 and 𝜑.
Further the center point of minimum cross section that passes a certain sample point along initial central line can be generated.
J. Aneurysm Area Detection
From medical knowledge, for thoracic aortic aneurysm diameter greater than 50% of the normal diameter can be diagnosed as thoracic aortic aneurysm including two kinds of situations: ascending and arch aorta diameter more than 50mm;
descending aorta diameter of more than 40mm [14].
The projection will be done along the final calibrated central line and the maximum diameter of cross section area will be calculated for aneurysm area detection.
K. Stent Graft Designing Data
In our research, after processing of input dicom CT image slices, finally we will give out results of tangent vectors along the aorta center line that indicate the stent direction.
Because the stent is designed in cylinder shape, the diameter of stent segment is given by calculating the circle whose perimeter is equal to the perimeter of the of the re- sliced cross section in point 𝑛 written in (10).
𝐷𝑐𝑖𝑟𝑐𝑙𝑒(𝑛) = 𝐷𝑟𝑒−𝑠𝑙𝑖𝑐𝑒(𝑛) (10) IV. EXPERIMENTAL RESULTS
The whole method workflow is implemented in Python and has been applied on a data set of 185 pieces of dicom CT images.
A. Aorta Extraction Results
The including criteria for SRG is [250, 450] HU and an extraction result shows in Fig. 8.
B. Alpha Shape Results
The alpha shape method for filling aortic dissection gaps is run on two-dimensional binary slice images. In Fig. 9 the processing is displayed.
From left to right in Fig. 9, shows the threshold extracting aorta area, edge of the aorta and alpha shape of the edge. Using
the edge to calculate alpha shape will much increase the processing speed because the inner points are ignored.
Fig. 8. Aorta extraction result by SRG.
Fig. 9. Alpha Shape for Aortic Dissection
Fig. 10. Central line extraction result.
C. Central Line Generation Results
The initial central line is generated based on the DFB- distance field. The start point and end point are manually specified. The central line generation result with aorta shape is displayed in Fig. 10.
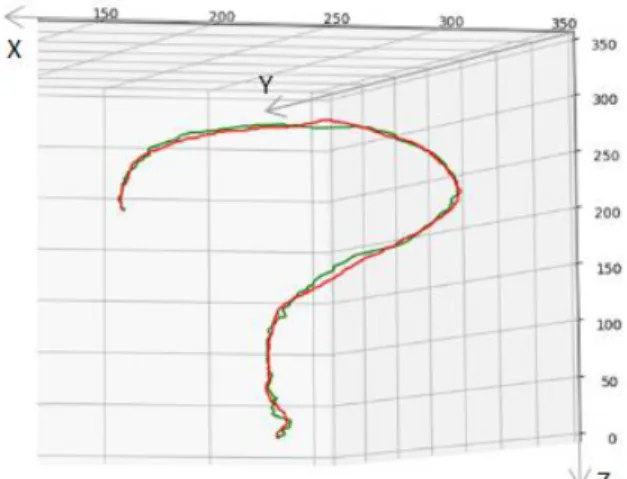
D. Central Line Correction Results
The calibration processed automatically based on the initial center line and the results shows in Fig. 11.
The green line is the initial center line generated by DFB- distance field and the red line is the calibrated center line based on the Levenberg–Marquardt method. We can see that the initial center line has some noise that cause jitter, but the calibrated center line is more smooth and stable.
E. Three-Dimensional Re-Slicing Results
According to the final center line the re-slices are projected perpendicular to tangent vectors. Here displays the sets of slice of horizontal direction and tangent vector direction on a same sample point.
Fig. 11. Central line calibration result.
(a) (b)
(c) (d) Fig. 12. Projection image pairs.
In Fig. 12, each row is a group of image. (a) is the horizontal projection image and (c) is projection image on plane that perpendicular to tangent vector on the same sample point as (a). And (b) is in the same relation with (d).
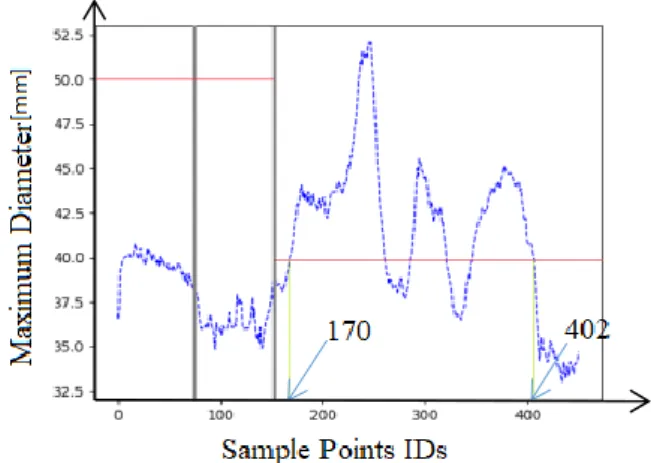
F. Maximum Diameter of Re-Slicing Aorta Area
According to the re-slicing images, the maximum diameters of aorta lumen area are generated and shows in Fig.
13.
The x axis represents for the sample points’ ids in the order of ascending aorta to descending aorta and y axis represents for the maximum diameter(mm). Combine with results of aorta area segmentation, from number 0 to number 79 are the area of ascending aorta; from number 80 to 151 are the area of aortic arc and the rests are the area of descending aorta. So for ascending aorta and aortic arc, we have the diameter threshold for aneurysm of 50mm and 40mm for descending part. From the threshold results, we can indicate that from number 170 to number 402 as aneurysm area.
G. Results for Stent Graft Designing
After the processing above, tangent vectors and the diameter of a circle whose perimeter is equal to the perimeter of the of the re-sliced cross section is generated for the designing of stent graft. The tangent vectors show in Fig. 14.
Fig. 13. Aneurysm area detection result.
Fig. 14. Tangent vectors along central line.
Besides, the diameter of the circle whose perimeter is equal to the perimeter of the of the re-sliced cross section is shown in Fig. 15.
Fig. 15. Diameter of equivalence circle.
where the x axis represents for the sample point ids and the y axis represents for the equivalent circle diameter(mm).
Combined with the tangent vectors along central line and the diameter of equivalent circle, the stent graft can be located and shaped at any position in the diseased aorta lumen.
V. CONCLUSION
In this research, patients multi-CT data sets with different kinds of aneurysm were took into experiments. First, a SRG method using HU value scale as including criteria is used to
extract the target aorta lumen area. After that, an alpha shape method is applied to full fill the dissection gaps. This result generates the difference of projection areas to determine the aortic dissection parts. Then a central line generation method based on DFB-distance is applied on the gap-filled slice images. Then the central line is corrected by linking center points of minimum cross sections. At last, aneurysm parts, center line tangent directions and cross section diameters for stent designing are calculated.
Our methods are going to provide a efficient way to assist doctors’ diagnosis and design the stent graft. The whole methods workflow have been run on 5 data sets of multi-CT images and gave out similar results with doctors’ diagnosis.
For the further improvement, an automated method for finding and cutting the three top bifurcation aorta vessels is needed. Also, there are still some improvements can be done on extracting the target aorta lumen with more precise methods such as level set method. More data sets should be taken into experiments as well.
REFERENCES
[1] Kento Horikoshi, Hiroshi Hanaizumi, Shin Ishimaru An Automated Recognition Technique for Aorta Aneurysm Using Thoracic Multi- Slice CT Images,Proc.ISITA, 2014.
[2] Olga.C Avlila Montes, Uday Kurkure, Ryo Nakazato, Segmentation of the Thoracic Aorta in Noncontrast Cardiac CT Images, IEEE Journal of Biomedical and Health Informatics, Volume: 17, Issue: 5, Sept. 2013, pp. 926-949.
[3] I. S. Jacobs and C. P. Bean, An automatic tool for thoracic aorta segmentation and 3D geometric analysis, vol. III, G. T. Rado and H.
Suhl, Eds. New York: Academic, 2014, pp. 271–350.
[4] K. Elissa, Aging Impact on Thoracic Aorta 3D Morphometry in Intermediate-Risk Subjects: Looking Beyond Coronary Arteries with Non-Contrast Cardiac CT, Annals of Biomedical Engineering, Volume:
17, Issue: 5, Sept. 2012, pp. 1031-1045.
[5] Harikrishna Rai G.N, T.R.Gopalakrishnan Nair, Gradient Based Seeded Region Grow method for CT, Director –Research and Industry, Sept. 2013.
[6] Angiographic Image Segmentation, Annals of Biomedical Engineering, Volume: 17, Issue: 5, Sept. 2012, pp. 1031-1045.
[7] Esan Dehagan, Hongzhi Wang, Tanveer Syede-Mahmood, Automatic detection of aortic dissection in contrast-enhanced CT, 2017 IEEE 14th International Symposium on Biomedical Imaging, June. 2017, [8] Dongqi Chen, Bin Li, Zheng Rongliang, A tree-branch searching,
multiresolution approach to skeletonization for virtual endoscopy, IEEE Trans, on Image Processing, vol. 1, pp. 205-220, 2016.
[9] Wiki Pedia, Alpha Shape[OL], https://en.wikipedia.org/wiki/Alpha_s hape.
[10] Wiki Pedia, Aortic Dissection[OL], https://en.wikipedia.org/wiki/Aort ic_dissection..
[11] Ernst Schwartz, Roman Gottardi, Johannes Holfeld, Evaluating deformation patterns of the thoracic aorta in gated CTA sequences, 2010 IEEE International Symposium on Biomedical Imaging: From Nano to Macro, April. 2010.
[12] Wang Jianming, Zhao He, Chen Dandan, Segmentation of the Aortic Dissection from CT Images Based on Spatial Continuity Prior Model, 2016 8th International Conference on Information Technology in Medicine and Education (ITME), Dec. 2016.
[13] Matt Hancock, The Implementation of 3D Successive Region Growing[OL], http://notmatthancock.github.io/2017/10/09/region- growing-wrapping-c.html.
[14] Wilamowski, B. M., & Yu, H). Improved computation for Levenberg–
Marquardt training. IEEE transactions on neural networks, 21(6), 930- 937.