結核年報 2014(4)治療・治療成績
結核研究所疫学情報センター
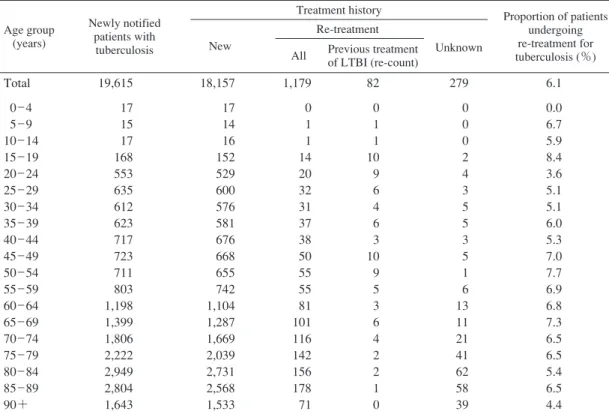
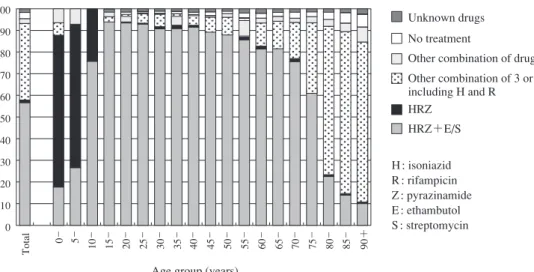
キーワーズ:結核,治療歴,受療状況,治療期間,治療成績 は じ め に わが国における結核登録患者のうちで治療歴がある患 者の割合は,過去の結核対策の実施状況を反映する。近 年の結核対策の実施状況を評価するためには,結核患者 の治療成績状況について把握する必要がある。結核登録 者情報調査年報では,前年に登録された全結核患者集団 をコホート分析の対象とし,そのうち肺結核患者の治療 成績についてコンピュータにより自動算出している。ま た,前年に登録された全結核患者の,次の年末時におけ る登録除外状況および除外理由についても保健所で入力 された情報を集計している。 本報告では,結核登録者情報調査年報の情報から,2014 年の結核登録患者の治療歴・受療状況,2013 年に新規に 登録された結核患者の入院・治療期間,コホート法によ る治療成績および登録除外状況からの死亡状況等につい て概観する。 治 療 歴 ( 1 )結核治療歴(Table 1) 2014 年に新規登録された活動性結核患者 19,615 人の 登録前治療歴を Table 1 に示す。再治療患者(結核の化 学療法による治療歴がある患者で,外科療法のみ等の場 合には含めない)は 1,179 人(前年 1,262 人)で,治療歴 不明患者(279 人)を除く全活動性結核患者の 6.1% であ った。また再治療者のうち 82 人で潜在性結核感染症治 療歴があり,前年 94 人から 12 人減少した。 ( 2 )再治療患者の前回治療開始年(Table 2) 2014 年に再治療となった結核患者 1,179 人の,前回治 療開始年についての集計を Table 2 に示す。比較的最近 の治療歴(2000 年以降)とかなり以前(1950 年代前後) の治療歴を有する結核患者数が多い傾向は,昨年度と同 じであった。 治療開始時の治療内容 ( 3 )治療開始時治療内容(Fig. 1) 2014 年に新規登録された全活動性結核患者 19,615 人 の,5 歳年齢階層別治療開始時化学療法内容を Fig. 1 に 示す(「化療なし」の患者には,診断前死亡や,全身状 態不良等で化学療法が不可能だった者,治療拒否者など が含まれると推察される)。イソニアジド(INH)・リフ ァンピシン(RFP)・ピラジナミド(PZA)+エタンブト ール(EB)またはストレプトマイシン(SM)〔HRZ+E/S〕 を用いる標準法による治療開始割合は,15 歳から 49 歳 までは 90% 前後であるが,それ以上の年齢で少しずつ減 少し,80 歳を境に著明に低下している傾向は以前と同じ であった。 受 療 状 況 ( 4 )受療状況(Fig. 2) 2014 年の新登録肺結核患者 15,149 人の治療開始時受 療状況について,5 歳年齢階層別にみたものを Fig. 2 に 示す(「入院」とは入院勧告の有無にかかわらず,「結核 の治療を主たる理由とする入院」の意味である)。新登 録肺結核患者の治療開始時受療状況のうちの入院治療割 合(%)が,50 歳以降で年齢階層が高くなるに従って増 加する傾向であった。 ( 5 )入院期間(Table 3) 2013 年新登録結核患者で結核治療を主たる理由に入 院となった者のうち,退院日(死亡退院を含む)の情報 公益財団法人結核予防会結核研究所 連絡先 : 大角晃弘・内村和広,公益財団法人結核予防会結核研 究所臨床・疫学部,〒 204 _ 8533 東京都清瀬市松山 3 _ 1 _ 24 (E-mail : tbsur@jata.or.jp)Table 2 Number of patients with TB on re-treatment, by year when previous TB treatment was initiated and age group, 2014
Year when previous TB
treatment initiated
Total
Age group (years) Previous TB
treatment regimen unknown (re-count) 0 _ 19 20 _ 29 30 _ 39 40 _ 49 50 _ 59 60 _ 69 70 _ 79 80+ Total _ 1949 1950 _ 59 1960 _ 69 1970 _ 79 1980 _ 89 1990 _ 99 2000 _ 09 2010 _ 14 1,179 101 136 82 46 39 71 236 468 16 0 0 0 0 0 1 4 11 52 0 0 0 0 0 2 12 38 68 0 0 0 0 0 6 23 39 88 0 0 0 0 4 9 27 48 110 0 1 0 4 4 15 30 56 182 0 5 15 19 13 21 40 69 258 10 36 37 13 10 9 50 93 405 91 94 30 10 8 8 50 114 374 82 87 47 31 26 32 46 23 2005 _ 2014 (re-count) 2005 2006 2007 2008 2009 2010 2011 2012 2013 2014 23 26 19 39 43 56 88 136 158 30 0 1 0 0 1 1 2 3 3 2 0 1 2 2 3 2 4 10 14 8 2 3 2 4 3 5 9 11 12 2 1 2 1 4 7 5 10 13 18 2 4 2 1 4 8 6 13 10 22 5 3 8 2 9 4 11 13 17 25 3 7 4 5 7 10 6 16 37 31 3 6 5 6 9 7 20 21 35 33 5 4 7 3 4 3 5 7 1 6 4 TB : tuberculosis
Table 1 Number of notified patients with tuberculosis according to treatment history and age group, 2014
Proportion of patients undergoing re-treatment for tuberculosis : those with an unknown treatment history were excluded. LTBI : Latent tuberculosis infection
Age group (years)
Newly notified patients with
tuberculosis
Treatment history Proportion of patients undergoing re-treatment for tuberculosis (%) New
Re-treatment
All Previous treatment of LTBI (re-count) Unknown Total 0 _ 4 5 _ 9 10 _ 14 15 _ 19 20 _ 24 25 _ 29 30 _ 34 35 _ 39 40 _ 44 45 _ 49 50 _ 54 55 _ 59 60 _ 64 65 _ 69 70 _ 74 75 _ 79 80 _ 84 85 _ 89 90+ 19,615 17 15 17 168 553 635 612 623 717 723 711 803 1,198 1,399 1,806 2,222 2,949 2,804 1,643 18,157 17 14 16 152 529 600 576 581 676 668 655 742 1,104 1,287 1,669 2,039 2,731 2,568 1,533 1,179 0 1 1 14 20 32 31 37 38 50 55 55 81 101 116 142 156 178 71 82 0 1 1 10 9 6 4 6 3 10 9 5 3 6 4 2 2 1 0 279 0 0 0 2 4 3 5 5 3 5 1 6 13 11 21 41 62 58 39 6.1 0.0 6.7 5.9 8.4 3.6 5.1 5.1 6.0 5.3 7.0 7.7 6.9 6.8 7.3 6.5 6.5 5.4 6.5 4.4
Fig. 1 Anti-tuberculosis drugs upon notification by age group in 2014 0 _ _5 10 _ 15 _ 20 _ 25 _ 30 _ 35 _ 40 _ 45 _ 50 _ 55 _ 60 _ 65 _ 70 _ 75 _ 80 _ 85 _ 90+ 100 90 80 70 60 50 40 30 20 10 0 % H : isoniazid R : rifampicin Z : pyrazinamide E : ethambutol S : streptomycin Total Unknown drugs No treatment
Other combination of drugs
Other combination of 3 or more drugs, including H and R
HRZ+E/S HRZ
Age group (years)
Table 3 Duration of hospitalization among newly notified patients with tuberculosis in 2013
*Duration of hospitalization among those hospitalized with tuberculosis and with a known date of discharge. TB : tuberculosis 100 90 80 70 60 50 40 30 20 10 0 Total 0 _ 5 _ 10 _ 15 _ 20 _ 25 _ 30 _ 35 _ 40 _ 45 _ 50 _ 55 _ 60 _ 65 _ 70 _ 75 _ 80 _ 85 _ 90+ %
Not treated / Unknown Outpatients
Hospitalized mainly due to other diseases Hospitalized for tuberculosis treatment
Age group (years)
Fig. 2 Proportion of outpatients and hospitalized patients by age group in 2014 (n =15,149)
Newly notified patients with tuberculosis
Total
Patients with pulmonary tuberculosis
Patients with extra-pulmonary tuberculosis Sub-total
Sputum-smear positive Other bacteriolo-gically positive Bacteriolo-gically negative and others New Re-treatment Total number of newly notified patients with TB
Number of hospitalized patients with TB Median (days)*
[1st quartile, 3rd quartile] (days)*
20,435 10,296 62 [34, 100] 15,941 8,974 63 [36, 100] 7,600 6,828 66 [39, 104] 529 467 67 [41, 102] 5,478 1,399 45 [23, 81] 2,334 280 30 [16, 67] 4,494 1,322 43 [20, 89] が入力されている者についての入院期間を,総合患者分 類別(肺結核・肺外結核別,肺結核の場合は喀痰塗抹陽 性・その他結核菌陽性・菌陰性およびその他別,喀痰塗 抹陽性肺結核の場合は初回治療および再治療別)に集計 して中央値を代表値として示した。これらの数値は前年 と比較して概ね減少傾向を認めており,全活動性結核・ 全肺結核において,前年と 2014 年とでそれぞれ,64 日 から 62 日・66 日から 63 日になっていた。
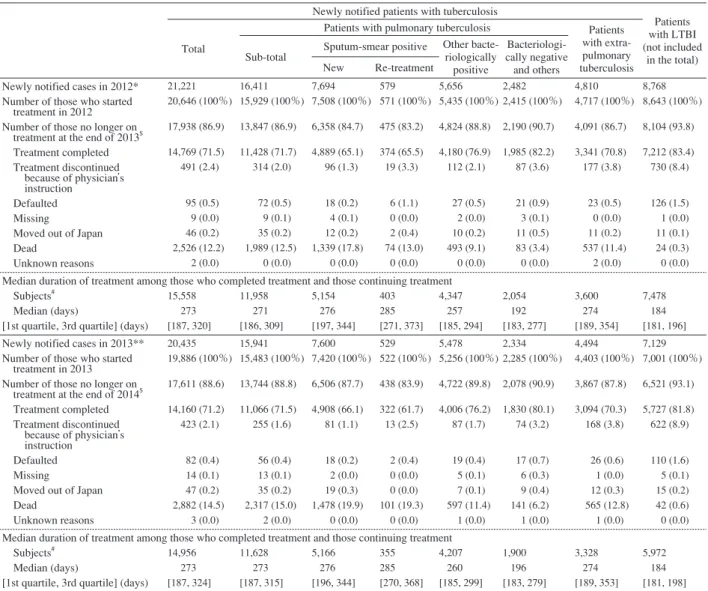
Table 4 Reasons for not continuing treatment 1 year after commencing treatment, and treatment duration among those newly notified in 2012 and 2013, by patient classification
*Based on the annual report database in 2013. **Based on the annual report database in 2014. $As registered by the public health center.
#
Subjects : those who completed tuberculosis treatment or those who were continuing treatment at the end of the time period (2013/2014). LTBI : latent tuberculosis infection
Newly notified patients with tuberculosis
Patients with LTBI (not included
in the total) Total
Patients with pulmonary tuberculosis Patients with extra-pulmonary tuberculosis Sub-total Sputum-smear positive
Other bacte-riologically positive Bacteriologi-cally negative and others New Re-treatment
Newly notified cases in 2012* Number of those who started treatment in 2012 Number of those no longer on treatment at the end of 2013$
Treatment completed Treatment discontinued because of physician’s instruction Defaulted Missing
Moved out of Japan Dead Unknown reasons 21,221 20,646 (100%) 17,938 (86.9) 14,769 (71.5) 491 (2.4) 95 (0.5) 9 (0.0) 46 (0.2) 2,526 (12.2) 2 (0.0) 16,411 15,929 (100%) 13,847 (86.9) 11,428 (71.7) 314 (2.0) 72 (0.5) 9 (0.1) 35 (0.2) 1,989 (12.5) 0 (0.0) 7,694 7,508 (100%) 6,358 (84.7) 4,889 (65.1) 96 (1.3) 18 (0.2) 4 (0.1) 12 (0.2) 1,339 (17.8) 0 (0.0) 579 571 (100%) 475 (83.2) 374 (65.5) 19 (3.3) 6 (1.1) 0 (0.0) 2 (0.4) 74 (13.0) 0 (0.0) 5,656 5,435 (100%) 4,824 (88.8) 4,180 (76.9) 112 (2.1) 27 (0.5) 2 (0.0) 10 (0.2) 493 (9.1) 0 (0.0) 2,482 2,415 (100%) 2,190 (90.7) 1,985 (82.2) 87 (3.6) 21 (0.9) 3 (0.1) 11 (0.5) 83 (3.4) 0 (0.0) 4,810 4,717 (100%) 4,091 (86.7) 3,341 (70.8) 177 (3.8) 23 (0.5) 0 (0.0) 11 (0.2) 537 (11.4) 2 (0.0) 8,768 8,643 (100%) 8,104 (93.8) 7,212 (83.4) 730 (8.4) 126 (1.5) 1 (0.0) 11 (0.1) 24 (0.3) 0 (0.0) Median duration of treatment among those who completed treatment and those continuing treatment
Subjects# 15,558 11,958 5,154 403 4,347 2,054 3,600 7,478
Median (days) 273 271 276 285 257 192 274 184
[1st quartile, 3rd quartile] (days) [187, 320] [186, 309] [197, 344] [271, 373] [185, 294] [183, 277] [189, 354] [181, 196]
Newly notified cases in 2013** 20,435 15,941 7,600 529 5,478 2,334 4,494 7,129
Number of those who started 19,886 (100%) 15,483 (100%) 7,420 (100%) 522 (100%) 5,256 (100%) 2,285 (100%) 4,403 (100%) 7,001 (100%) treatment in 2013
Number of those no longer on 17,611 (88.6) 13,744 (88.8) 6,506 (87.7) 438 (83.9) 4,722 (89.8) 2,078 (90.9) 3,867 (87.8) 6,521 (93.1) treatment at the end of 2014$
Treatment completed 14,160 (71.2) 11,066 (71.5) 4,908 (66.1) 322 (61.7) 4,006 (76.2) 1,830 (80.1) 3,094 (70.3) 5,727 (81.8) Treatment discontinued 423 (2.1) 255 (1.6) 81 (1.1) 13 (2.5) 87 (1.7) 74 (3.2) 168 (3.8) 622 (8.9) because of physician’s instruction Defaulted 82 (0.4) 56 (0.4) 18 (0.2) 2 (0.4) 19 (0.4) 17 (0.7) 26 (0.6) 110 (1.6) Missing 14 (0.1) 13 (0.1) 2 (0.0) 0 (0.0) 5 (0.1) 6 (0.3) 1 (0.0) 5 (0.1) Moved out of Japan 47 (0.2) 35 (0.2) 19 (0.3) 0 (0.0) 7 (0.1) 9 (0.4) 12 (0.3) 15 (0.2) Dead 2,882 (14.5) 2,317 (15.0) 1,478 (19.9) 101 (19.3) 597 (11.4) 141 (6.2) 565 (12.8) 42 (0.6) Unknown reasons 3 (0.0) 2 (0.0) 0 (0.0) 0 (0.0) 1 (0.0) 1 (0.0) 1 (0.0) 0 (0.0) Median duration of treatment among those who completed treatment and those continuing treatment
Subjects# 14,956 11,628 5,166 355 4,207 1,900 3,328 5,972
Median (days) 273 273 276 285 260 196 274 184
[1st quartile, 3rd quartile] (days) [187, 324] [187, 315] [196, 344] [270, 368] [185, 299] [183, 279] [189, 353] [181, 198] 治療成績 ( 7 )肺結核患者分類別の治療成績(Table 5.1,Table 5.2,Table 6) 2013 年新登録肺結核患者をコホートとする治療成績 は,菌培養検査結果・受療状況・治療終了理由・登録除 外理由等から,コンピュータにより 17 区分に自動で分 類され(2010 年までは 15 区分,Table 6),各項目の定義 は Table 6 に記載されている。結核年報では「治療成功」 から「判定不能」までの 7 区分にまとめているが,本稿 では追加して,外国出生肺結核患者について別掲した。 総合患者分類別でみた「治療成功 Treatment success」 (「治癒 Cure」と「治療完了 Treatment completed」を合わ
せたもの)の新登録肺結核患者全体と外国出生肺結核患 者とにおける割合は,全肺結核でそれぞれ 53.7%・63.7 ( 6 )治療終了状況と治療期間(Table 4) 2012 年と 2013 年に新規登録された全結核患者と潜在 性結核感染者について,患者総数と治療を開始した患者 総数,さらに,それぞれ 2013 年末と 2014 年末における 治療の転帰〔治療終了(完遂),治療中止(指示),自己 中止,(海外居住者の)帰国,死亡,不明〕と治療期間を Table 4 に示している。 新規登録された患者の次年末時における治療完遂率は, 全結核患者と潜在性結核感染症治療対象者において,2012 年登録患者でそれぞれ 71.5%・83.4%,2013 年登録患者で 71.2%・81.8% であった。治療期間の中央値は,2012 年登 録全患者と 2013 年登録全患者でともに 273 日,肺結核喀 痰塗抹陽性初回治療患者でともに 276 日であった。
Table 5.1 Treatment outcomes of newly notified patients with pulmonary tuberculosis (PTB) by patient classification, 2013 year cohort―all patients with PTB
Patients with pulmonary tuberculosis
Total Sputum-smear positive Other bacteriologi-cally positive negative and othersBacteriologically New Re-treatment
New patients with pulmonary TB 15,941 (100%) 7,600 (100%) 529 (100%) 5,478 (100%) 2,334 (100%) Treatment outcomes (*) 1. Treatment success Cure Treatment completed Treatment completed 1 Treatment completed 2 2. Died 3. Treatment failed 4. Lost to follow-up Lost to follow-up 1 Lost to follow-up 2 5. Transfer out 6. Still on treatment Still on treatment 1 Still on treatment 2 Still on treatment 3 Still on treatment 4 7. Unclassifi ed Unclassified 1 Unclassified 2 Unclassified 3 Unclassified 4 Unclassified 5 8,554 2,362 6,192 4,217 1,975 2,632 65 1,101 321 780 498 1,469 301 228 619 321 1,622 431 88 481 93 529 53.7 14.8 38.8 26.5 12.4 16.5 0.4 6.9 2.0 4.9 3.1 9.2 1.9 1.4 3.9 2.0 10.2 2.7 0.6 3.0 0.6 3.3 3,769 1,415 2,354 1,744 610 1,640 45 334 132 202 241 847 170 121 382 174 724 166 57 259 33 209 49.6 18.6 31.0 22.9 8.0 21.6 0.6 4.4 1.7 2.7 3.2 11.1 2.2 1.6 5.0 2.3 9.5 2.2 0.8 3.4 0.4 2.8 221 85 136 95 41 114 4 25 9 16 27 74 18 6 39 11 64 8 5 22 5 24 41.8 16.1 25.7 18.0 7.8 21.6 0.8 4.7 1.7 3.0 5.1 14.0 3.4 1.1 7.4 2.1 12.1 1.5 0.9 4.2 0.9 4.5 3,123 638 2,485 1,161 1,324 701 14 496 116 380 139 423 90 79 146 108 582 210 21 133 32 186 57.0 11.6 45.4 21.2 24.2 12.8 0.3 9.1 2.1 6.9 2.5 7.7 1.6 1.4 2.7 2.0 10.6 3.8 0.4 2.4 0.6 3.4 1,441 224 1,217 1,217 0 177 2 246 64 182 91 125 23 22 52 28 252 47 5 67 23 110 61.7 9.6 52.1 52.1 0.0 7.6 0.1 10.5 2.7 7.8 3.9 5.4 1.0 0.9 2.2 1.2 10.8 2.0 0.2 2.9 1.0 4.7 *Treatment outcomes : See definitions in Table 6.
Table 5.2 Treatment outcomes of newly notified patients with pulmonary tuberculosis (PTB) by patient classification, 2013 year cohort―foreign-born patients with PTB
Patients with pulmonary tuberculosis Total Sputum-smear positive Other
bacteriologi-cally positive
Bacteriologically negative and others New Re-treatment
New patients with pulmonary TB 848 (100%) 289 (100%) 19 (100%) 285 (100%) 255 (100%) Treatment outcomes (*) 1. Treatment success Cure Treatment completed Treatment completed 1 Treatment completed 2 2. Died 3. Treatment failed 4. Lost to follow-up Lost to follow-up 1 Lost to follow-up 2 5. Transfer out 6. Still on treatment Still on treatment 1 Still on treatment 2 Still on treatment 3 Still on treatment 4 7. Unclassifi ed Unclassified 1 Unclassified 2 Unclassified 3 Unclassified 4 Unclassified 5 540 119 421 286 135 14 3 50 14 36 126 55 20 6 22 7 60 10 2 17 5 26 63.7 14.0 49.6 33.7 15.9 1.7 0.4 5.9 1.7 4.2 14.9 6.5 2.4 0.7 2.6 0.8 7.1 1.2 0.2 2.0 0.6 3.1 172 53 119 80 39 8 2 9 3 6 56 27 12 2 8 5 15 1 2 4 0 8 59.5 18.3 41.2 27.7 13.5 2.8 0.7 3.1 1.0 2.1 19.4 9.3 4.2 0.7 2.8 1.7 5.2 0.3 0.7 1.4 0.0 2.8 7 1 6 5 1 2 0 0 0 0 6 3 1 0 0 2 1 1 0 0 0 0 36.8 5.3 31.6 26.3 5.3 10.5 0.0 0.0 0.0 0.0 31.6 15.8 5.3 0.0 0.0 10.5 5.3 5.3 0.0 0.0 0.0 0.0 191 31 160 65 95 3 1 22 5 17 31 14 6 1 7 0 23 6 0 3 4 10 67.0 10.9 56.1 22.8 33.3 1.1 0.4 7.7 1.8 6.0 10.9 4.9 2.1 0.4 2.5 0.0 8.1 2.1 0.0 1.1 1.4 3.5 170 34 136 136 0 1 0 19 6 13 33 11 1 3 7 0 21 2 0 10 1 8 66.7 13.3 53.3 53.3 0.0 0.4 0.0 7.5 2.4 5.1 12.9 4.3 0.4 1.2 2.7 0.0 8.2 0.8 0.0 3.9 0.4 3.1 *Treatment outcomes : See definitions in Table 6.
Table 6 Treatment outcomes of newly notified patients with sputum-smear positive pulmonary tuberculosis. 2007 _ 2013 year cohorts, %
*There were two categories of “Still on treatment” in the 2010 cohorts. Since 2011, the categories have been divided into four as indicated above. INH : isoniazid, RFP : rifampicin
Treatment outcomes Definition 2007 2008 2009 2010 2011 2012 2013
n = 9,421 8,999 8,772 8,242 7,736 7,694 7,600 1. Cure A patient who completed treatment within 12 months and
whose sputum culture tests were negative at least two times (one of the negative culture results was within 3 months before the completion of treatment).
16.9% 17.6% 20.7% 20.1% 20.0% 18.4% 18.6%
2. Treatment completed 1
A patient who completed treatment within 12 months but had only one negative sputum culture result.
24.9 26.8 27.2 27.4 20.7 20.9 22.9
3. Treatment completed 2
A patient who completed treatment within 12 months but did not have a negative sputum culture result.
3.8 3.4 3.9 4.5 9.9 10.1 8.0
4. Died A patient who died for any reason during the course of treatment.
18.4 19.1 19.3 20.8 21.6 22.6 21.6
5. Treatment failed
A patient whose sputum culture was positive at 5 months or later during the course of treatment.
1.0 1.1 0.9 0.7 0.7 0.7 0.6
6. Lost to follow-up 1
A patient whose treatment was interrupted for 60 days (or two consecutive months) or more.
0.7 0.6 0.8 0.6 1.1 1.4 1.7
7. Lost to follow-up 2
A patient whose treatment was stopped by physician’s instruction before completing standard treatment.
4.3 3.2 2.9 2.3 2.2 2.3 2.7
8. Transfer out A patient who has been transferred out of the region where the patient was initially registered.
3.2 2.8 3.3 3.0 3.2 3.0 3.2
9. Still on treatment 1
A patient who stopped INH and/or RFP and was still on treatment after 12 months.
1.7 1.4 2.0 1.6 1.8 1.9 2.2
10. Still on treatment 2*
A patient who has been on treatment with INH and/or RFP and was still on treatment after 12 months due possibly to treatment interruption.
10.3 10.5 8.8 8.3 1.3 1.4 1.6
11. Still on treatment 3
A patient who has been on treatment with INH and/or RFP and was still on treatment after 12 months without treatment interruption.
4.1 4.0 5.0
12. Still on treatment 4
A patient who has been on treatment with INH and/or RFP and was still on treatment after 12 months due to unknown reasons.
3.9 3.2 2.3
13. Unclassified 1 A patient who did not start tuberculosis treatment (due mostly to early death).
1.9 2.2 2.1 2.1 0.7 2.4 2.2
14. Unclassified 2 A patient whose initial treatment regimen was unknown. 4.3 3.9 1.4 1.2 1.0 0.6 0.8
15. Unclassified 3 A patient whose treatment regimen was other than the standard.
2.5 2.7 2.5 2.7 4.1 3.6 3.4
16. Unclassified 4 A patient who stopped INH and/or RFP but completed treatment within 12 months.
1.1 1.1 1.3 1.1 0.4 0.4 0.4
17. Unclassified 5 A patient whose information was insufficient for classi-fying treatment outcome.
5.1 3.8 2.9 3.5 3.1 3.1 2.8 %,「喀痰塗抹陽性初回治療」では 49.6%・59.5%,「同再 治療」で 41.8%・36.8%,「他結核菌陽性」で 57.0%・67.0 %,「結核菌陰性・その他」で 61.7%・66.7% であった。 新登録肺結核初回治療患者全体と外国出生肺結核初回治 療患者とにおける「死亡 Died」(理由は問わず結核治療 中に死亡した場合)の割合は,「喀痰塗抹陽性初回治療」 でそれぞれ 21.6%・2.8%,「同再治療」で 21.6%・10.5% と, 外国出生肺結核患者ではかなり低率であった。初回患者 全体での死亡割合が高いのは,高齢者における死亡割合 が高い傾向の影響が大きい(情報は示さず)。「脱落・中 断 Lost to follow-up」の割合は,「喀痰塗抹陽性初回治療」 で 4.4%・3.1%,「同再治療」で 4.7%・ 0 % といずれも 5 % 未満であったが,「転出 Transfer out」(治療中に当該保 健所管轄地域外へ転出した場合)の割合は,「喀痰塗抹 陽性初回治療」で 3.2%・19.4%,「同再治療」で 5.1%・ 31.6% で,外国出生肺結核患者でより高い傾向があった。 肺結核患者全体での「12 カ月を超える治療 Still on treatment」の割合は,「喀痰塗抹陽性初回治療」(11.1%) と比較して,「喀痰塗抹陽性再治療」では 14.0% と高い 傾向は前年と同様であった。コンピュータによる自動治 療成績分析で「判定不能 Unclassified」と分類されたのは 全体で 1,622 人(10.2%)であり,結核治療を開始しなか った「判定不能 1 」が 431 人(2.7%),非標準治療により 治療を開始した「判定不能 3 」が 481 人(3.0%),治療成
Fig. 3 Treatment outcomes of newly notified patients with sputum-smear positive pulmonary tuberculosis by age group, 2013 year cohort (%)
..... ... . . . .. . . . . . . .. . . . 0 _ 19 ( 44) 20 _ 29 ( 344) 30 _ 39 ( 394) 40 _ 49 ( 499) 50 _ 59 ( 609) 60 _ 69 (1,042) 70 _ 79 (1,582) 80 _ 89 (2,427) 90+ ( 659) 0 20 40 60 80 100% Total (7,600) 24.7 34.9 51.2 57.3 66.2 74.5 72.8 73.5 81.8 49.6 21.6 0.64.4 3.2 11.1 9.5 0.0 4.7 0.0 14.2 4.5 4.9 9.1 2.6 4.5 Age group, years old (n)
Treatment success Died Treatment failed Lost to follow-up Transfer out Still on treatment Unclassified
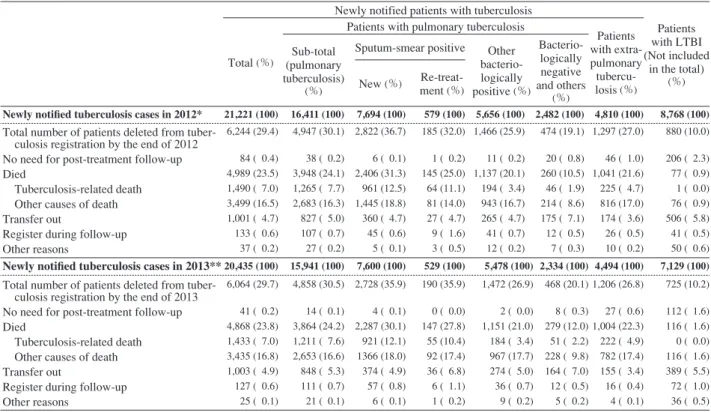
46.7 33.0 21.6 13.1 5.9 0.0 0.4 0.4 1.4 0.5 4.7 4.7 4.5 4.4 3.3 0.9 2.2 1.8 3.2 4.1 6.8 12.0 12.5 13.2 12.3 16.1 12.8 8.0 7.4 7.7 2.8 1.0 1.2 1.3 3.6 4.8 3.4 6.6 8.2 9.4 6.2 4.1 績判定のための情報が不足していた「判定不能 5 」が 529 人(3.3%)であった(Table 5.1)。 Table 6 にコンピュータによる自動治療成績 17 区分の各 定義と,喀痰塗抹陽性初回治療肺結核患者として,2007 年以降の各年に登録された患者の治療成績割合の推移を 示した。「治癒 Cure」・「治療完了 1 Treatment completed 1」 ・「治療完了 2 Treatment completed 2」を合わせた「治療 成功 Treatment success」は約 50% で横ばい傾向であり, 「死亡 Died」の割合は,2010 年以降 20% 以上となってい るが1),「脱落 1」・「脱落 2」を合わせた「脱落・中断 Lost to follow-up」は,2007 年以降 5 % 以下を維持している。 ( 8 )年齢階層別治療成績(Fig. 3) Fig. 3 は,2013 年に登録された喀痰塗抹陽性初回治療 肺結核患者 7,600 人について,年齢階層別に治療成績を 比較したものである。「死亡 Died」割合は,30 歳代で 1.0%,40 歳代で 2.8% と低率であるが,60 歳代・70 歳代・ 80 歳代・90 歳以上ではそれぞれ 13.1%・21.6%・33.0%・ 46.7% と,高齢層ほど割合が高くなっている。加齢によ り死亡する割合が高くなるためと推定される。「12 カ月 を超える治療 Still on treatment」の割合は 50 歳代から 80 歳代で高く,治療中の他保健所への「転出 Transfer out」 の割合は 20 歳代で最も高かった。 転帰と死亡 ( 9 )転帰(Table 7) Table 7 は,2013 年と 2014 年の結核登録者情報調査年 報の情報を用いて,2012 年と 2013 年に新規登録された 全結核患者と潜在性結核感染症治療対象者について,そ れぞれ 2013 年末と 2014 年末までの登録除外状況をみた ものである。喀痰塗抹陽性肺結核患者では「死亡」で除 外される割合が高く,初回治療者でそれぞれ 31.3%・30.1 %,再治療者で 25.0%・27.8% であった。「登録中の再登 録 Register during follow-up」(結核登録者情報調査登録 中に再排菌等で再治療となり,改めて登録されるもの) の割合は,喀痰塗抹陽性肺結核の初回治療では,それぞ れ 0.6%・0.8%,再治療で 1.6%・1.1% と低率を維持して いた。 (10)死亡(Fig. 4) Fig. 4 は,Table 7 における 2013 年新登録全結核患者 20,435 人を対象に,治療開始時から 1 年(365 日)後まで の月単位(30日)の累積死亡者数割合について,「結核死 亡」と「他死亡」とに分けて図示したものである。全結 核患者では,治療開始後 1 カ月以内に 7.9%,2 カ月以内 に 10.6%,3 カ月以内に 12.9% が死亡し,1 年以内には累 積で 21.5%(4,402 人)が死亡していた。喀痰塗抹陽性初 回治療肺結核患者(7,600 人)では,治療開始後 1 カ月以 内に 10.6%,2 カ月以内に 14.5%,3 カ月以内に 17.5%, 1 年以内には累積で 27.5%(2,087 人)が死亡していた。 お わ り に 2014 年の結核登録情報システムの年報情報を基に, 活動性結核患者の治療状況と治療成績について概観し た。PZA を用いる標準的結核治療が開始される割合が, 80 歳を境に著明に低下しており,高齢者への PZA 投与 を控える傾向は継続している。結核患者の入院治療期間 はわずかながら前年と比較して短くなっている傾向を示 したが,治療期間についてはほとんど変化していなかっ た。
Fig. 4 Cumulative proportion of deaths by duration of treatment―Newly notified patients with tuberculosis in 2013 *Includes patients who died before the commencement of treatment.
TB : tuberculosis Days (%) 30 25 20 15 10 5 0 _ 30* _60 _ 90 _ 120 _ 150 _ 180 _ 210 _ 240 _ 270 _ 300 _ 330 _ 365 Days (%) 30 25 20 15 10 5 0 _ 30* _ 60 _ 90 _ 120 _ 150 _ 180 _ 210 _ 240 _ 270 _ 300 _ 330 _ 365 Days (%) 30 25 20 15 10 5 0 _ 30* _60 _ 90 _ 120 _ 150 _ 180 _ 210 _ 240 _ 270 _ 300 _ 330 _ 365 All types of
patients with tuberculosis New patients with sputum-smear positive pulmonary tuberculosis positive pulmonary tuberculosis Patients with sputum-smear on re-treatment 7.9 10.6 12.9 21.5 10.6 14.5 17.5 27.5 7.2 11.0 14.4 25.3 Death because of other causes TB-related death Table 7 Patients deleted from tuberculosis registration by the end of years (in 2013 and in 2014) ― Patients with tuberculosis and LTBI notified in the previous years (in 2012 and in 2013, respectively) ―
Newly notified patients with tuberculosis
Patients with LTBI (Not included in the total) (%) Total (%)
Patients with pulmonary tuberculosis
Patients with extra-pulmonary tubercu-losis (%) Sub-total (pulmonary tuberculosis) (%)
Sputum-smear positive Other bacterio-logically positive (%) Bacterio-logically negative and others (%) New (%) Re-treat-ment (%)
Newly notifi ed tuberculosis cases in 2012* 21,221 (100) 16,411 (100) 7,694 (100) 579 (100) 5,656 (100) 2,482 (100) 4,810 (100) 8,768 (100)
Total number of patients deleted from tuber- culosis registration by the end of 2012 No need for post-treatment follow-up Died
Tuberculosis-related death Other causes of death Transfer out
Register during follow-up Other reasons 6,244 (29.4) 84 ( 0.4) 4,989 (23.5) 1,490 ( 7.0) 3,499 (16.5) 1,001 ( 4.7) 133 ( 0.6) 37 ( 0.2) 4,947 (30.1) 38 ( 0.2) 3,948 (24.1) 1,265 ( 7.7) 2,683 (16.3) 827 ( 5.0) 107 ( 0.7) 27 ( 0.2) 2,822 (36.7) 6 ( 0.1) 2,406 (31.3) 961 (12.5) 1,445 (18.8) 360 ( 4.7) 45 ( 0.6) 5 ( 0.1) 185 (32.0) 1 ( 0.2) 145 (25.0) 64 (11.1) 81 (14.0) 27 ( 4.7) 9 ( 1.6) 3 ( 0.5) 1,466 (25.9) 11 ( 0.2) 1,137 (20.1) 194 ( 3.4) 943 (16.7) 265 ( 4.7) 41 ( 0.7) 12 ( 0.2) 474 (19.1) 20 ( 0.8) 260 (10.5) 46 ( 1.9) 214 ( 8.6) 175 ( 7.1) 12 ( 0.5) 7 ( 0.3) 1,297 (27.0) 46 ( 1.0) 1,041 (21.6) 225 ( 4.7) 816 (17.0) 174 ( 3.6) 26 ( 0.5) 10 ( 0.2) 880 (10.0) 206 ( 2.3) 77 ( 0.9) 1 ( 0.0) 76 ( 0.9) 506 ( 5.8) 41 ( 0.5) 50 ( 0.6) Newly notifi ed tuberculosis cases in 2013**20,435 (100) 15,941 (100) 7,600 (100) 529 (100) 5,478 (100) 2,334 (100) 4,494 (100) 7,129 (100)
Total number of patients deleted from tuber- culosis registration by the end of 2013 No need for post-treatment follow-up Died
Tuberculosis-related death Other causes of death Transfer out
Register during follow-up Other reasons 6,064 (29.7) 41 ( 0.2) 4,868 (23.8) 1,433 ( 7.0) 3,435 (16.8) 1,003 ( 4.9) 127 ( 0.6) 25 ( 0.1) 4,858 (30.5) 14 ( 0.1) 3,864 (24.2) 1,211 ( 7.6) 2,653 (16.6) 848 ( 5.3) 111 ( 0.7) 21 ( 0.1) 2,728 (35.9) 4 ( 0.1) 2,287 (30.1) 921 (12.1) 1366 (18.0) 374 ( 4.9) 57 ( 0.8) 6 ( 0.1) 190 (35.9) 0 ( 0.0) 147 (27.8) 55 (10.4) 92 (17.4) 36 ( 6.8) 6 ( 1.1) 1 ( 0.2) 1,472 (26.9) 2 ( 0.0) 1,151 (21.0) 184 ( 3.4) 967 (17.7) 274 ( 5.0) 36 ( 0.7) 9 ( 0.2) 468 (20.1) 8 ( 0.3) 279 (12.0) 51 ( 2.2) 228 ( 9.8) 164 ( 7.0) 12 ( 0.5) 5 ( 0.2) 1,206 (26.8) 27 ( 0.6) 1,004 (22.3) 222 ( 4.9) 782 (17.4) 155 ( 3.4) 16 ( 0.4) 4 ( 0.1) 725 (10.2) 112 ( 1.6) 116 ( 1.6) 0 ( 0.0) 116 ( 1.6) 389 ( 5.5) 72 ( 1.0) 36 ( 0.5)
*Based on the annual report database in 2013. **Based on the annual report database in 2014. LTBI : latent tuberculosis infection
コンピュータでの自動分析による喀痰塗抹陽性初回治 療肺結核患者の治療成績では,同肺結核患者全体の「治 療成功」は約 50%,「脱落・中断」および「転出」は各 5.0% 以下であるが,「死亡」割合は 21.6% を占め,60 歳 代・70 歳代・80 歳代・90 歳以上ではそれぞれ 13.1%・ 21.6%・33.0%・46.7% と,高齢者において高い傾向は例 年どおりであった。一方,外国出生の同肺結核患者にお いては,「治療成功」は約 60%,「脱落・中断」は 4.0% 以 下,「死亡」は 3 % 未満と低率であったが,「転出」は 19.4 % と高かった。 文 献 1 ) 結核研究所疫学情報センター:結核年報 2013(4)治療・ 治療成績. 結核. 2015 ; 90 : 595 604.
−−−−−−−−Report and Information−−−−−−−−
TUBERCULOSIS ANNUAL REPORT 2014
─ (4) Tuberculosis Treatment and Treatment Outcomes ─
Tuberculosis Surveillance Center (TSC), RIT, JATA
Abstract In this article, we reviewed data regarding the previous treatment history, regimen types, and hospitalization status of tuberculosis (TB) patients newly notified in 2014. The duration of treatment and hospitalization, and the treat-ment outcomes of TB patients notified in 2013 were also eval-uated by using a cohort analysis.
Of the 19,615 newly notified TB patients in 2014, 1,179 had a previous history of TB treatment. Approximately 90% of all TB patients aged 15_49 years were treated with iso-niazid, rifampicin, pyrazinamide, and ethambutol (or strepto-mycin), which is the globally recommended regimen for initial treatment. However, the proportion of patients receiv-ing the standard regimen decreased with their increasreceiv-ing age, and sharply dropped for those aged ≧80 years. Of 15,149 patients with pulmonary TB (PTB), more than 50% of those aged ≧50 years were hospitalized at the beginning of the TB treatment; the proportion of those hospitalized in each age group increased with the increasing age of the patients. At the end of 2014, the median durations of hospitalization and treatment for all forms of TB notified in 2013 were 62 and 273 days, respectively. For cases notified in 2013, the rates of treatment success for patients with new sputum smear-positive PTB (n=7,600) and for those on re-treatment (n= 529) were 49.6% and 41.8%, respectively. In addition, the
treatment success rates for foreign-born patients with new sputum smear-positive PTB (n=289), and those on re-treatment (n=19) were 59.5% and 36.8%, respectively. The rates lost to follow-up for patients with new sputum smear-positive PTB and those undergoing re-treatment were well below 5% when considering the total number of patients (both foreign-born and Japan-born), as well as only the foreign-born patients. The death rate among all new sputum smear-positive PTB patients was 21.6%, and the rates were relatively higher in the age groups 60_69, 70_79, 80_89, and ≧90 years (13.1%, 21.6%, 33.0%, and 46.7%, respectively).
Key words : Tuberculosis, Treatment history, Treatment status, Duration of treatment, Treatment outcomes
Research Institute of Tuberculosis (RIT), Japan Anti-Tubercu-losis Association (JATA)
Correspondence to: Akihiro Ohkado and Kazuhiro Uchimura, Department of Epidemiology and Clinical Research, Research Institute of Tuberculosis (RIT), JATA, 3_1_24, Matsuyama, Kiyose-shi, Tokyo 204_8533 Japan.