Corresponding author: Yasuaki Hirooka, MD, PhD yhirooka@med.tottori-u.ac.jp
Received 2016 July 27 Accepted 2016 September 1
Abbreviations: AUC, area under the curve; CEUS, contrast-en-hanced ultrasonography; CT, computed tomography; PD, progressive disease; PR, partial response; RECIST, response evaluation criteria in solid tumors; ROC, rate of change; TIC, time-intensity curve ABSTRACT
Background The therapeutic effect of chemotherapy for liver metastases is currently determined by changes in tumor diameter depicted on computed tomography (CT) and magnetic resonance imaging, but it cannot accurately determine if there is central necrosis. Furthermore, due to the risk of radiation exposure and high cost, frequent examination using these methods places a heavy burden on patients. Meanwhile, real-time observation of blood flow and vessel morphology within tumors has become possible by contrast-enhanced ultrasonography (CEUS). However, use of CEUS in evaluating the therapeutic effect of anticancer chemotherapy has rarely been inves-tigated. This study investigated whether changes in the time-intensity curve (TIC) of CEUS are useful indicators of the therapeutic effect of chemotherapy.
Methods Five patients with liver metastases who had undergone CEUS before and after chemotherapy were included in this study. The TIC of each time point was prepared to examine whether the following five TIC parameters serve as indicators of the therapeutic effect of chemotherapy: peak intensity, time to wash-in, time to peak intensity, slope of wash-in, and area under the curve. In each parameter, rate of change (ROC) was cal-culated by the expression [(values before chemotherapy minus those after chemotherapy)/those before chemo-therapy × 100(%)].
Results (i) Among the five TIC parameters tested, ROC of the slope of wash-in and the area under the curve reflected the therapeutic effect of chemotherapy better than the remaining three parameters. (ii) TIC pa-rameters after one cycle of chemotherapy were examined in two of five patients, and changes in the slope of wash-in and the area under the curve were wash-in good agreement with the computed tomography findings indicative of the
therapeutic effect after the fourth chemotherapy cycle.
Conclusion The findings of this study suggest that ROC of the slope of wash-in and the area under the curve of the TIC are useful in evaluating the therapeutic effect of chemotherapy. Furthermore, there is a possibil-ity that TIC analysis may enable early prediction of the therapeutic effect.
Key words liver; neoplasm metastases; Sonazoid; time intensity curve; ultrasonography
The therapeutic effect of chemotherapy for liver me-tastases is currently determined by changes in tumor diameter depicted on computed tomography (CT) and magnetic resonance imaging, but it cannot accurately determine if there is central necrosis. Frampas et al. reported that it was possible to predict the therapeutic effect by the change in tumor blood flow using dynamic CT.1 However, due to the risk of radiation exposure and
high cost, frequent examination using these methods places a heavy burden on patients.
Meanwhile, real-time observation of blood flow and vessel morphology within tumors has become possible by contrast-enhanced ultrasonography (CEUS). Lassau et al.2, 3 reported that the time-intensity curve (TIC)
param-eters obtained from CEUS of tumors correlated well with the prognosis. Furthermore, Frampas et al.1 reported that
the area under the curve (AUC), one of the TIC param-eters, was useful for assessing the blood flow. However, use of CEUS in evaluating the therapeutic effect of anti-cancer chemotherapy has rarely been investigated. This study investigated whether changes in the TIC of CEUS are useful indicators of the therapeutic effect of chemo-therapy. Lassau et al. reported that the TIC parameters obtained from CEUS of tumors correlated well with the prognosis.2, 3 Furthermore, Frampas et al. reported that
AUC, one of the TIC parameters, was useful for assess-ing the blood flow.1 However, use of CEUS in evaluating
the therapeutic effect of anticancer chemotherapy has rarely been investigated. This study investigated whether changes in the TIC of CEUS are useful indicators of the therapeutic effect of chemotherapy.
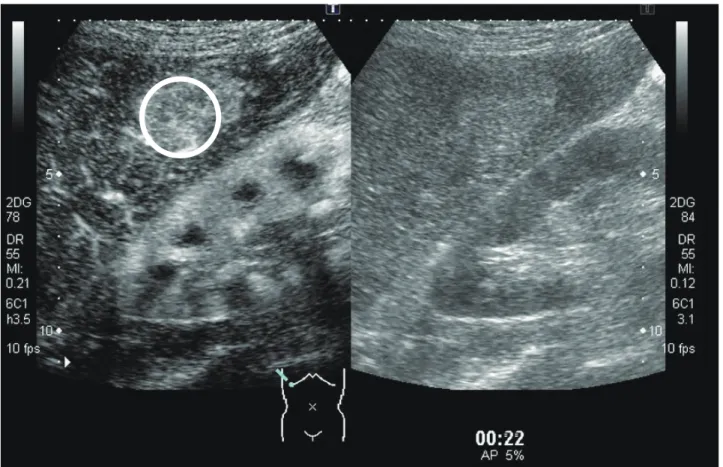
Fig. 1. ROI of the tumor. Circle indicates the ROI. Right image: B-mode. Left image: CEUS-mode. CEUS, contrast-enhanced ultrasonog-raphy; ROI, region of interest.
SUBJECTS AND METHODS
Five patients with liver metastases from digestive tract cancer underwent CEUS before and after chemotherapy from February 2011 to February 2015 in Tottori Univer-sity Hospital and were followed up after chemotherapy. The site of the primary tumor was the rectum in two pa-tients, stomach in two, and esophagus in one. Histologi-cal types of all primary tumor were adenocarcinoma.
Ultrasonography was performed using a Aplio XG (Toshiba, Tokyo, Japan) and a 3.5 MHz convex probe (PVT-375BT). Before CEUS, B-mode ultrasonography of the whole tumor was performed to determine the slice of images. Then the largest diameter slice of the tumor image was selected. A probe was fi xed to obtain an image similar to the preselected image, and imaging was recorded for 3 min immediately after bolus injec-tion of Sonazoid (Daiichi Sankyo, Tokyo, Japan) into the medial cubital vein. Ultrasound conditions (gain, dy-namic range, mechanical index, depth, and focus) were unaltered throughout imaging of a particular patient. CEUS was performed before and after chemotherapy; the number of chemotherapy cycles ranged from one to fi ve depending on the patient’s condition.
Intensity (dB)
Time (s)
Fig. 2. TIC parameters. 1) Peak intensity. 2) Time to wash-in. 3) Time to peak intensity. 4) Slope of wash-in. 5) Area under the curve. TIC, time-intensity curve. dB, decibel.
ImageLab software ver. 2.9 (Toshiba, Tokyo, Japan) was used for image analysis. The region of interest was set to surround the entire region of the tumor (Fig. 1).
A TIC was prepared for each patient for 3 min imme-diately after Sonazoid injection. Changes in TIC
parame-mined based on the CT changes in tumor diameter in accordance with the response evaluation criteria in solid tumors (RECIST) complete loss of the target lesion (complete response), > 30% decrease in the sum of the diameters of the target lesion relative to the baseline value (partial response), > 20% increase and 5-mm in-crease in the sum of the diameters of the target lesion relative to the baseline value (progressive disease), and small changes that do not meet the above criteria (stable disease). 4
This study was approved by the Ethics Com-mittee of the Tottori University Faculty of Medicine (1508A020).
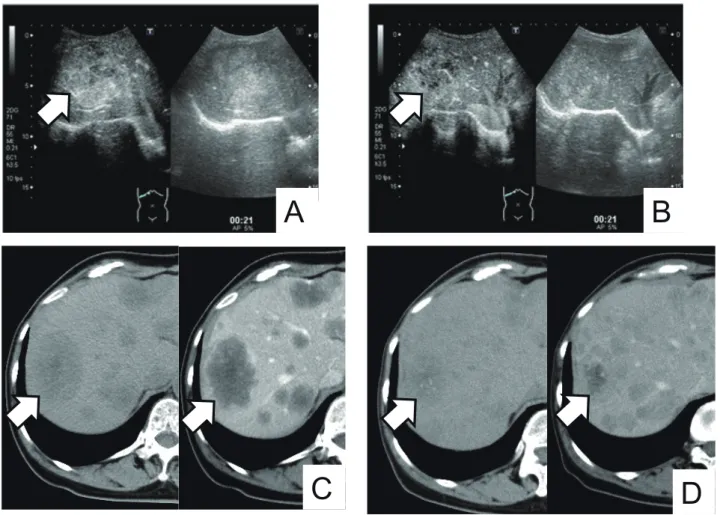
abine and oxaliplatin). CEUS images showed weak con-trast enhancement inside the tumor in the arterial phase before chemotherapy and reduced contrast enhancement inside the tumor in the arterial phase after chemothera-py. CT images showed a reduction in tumor size from 57 to 38 mm (Fig. 3). ROC of the peak intensity, the slope of wash-in and the area under the curve were decreased, while that of the time to wash-in and time to peak inten-sity were increased (Fig. 4).
Figures 5 and 6 show the CEUS images and TIC before and after chemotherapy in a patient whose CT images did not show a therapeutic effect (Patient 3, a 76-year-old man with primary stomach cancer).
CEUS was performed after one cycle and CT was
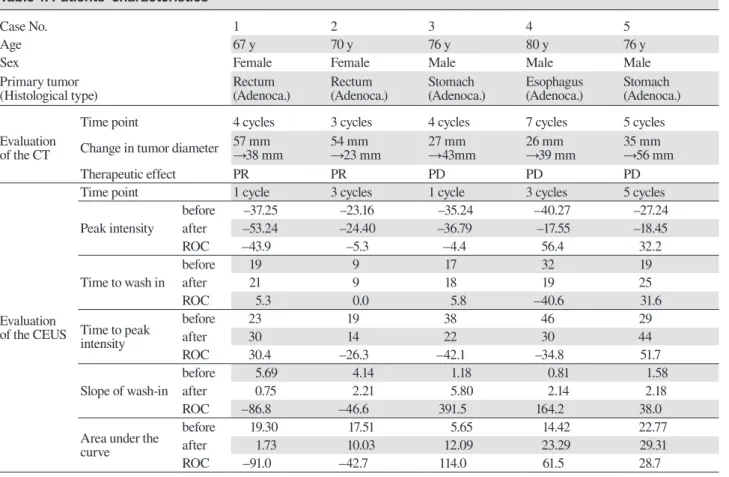
Table 1. Patients’ characteristics
Case No. 1 2 3 4 5
Age 67 y 70 y 76 y 80 y 76 y
Sex Female Female Male Male Male
Primary tumor
(Histological type) Rectum(Adenoca.) Rectum(Adenoca.) Stomach(Adenoca.) Esophagus(Adenoca.) Stomach(Adenoca.)
Evaluation of the CT
Time point 4 cycles 3 cycles 4 cycles 7 cycles 5 cycles
Change in tumor diameter 57 mm→38 mm 54 mm→23 mm 27 mm→43mm 26 mm→39 mm 35 mm→56 mm
Therapeutic effect PR PR PD PD PD
Evaluation of the CEUS
Time point 1 cycle 3 cycles 1 cycle 3 cycles 5 cycles
Peak intensity before –37.25 –23.16 –35.24 –40.27 –27.24 after –53.24 –24.40 –36.79 –17.55 –18.45 ROC –43.9 –5.3 –4.4 56.4 32.2 Time to wash in before 19 9 17 32 19 after 21 9 18 19 25 ROC 5.3 0.0 5.8 –40.6 31.6 Time to peak intensity before 23 19 38 46 29 after 30 14 22 30 44 ROC 30.4 –26.3 –42.1 –34.8 51.7 Slope of wash-in before 5.69 4.14 1.18 0.81 1.58 after 0.75 2.21 5.80 2.14 2.18 ROC –86.8 –46.6 391.5 164.2 38.0
Area under the curve
before 19.30 17.51 5.65 14.42 22.77
after 1.73 10.03 12.09 23.29 29.31
ROC –91.0 –42.7 114.0 61.5 28.7
Adenoca., adenocarcinoma; after, after chemotherapy; before, before chemotherapy; CEUS, contrast-enhanced ultrasonography; CT, computed tomography; No., number; PD, progressive disease; PR, partial response; ROC, rate of change; y, years old.
A
B
C
D
Fig. 3. Several images of a case of partial response to chemotherapy. Arrows indicate the tumor. A: CEUS image before chemotherapy. Right image: B-mode. Left image: CEUS mode. Weak contrast enhancement was observed inside the tumor in the arterial phase. B: CEUS image after chemotherapy. Right image: B-mode. Left image: CEUS mode. Contrast enhancement was reduced inside the tumor in the arterial phase. C: CT image before chemotherapy. Right image: Contrast enhanced CT. Left image: Plain CT. The largest tumor was 57 mm in diameter. D: CT image after chemotherapy. Right image: Contrast enhanced CT. Left image: Plain CT. The largest tumor was decreased to 38 mm in diameter. CEUS, contrast-enhanced ultrasonography; CT, computed tomography.
Fig. 4. Graph showing the TIC. Dotted line: TIC before chemo-therapy. Solid line: TIC after chemochemo-therapy. The peak intensity, slope of wash-in, and area under the curve were decreased, while the time to wash-in and time to peak identity were unchanged. dB, decibel; TIC, time-intensity curve.
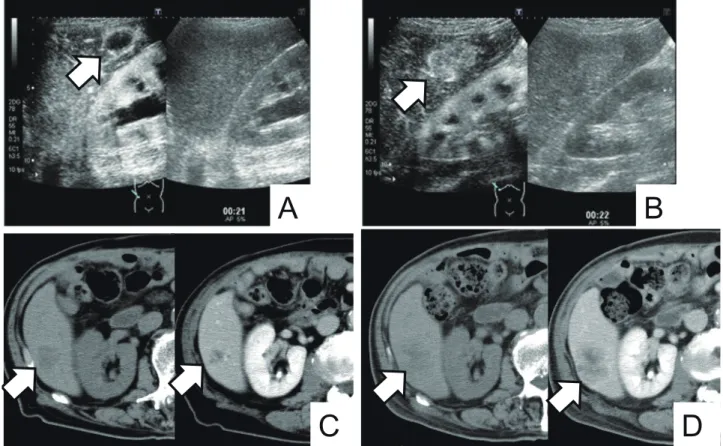
performed after four cycles of FP therapy (cisplatin and fluorouracil). CEUS images showed contrast enhance-ment of the tumor margins in the arterial phase before chemotherapy and increased contrast enhancement in-side the tumor in the arterial phase after chemotherapy. CT images showed an increase in tumor size from 27 to 43 mm (Fig. 5). ROC of the time to wash-in, the slope of wash-in and the area under the curve were increased, while ROC of the peak intensity and the time to peak intensity were decreased (Fig. 6). Two patients of case 2 and 5 underwent CEUS and CT at the same time point (3 and 5 cycle). CT images of case 2 patient showed a reduction in tumor size, and ROC of the peak intensity, the slope of wash-in and the area under the curve were decreased based on CEUS fi ndings. As a patient of case 5, CT images showed an increase in tumor size, and ROC of all parameters of TIC were increased (Table 1).
A
D
C
B
Fig. 5. Several images of a case of progressive disease after chemotherapy. Arrows indicate the tumor. A: CEUS image before chemother-apy. Right image: B-mode. Left image: CEUS mode. Contrast enhancement was observed in the tumor margins in the arterial phase. B: CEUS image after chemotherapy. Right image: B-mode. Left image: CEUS mode. Contrast enhancement was observed inside the tumor in the arterial phase. C: CT image before chemotherapy. Right image: Contrast enhanced CT. Left image: Plain CT. The largest tumor was 27 mm in diameter. D: CT image after chemotherapy. Right image: Contrast enhanced CT. Left image: Plain CT. The largest tumor was increased to 43 mm in diameter. CEUS, contrast-enhanced ultrasonography; CT, computed tomography.
Fig. 6. Graph showing the TIC. Dotted line: TIC before chemo-therapy. Solid line: TIC after chemochemo-therapy. The slope of wash-in and area under the curve were increased, while the time to peak intensity was decreased; the peak intensity and time to wash-in were unchanged. dB, decibel; TIC, time-intensity curve.
The fi ndings for all fi ve patients are summarized in Table 1. ROC of the slope of wash-in and the area under the curve, but not in the other TIC parameters, refl ected the therapeutic effects based on CT fi ndings.
DISCUSSION
The RECIST, which are based on changes in tumor diameter on CT images, are commonly used to eval-uate the therapeutic effect of chemotherapy for liver metastases.5 However, the presence of necrosis in the
tumor complicates the evaluation, and a more accurate approach would be visualization of tumor hemodynam-ics. CEUS is a highly sensitive and specifi c method for detecting liver metastases and provides valuable infor-mation about tumor hemodynamics and morphology.6–11
When a tumor grows or shrinks, feeding vessels are created or damaged, respectively, and morphologi-cal changes then become prominent. CEUS reportedly allows for visualization of changes in feeding vessels before tumor morphology changes, enabling early
evalu-ation of the therapeutic effect.12–14 This early prediction
of the therapeutic effect allows alteration of the method or schedule of treatment, thereby avoiding unnecessary administration of anticancer agents. In this study, we performed CEUS prior to CT in three patients and found that CEUS was able to know the therapeutic effect of anticancer agents at an earlier stage than CT in all cas-es. Furthermore, this study showed that the findings of CEUS performed at the earliest stage of therapy (after one cycle) reflected the results of the CT evaluation, sug-gesting that CEUS may have a possibility to predict the therapeutic effect at the earliest stage of chemotherapy. Conversely, patients whose CT images indicated a com-plete response or stable disease were not examined by CEUS, and the timing of CEUS and CT examinations were not controlled in this study. Further studies with more patients and controlled timing of CEUS and CT examinations are needed. Additionally, this study ex-amined liver metastases from digestive tract cancer, but the type of primary organ was not controlled because there were only five patients included in this study. Liver metastases from digestive tract cancer reportedly show contrast enhancement in the arterial phase.15 Without
well-enhanced contrast in the arterial phase, the peak intensity, time to wash-in and slope of wash-in cannot be accurately calculated. This study indicated that changes in the TIC would be useful in the evaluation of the ther-apeutic effect when contrast enhancement was present in the arterial phase.
Lassau et al. prepared TICs of CEUS in patients with liver metastases from renal cell carcinoma and found significant differences in the peak intensity, slope of wash-in, time to peak intensity, and area under the curve between groups with and without a therapeutic ef-fect.16 In this study, ROC of the slope of wash-in and the
area under the curve reflected the therapeutic effect, but that of the peak intensity and the time to peak intensity showed no relationship with the therapeutic effect. This may be explained by differences in the locations of pri-mary tumors and by the use of angiogenic inhibitors as anticancer agents in the previous study. Schirin-Sokhan et al. prepared TICs for liver metastases of rectal cancer treated with an angiogenic inhibitor and found that in-creases in the time to peak intensity were observed when therapy was effective.14 This suggests that ROC of the
time to peak intensity might vary depending on the an-ticancer agents used. Based on the previous and present studies, it was thought that the angiogenesis of the tumor may reflected the two parameters of TIC (slope of wash in and area under curve). Furthermore, Schirin-Sokhan et al.14 reported that there were no significant differences
in the peak intensity, which is in good agreement with
this study.
In conclusion, the results of this study indicate that in tumors with contrast enhancement in the arterial phase, differences in the TIC between before and after chemotherapy may serve as useful indicators of thera-peutic effect for patients with liver metastases. In partic-ular, ROC of the slope of wash-in and the area under the curve appear to specifically reflect the therapeutic effect. Furthermore, there is a possibility that TIC analysis may enable early prediction of the therapeutic effect.
The authors declare no conflict of interest. REFERENCES
1 Frampas E, Lassau N, Zappa M, Vullierme MP, Koscielny S, Vilgrain V. Advanced Hepatocellular Carcinoma: early eval-uation of response to targeted therapy and prognostic value of Perfusion CT and Dynamic Contrast Enhanced-Ultrasound. Preliminary results. Eur J Radiol. 2013;82:e205-11. PMID: 23273822.
2 Lassau N, Bonastre J, Kind M, Vilgrain V, Lacroix J, Cuinet M, et al. Validation of dynamic contrast-enhanced ultrasound in predicting outcomes of antiangiogenic therapy for solid tumors: the French multicenter support for innovative and expensive techniques study. Invest Radiol. 2014;49:794-800. PMID: 24570378.
3 Lassau N, Chebil M, Chami L, Bidault S, Girard E, Roche A. Dynamic contrast-enhanced ultrasonography (DCE-US): a new tool for the early evaluation of antiangiogenic treatment. Target Oncol. 2010;5:53-8. PMID: 20379790.
4 Eisenhauer EA, Therasse P, Bogaerts J, Schwartz LH, Sargent D, Ford R, et al. New response evaluation criteria in solid tu-mours: revised RECIST guideline (version 1.1). Eur J Cancer. 2009;45:228-47. PMID: 19097774.
5 Tirumani SH, Kim KW, Nishino M, Howard SA, Krajewski KM, Jagannathan JP, et al. Update on the role of imaging in man-agement of metastatic colorectal cancer. Radiographics. 2014;34:1908-28. PMID: 25384292.
6 Arita J, Ono Y, Takahashi M, Inoue Y, Takahashi Y, Saiura A. Usefulness of contrast-enhanced intraoperative ultrasound in identifying disappearing liver metastases from colorectal car-cinoma after chemotherapy. Ann Surg Oncol. 2014;21 Suppl 3:S390-7. PMID: 24570378.
7 Mishima M, Toh U, Iwakuma N, Takenaka M, Furukawa M, Akagi Y. Evaluation of contrast Sonazoid-enhanced ultra-sonography for the detection of hepatic metastases in breast cancer. Breast Cancer. 2016;23:231-41. PMID: 25143060. 8 Cantisani V, Grazhdani H, Fioravanti C, Rosignuolo M,
Calliada F, Messineo D, et al. Liver metastases: Contrast-en-hanced ultrasound compared with computed tomography and magnetic resonance. World J Gastroenterol. 2014;20:9998-10007. PMID: 25110428.
9 Shiozawa K, Watanabe M, Sumino Y. Evaluation of the he-modynamic status of focal hepatic lesions 20 mm or less in di-ameter by contrast-enhanced ultrasonography using Sonazoid. Intervirology. 2009;52:213-22. PMID: 19556803.
10 Yoshida K, Hirokawa T, Moriyasu F, Liu L, Liu GJ, Yamada M, et al. Arterial-phase contrast-enhanced ultrasonography for evaluating anti-angiogenesis treatment: a pilot study. World J Gastroenterol. 2011;17:1045-50. PMID: 21448357.
contrast-enhanced US with quantification--preliminary re-sults. Radiology. 2011;258:291-300. PMID: 20980447. 14 Schirin-Sokhan R, Winograd R, Roderburg C, Bubenzer J,
do Ó NC, Guggenberger D, et al. Response evaluation of
sunitinib: early evaluation of treatment response using dy-namic contrast-enhanced ultrasonography. Clin Cancer Res. 2010;16:1216-25. PMID: 20145174.