九州大学応用力学研究所 Reports No.152(Mar. 2017)
19
0
0
全文
(2) CONTENTS. Trans-boundary transport of PM2.5 to the western Japan and Japan Sea side regions based on the Source-Receptor Analysis By Shohei KUWAHARA, Itsushi UNO, Zhe WANG, Syuichi ITAHASHI, Keiya YUMIMOTO, Kazuo OSADA and Shigekazu YAMAMOTO….……………............... 1. Effect of the packing structure of silicon chunks on the melting process and carbon reduction in Czochralski silicon crystal growth By Xin LIU, Xue-Feng HAN, Satoshi NAKANO and Koichi KAKIMOTO...................... 12.
(3) 九州大学応用力学研究所所報 第 152 号 (1-11) 2017 年3月. 1. ソース・レセプター解析による西日本・日本海沿岸への PM 2.5 越境輸送 桑原 昇平*1 鵜野 伊津志*2 王 哲*2 板橋 秀一*3 弓本 桂也*2 長田 和雄*4 山本 重一*5 (2017 年 1 月 30 日受理). Trans-boundary transport of PM 2.5 to the western Japan and Japan Sea side regions based on the Source-Receptor Analysis Shohei KUWAHARA, Itsushi UNO, Zhe WANG, Syuichi ITAHASHI, Keiya YUMIMOTO, Kazuo OSADA, Shigekazu YAMAMOTO E-mail of corresponding author: [email protected] Abstract Long-term synergetic fine and coarse mode aerosol observations were analyzed at 1-h intervals at the Chikushi-campus of Kyushu University, Fukuoka, Japan, from December 2013 to March 2015. The GEOS-Chem chemical transport model, including dust and sea-salt acid uptake processes, was used for detailed analysis of observation data. Long-range anthropogenic aerosol trans-boundary transport events were observed during our analysis period, and the numerical model generally captured the observed time variation of PM2.5 aerosols. In order to have a better understanding of trans-boundary PM2.5 contribution, the model domain was divided into 15 major source regions, and emission intensity sensitivity analysis was conducted to show the detailed source-receptor relationship. We found the Japanese domestic contribution to annual averaged PM2.5 concentration at Fukuoka was 20 %, and another 80% were coming from outside Japan (19.6 % and 16.3% were coming from central north China region and Korea, respectively). From late fall to early spring when the PM2.5 concentration became higher, the trans-boundary fraction reached up to 90%, and this fraction was higher when the daily PM2.5 concentration exceeded the environmental standards of 35µm/m3.. Key words : PM2.5, Source-Receptor Analysis, Trans-boundary air pollution, Chemical transport model. 1. 緒 言. やすいため、呼 吸 器 系 疾 患 や循 環 器 系 疾 患 のリスクを 上昇させることがあげられる。. 微小粒子状物質(PM 2.5 )とは大気中に浮遊する粒子. 近年、中国では PM 2.5 による深刻な大気汚染が頻発. のうち、粒径が 2.5µm 以下の粒子の総称である。その成. している。特に、2013 年1月には北京-天津域−河北省. 分には硫酸塩(SO 4 2- )、硝酸塩(NO 3 - )、アンモニウム塩. (京 津 冀 域 )をはじめとする華 北 平 原 から上 海 にかけて. +. (NH 4 )、炭素成分(Black carbon, Organic carbon)、無. の広範囲において PM 2.5 の高濃度スモッグが発生し、健. 機元素などが含まれる。 PM 2.5 が及ぼす影響としては、. 康 被 害 のほか、高 速 道 路 の封 鎖 や飛 行 機 の欠 航 など. 視 程 の悪 化 や交 通 障 害 、日 射 の遮 蔽 などの物 理 的 な. 交通にも大きな影響をもたらした。中国の風下に位置す. 影 響 のほかに、粒 径 が非 常 に小 さく、肺 胞 の奥 まで入 り. る日 本 国 内 においても越 境 大 気 汚 染 に関 する過 剰 とも. *1 *2 *3 *4 *5. 九州大学大学院総 合理工学府(現:マツダ株式会社) 九州大学応用力学 研究所 一般財団法人電力 中央研究所 名古屋大学大学院 環境学研究科 福岡県環境部. 思える報道や健康影響への危惧から、大気汚染に対す る関心が高まっている。 わが国では 2009 年に PM 2.5 に対する大気環境基準 (年平均値 15µg/m 3 以下かつ日平均値 35µg/m 3 以下) が新たに設定され、現在は 700 カ所以上で PM 2.5 の常.
(4) 2. 桑原・鵜野ほか:ソース・レセプター解析による西日本・日本海沿岸への PM2.5 越境輸送 時 監 視 が実 施 されるなど、汚 染 状 況 の把 握 が進 められ ている. 1,2). 以下では、東アジア地域の発生源地域を国・地域、中. 。しかしながら、2014 年度の PM 2.5 の環境基準. 国の省ごとに 15 領域に分割し、各領域の人為起源排. 達成率は、一般環境大気測定局では 37.8%、自動車排. 出 量 の削 減 感 度 計 算 を行 い、各 領 域 の人 為 起 源 汚 染. 3). 出ガス測定局では 25.8%にとどまっている 。 PM 2.5 による広域の大気汚染対策を検討する上では、 その発 生 源 毎 の寄 与 を明 らかにすることが重 要 な課 題 である。茶谷ら. 4). 質の相対寄与率を示す。また、福岡市で PM 2.5 の環境 基準が超過した 23 日のケースについての発生源寄与 率の特徴もまとめた。. は 2000 年度を対象として化学輸送モ. デル CMAQ を用いた感度解析を実施し、首都圏におけ る粒子成分に関する発生源寄与(自動車, 自動車以外 の人為発生源, 自然発生源, 越境輸送の計 4 種)を推 定している。その中で、PM 2.5 の主成分でもある SO 4 2- は. 2.. 2.1 化学輸送モデル. 冬季で 80%、年平均で 58%が国外寄与であると報告して いる。また、茶谷ら. 5). は CMAQ を用いた感度解析により、. 解析手法. 本研究では化学輸送モデルとして GEOS-Chem ver. 9.2 8) を使用した。モデル計算は、NASA GEOS-FP 同化. 日本三大都市圏における 2005 年度の PM 2.5 の発生源. 気象解析データを用いて、NOx – Ox – VOC – HOx –. 寄与を評価している。その結果、PM 2.5 の国外寄与が年. CO の詳細な化学反応過程を含む全球 2˚×2.5˚度格. 平均で大阪・兵庫圏では 48%、愛知・三重圏では 41%、. 子 の 計 算 結 果 を 境 界 条 件 に し 、 ア ジ ア 域 を 0.5˚ ×. 首都圏では 31%、東京 23 区では 26%であると報告してい. 0.667˚ 度格子で一方向ネストで計算した。モデルの計. る。季 節 毎 の特 徴 についても、夏 季 には国 内 寄 与 が増. 算領域の設定と基本計算条件は、Uno et al .. 9). と鵜野. 加し、春季と秋季には国外寄与が多いこと、冬季には大. ら. 阪 ・兵 庫 圏 、愛 知 ・三 重 圏 では国 外 寄 与 が高 いが、東. 囲 は、1つの微 小 モードのみを扱 っている。一 方 、鉱 物. 京 23 区や首都圏では国内寄与が高いことが示されてい. 性ダスト(以下、黄砂という)は、GEOS Chem では4ビン. る。これらの先行研究から判るように PM 2.5 については越. (有効半径はそれぞれ 0.73、1.4、2.4、4.5 µm)の計算. 境 輸 送 の寄 与 が大 きく、特 に、大 陸 に近 い九 州 から西. が可能である. 日本域でその影響が顕著と考えられる。PM 2.5 の発生源. 送も扱われている。. 寄 与 に関 する研 究 の多 くは国 内 の発 生 源 の種 類 に関. 10). に報告したものと同一である。エアロゾルの粒径範. 11). 。モデルでは海塩 (2ビン) の発生と輸. モ デ ル 計 算 は 、 REAS 2.1 ( Regional Emission. するものであり、国外寄与に関する詳細な研究は少ない。. inventory in Asia) 12) の排出量推計を用いた。REAS イ. Ikeda et al . 6,7) は CMAQ による 2010 年を対象とした感. ンベントリは 2008 年までしかないため、2009 年以降は. 度 解 析 から、日 本 国 内 への越 境 寄 与 を示 している。例. MEIC 排出量推計(http://www.meicmodel.org)と 2010. えば、長崎県福江島の PM 2.5 濃度に対する発生源地域. 年 までのエネルギー統 計 を利 用 して外 挿 した結 果 を用. 別 (日 本 , 朝 鮮 半 島 , 中 国 東 北 部 , 中 国 中 北 部 , 中. いた。一方、NH 3 の排出量は冬季に少なく、夏季に多い. 国中南部, 中国南部; 計 6 領域)の寄与は、年平均と. 季 節 変 化 を示 す。ここでは、このような季 節 変 化 を含 む. して 7.8%が国 内 寄 与 、89.2%が国 外 寄 与 で、中 国 中 北. Huang et al .. 部が 48.9%、中国中南部が 22.3%、朝鮮半島が 10.6%の. た (REAS の NH 3 には月変化はない)。. 寄与を示すと報告している。. 13). に一致するように REAS の結果を補正し. 火 山 については国 内 の十 勝 岳 (北 海 道 )、樽 前 山. JSPS 科学研究費基盤研究 S「多波長ライダーと化学. (北 海 道 )、雌 阿 寒 岳 (北 海 道 )、有 珠 山 (北 海 道 )、浅. 輸 送 モデルを統 合 したエアロゾル5次 元 同 化 に関 する. 間 山 (長 野 県 、群 馬 県 )、伊 豆 大 島 (東 京 都 )、三 宅 島. 先 導 的 研 究 (代 表 鵜 野 伊 津 志 )」の一 環 として、九 州. (東 京 都 )、阿 蘇 山 (熊 本 県 )、九 重 山 (大 分 県 )、霧 島. 大 学 筑 紫 キャンパス周 辺 での1時 間 の高 時 間 分 解 の連. 山 (宮 崎 県 、鹿 児 島 県 )、桜 島 (鹿 児 島 県 )、薩 摩 硫 黄. 続した PM 2.5 組成分析の測定が継続されているが、本研. 島 (鹿 児 島 県 )、諏 訪 之 瀬 島 (鹿 児 島 県 )、国 外 のブル. 究 では、その観 測 データに対 して 2013 年 12 月 から. サン山 (フィリピン、ルソン島 )、マヨン山 (フィリピン、ルソ. 2015 年 3 月を対象として、化学輸送モデルを用いたソ. ン島 )がモデル内 で考 慮 されている。これらの火 山 の排. ース・リセプター解 析 (ソース・リセプター関 係 の推 定 )を. 出 量 や高 度 に関 する情 報 は、気 象 庁 の火 山 活 動 解 説. 実施した。ここで、ソース・リセプター関係とは、大気汚染. 資料. 14). が利用できる場合はそれに基づき設定した。. 物質の受容領域(リセプター)に対する汚染物質の発生. PM 2.5 濃 度 のモデル計 算 値 を求 める際 には、硫 酸 塩. 領域(ソース)の寄与であり、この関係が明らかになると、. (SO 4 2- )、硝 酸 塩 (NO 3 - )、アンモニウム塩 (NH 4 + )、黒 色. 汚染物質の輸送過程や濃度分布の季節変動の解明が. 炭素(BC)、有機炭素(OC)、微小海塩、微小黄砂のそ. 可 能 になり、観 測 データの解 析 や理 解 、環 境 改 善 の施. れぞれの質量濃度の総和から算出した。なお、OC につ. 策立案などに活用することができる。. いては、一次排出の有機物質(OM)の影響を加味する.
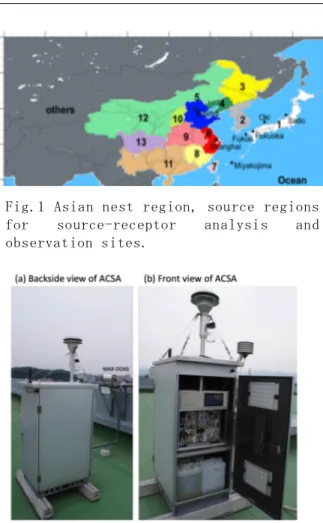
(5) 九州大学応用力学研究所所報 第 152 号 2017 年 3 月. 3. 酸塩は硫酸バリウムを生成させ散乱光を比濁法で、 硝 酸塩と WSOC は紫外吸光光度法で、OBC は近赤外散 乱法で計測している。 ACSA による WSOC はシュウ酸 (C 2 O 4 2- ) 相当とされているが、通常測定される WSOC と. は 性 質 が 異 な る こ と に 留 意 す る 必 要 が あ る 。ACSA-12 の測定方法の詳細は紀本ら 16) を参照されたい。測定は 九州大学筑紫キャンパス(2014 年 9 月–12 月)と太宰府 市の福岡県保健環境研究所(2013 年 12 月–2014年 8. Fig.1 Asian nest region, source regions for source-receptor analysis and observation sites.. 月、2015 年1月–3 月)で行った。Fig. 2 には応用力学研 究所屋上に設置された ACSA-12 を示す。 福岡以外の観測点については環境省大気汚染物質 広 域 監 視 シ ス テ ム ( 通 称 そ ら ま め 君 , http://soramame.taiki.go.jp/)の PM 2.5 質 量 濃 度 のデ ータを使用した。ただし、本研究の対象期間である 2014 年 度 については速 報 値 である。モデル再 現 性 の検 証 に は 、 人 為 起 源 汚 染 の 影 響 の 少 な い 離 島 の 佐 渡 (新 潟 県 )、隠 岐 (島 根 県 )、福 江 (長 崎 県 )、宮 古 島 (沖 縄 県 ) の PM 2.5 測定データの 1 時間値を使用した。 観測データの日平均値は、 1 日の測定時間が 20 時 間以上の測定日のみを対象に 1 時間値から算出した。 月平均値は、日平均値の総和を測定日数で除した値と した。. 2.3 ソース・リセプター解析の方法 PM 2.5 のソース・リセプター関係を推定するため、本研. Fig.2 Continuous Dichotomous Aerosol Chemical Speciation Analyzer (ACSA-12) at the roof of RIAM.. Table 1 Source regions for sensitivity analysis Source Region. Country detail. を PM 2.5 濃度計算に. No. 1. Japan. Japan. 用いた。Fig. 1 にモデルの計算領域(アジア域)、発生. 2. Korea. Korea. 源 感 度 解 析 用 の領 域 設 定 、解 析 に用 いた観 測 地 点 を. 3. Northeast China. Jilin,Heilongjiang. 示す (Table 1 参照)。. 4. Liaoning China. Liaoning. 5. Central N. China. ために、OC の計算値の 1.7 倍. 15). 2.2 観測データ. Beijing , Tianjin , Hebei , Shandong. 6. Central E. China. Shanghai,Jiangsu,Zhejiang. モデル再現性の検証のために、以下の 2 つの観測デ. 7. Taiwan. Taiwan. ータを使 用 した。エアロゾル化 学 成 分 連 続 自 動 分 析 装. 8. Central S. China. Fujian,Jiangxi. 9. Central China. Henan,Anhui,Hubei. 10. Shanxi China. Shanxi. 置 ( Continuous. Dichotomous. Aerosol. Chemical. Speciation Analyzer, ACSA-12; 紀 本 電 子 工 業 製 )を 用い、1 時間毎の PM 2.5 、PM 10 質量濃度、および、硫酸 塩(SO 4 2- )濃度、硝酸塩(NO 3 - )濃度、光学的元素状炭 素濃度(OBC、Optically measured Black Carbon)、水. Guangdong, Hunan,. 11. Southwest China. Yunnan,Guizhou. 溶 性 有 機 化 合 物 ( WSOC 、 Water Soluble Organic Compounds)濃度の測定値を用いた。 ACSA-12 では、環境大気を PM 10 インレットから導入 し、1 時間毎に PM f (<2.5 µm)、PMc (2.5~10µm)をバー チャルインパクタで分粒した後、1m 3 の大気中のエアロゾ ルをそれぞれフッ素 樹 脂 フィルターに捕 集 している。硫. Hongkong, Macao,Hainan,. Qinghai , Gansu , Shaanxi ,. 12. Inland China. 13. Chuan-Yu China. Sichuan, Chongqing. 14. Ocean - Ship. Ship exhaust gas. 15. Others. Others than region 1 – 14. Inner Mongolia,Ningxia.
(6) 4. 桑原・鵜野ほか:ソース・レセプター解析による西日本・日本海沿岸への PM2.5 越境輸送 究 ではエミッション感 度 法 を用 いた。エミッション感 度 法. の月平均値を上海と北京についての比較も示した。. とは、あるソース領 域 における原 因 物 質 のエミッション. Fig. 3 には、観測とモデルの線形回帰、相関係数 R、. (排 出 量 )を変 化 させた差 分 からソース領 域 の寄 与 を求. 一致性の尺度 d を示す。ここで一致性の尺度 d は以下. める手法である。. で定 義 され、モデルと観 測 の一 致 性 を示 す(d=0 は一. 本研究では東アジア地域を Fig.1に示した15個の領. 致性がなく、d=1 は高い一致性を示す)。 ! !!!. 域に分割した(Table 1 に領域名と具体的な国名・省名 を示 す)。モデル計 算 では、人 為 起 源 の排 出 量 を図 に 示 した各 領 域 について、20%削 減 した感 度 解 析 を実 施. 𝑑 =1−. ! !!!. 𝐶!"#,! − 𝐶!"#,!. !. 𝐶!"#,! − 𝐶!"# − 𝐶!"#,! − 𝐶!"#. !. することで、各 領 域 からの相 対 寄 与 を求 めた。その際 、 従来のエミッション感度法のように各領域を 1 つずつ削. Fig. 4 では、観測値を箱ヒゲ線図(1日平均値の 10%,. 減するのではなく、偏西風の主風向を考慮して、風下か. 25%, 50%, 75%,90%タイル値)、モデル月平均値を実線で. ら風 上 にかけて順 に領 域 を拡 大 していく手 法 を取 った。. 示している(平均値と 50%タイル値は異なることがある)。. これは、1つの領 域 のみの排 出 量 を 20%削 減 すると、そ. 図 の右 軸 はモデル濃 度 、左 軸 は観 測 値 を示 している. の風 上 からの汚 染 物 質 がそこで希 釈 され、ガス・エアロ. (軸 の範 囲 は、Fig.3に示 した回 帰 式 でモデル値 を変 換. ゾル平衡が変化するのを防ぐためである。モデル計算で. した範囲である)。. は、火 山 の寄 与 を推 定 するため、火 山 からの排 出 量 を. PM 2.5 の日平均濃度、月平均濃度ともにモデル計算値 は観 測 値 の変 化 傾 向 をよく捉 えている。特 に月 平 均 濃. 100%除いた感度解析も行った。本研究では、 [1] 全ての排出量を与える場合(標準計算、CNTL). 度 は、PM 2.5 濃 度 が冬 から春 にかけて高 く、夏 に低 い季. [2] 計 算 領 域 全 体 の人 為 起 源 排 出 量 を 20%削 減 し. 節 変 化 を概 ね再 現 している。相 関 係 数 については、最 も低い宮古島においても 0.77 以上で、モデル計算値は. た場合(CNTL-20%) [3] 発生源地域(14 領域)の人為起源排出量を 20%. 観 測 値 と強 い相 関 を示 している。モデルの過 小 傾 向 が 北 京 と上 海 にも見 えるが、両 地 点 とも季 節 変 化 の再 現. 削減した場合(Reg i – 20%). 性はよい。線形回帰の結果は、国内について、y切片は. [4] 火山からの排出量を 100%削減した場合 の合計 17 ケースのモデル計算(2013 年12月1日から. 4.83 – 8.64 µg/m 3 、回帰係数は 0.74 – 0.98 となって、. 2015 年 3 月 31 日まで)を実施した。. 国内の最小は隠岐(0.78)で、福岡では 0.98 となって、相. 発 生 源 地 域 別 の人 為 起 源 の相 対 寄 与 は、以 下 のよ. 関 は 高 い 。 一 方 、 中 国 の 2 地 点 は 回 帰 係 数 が 1.5 – 1.7 程度とモデルが 60 %程度過小、北京のy切片は 16. うに算出した。 ΔC reg_i-20% / (C CNTL – C CNTL-20% ) ×100%. (1). ここで、C CNTL は標準計算の濃度(µg/m 3 )、C CNTL-20% は計. µg/m 3 と大きなバイアスがあり、モデルで表現できないロ ーカル汚染が大きいと考えられる。モデルの一致性の尺. 算領域全体を 20%削減した場合の濃度(µg/m 3 )を示し、. 度 d については、都市部である福岡では 0.76 と遠隔地. ΔC reg_i-20% は以下のように算出する。. の値に比べると低いが、有意な一致性を示している。. ΔC reg_i-20% =C reg1,2, … .i-1-20% – C reg1,2, … .i-20% (2) ここで、C Reg1,2, ⋯ i-20% は領域 1 から i を 20%削減した場 合の濃度を意味する。 一方、PM 2.5 濃度に対する火山の寄与は以下のように 算出する。 (C CNTL – C VOLC-OFF ) / C CNTL. ×100%. (3). ここで、C VOLC-OFF は火山からの排出量を 100%削減した 場合の濃度である。. 化 学 組 成 観 測 データの使 える福 岡 について、PM 2.5 の月平均の成分別の比較を行った。ACSA-12 は PM 2.5 中 の 硫 酸 塩 ( SO 4 2- ) 、 硝 酸 塩 ( NO 3 - ) 、 元 素 状 炭 素 (OBC)、水 溶 性 有 機 化 合 物 (WSOC)の濃 度 が測 定 で きる。しかし OC については非水溶性有機化合物の寄 与も多く、モデル計算値の OC と直接比較はできないが 参考として比較した。 Fig. 5 に ACSA-12 による各成分の観測値(Fig. 4と 同 様 に日 平 均 値 を箱 ヒゲ線 図 で示 した)とモデル計 算. 3. 化学輸送モデルの再現性 福 岡 、佐 渡 、隠 岐 、福 江 、宮 古 島 におけるモデルと観 測の PM 2.5 日平均濃度、月平均濃度の変化をそれぞれ. 値の月平均濃度を示す。SO 4 2- 、NO 3 - 、BC ともに季節変 動を概ね再現しているが、BC については期間を通じて 過小評価であった。NO 3 - は 2014 年1,2月に過大傾向 が見られるが 2015 年の冬季の一致性は非常に高い。. F i g s . 3 , 4 に示す。モデル計算の対象期間は 2013 年. 冬季には、気象条件により NO 3 - の越境輸送も起こること. 12 月から 2015 年 3 月であるが、隠岐、佐渡、宮古島に. が Itahashi et al . 17) に明瞭に示されている。NO 3 - の生成. ついてはデータ利 用 可 能 期 間 について比 較 した。図 に は、中 国 のアメリカ大 使 館 ・領 事 館 で測 定 された PM 2.5. に関わる反応式は、 HNO 3 + NH 3 ⇄ NH 4 + + NO 3 -.
(7) 九州大学応用力学研究所所報 第 152 号 2017 年 3 月. 5. Fig.3 Observed and modeled PM 2.5 concentration for (a) Fukuoka, (b) Sado, (c) Oki, (d) Goto-Fukue, (e) Miyakojima, (f) Beijing and (g) Shanghai. Left axis is for observation and right axis is for modeled concentration. .
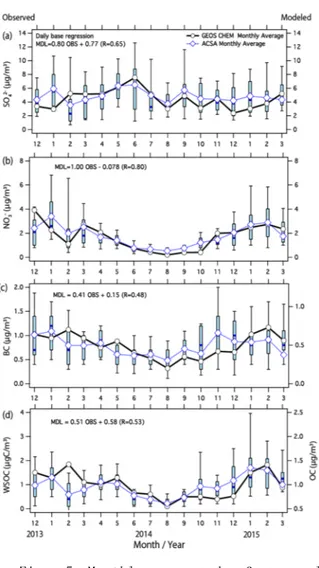
(8) 6. 桑原・鵜野ほか:ソース・レセプター解析による西日本・日本海沿岸への PM2.5 越境輸送. Fig.4 Monthly average of observed and modeled PM 2.5 concentration for (a) Fukuoka, (b) Sado, (c) Oki, (d) Goto-Fukue, (e) Miyakojima, (f) Beijing and (g) Shanghai. Observation is shown by box-plot (10, 25, 50, 75 and 90 percentiles of daily averaged value) and model results by line. Left axis is for observation and right axis is for modeled concentration.. Fig. 5 Monthly averaged of aerosol concentration (a) SO 4 2-, (b) NO 3 - , (c) BC and (d) WSOC and OC. Observation (-○- ) is shown by box-plot (10, 25, 50, 75 and 90 percentiles of daily averaged value) and model results (-◇ -) by line. Left axis is for observation and right axis is for modeled concentration.. 次 粒 子 であり、大 気 中 で他 の物 質 と反 応 しにくいため、 モデルにおける過 小 評 価 の要 因 としては排 出 量 が過 小 であったことが一因として考えられる。. と書ける。これから判るように、大気中の NH 3 濃度が低い. Fig. 5(d) には、ACSA-12 の WSOC とモデルの OC 18). に従って µgC/m 3 単. と HNO 3 が十分に存在していても NH 4 NO 3 が生成されず、. を示している。WSOC は、板野ら. HNO 3 ガスと NO 3 - 粒子の平衡関係がガス側にシフトする。. 位に換算している。仮に ACSA で測定された WSOC が. この平 衡 は温 湿 度 の影 響 を受 けやすい(特 に、高 湿 度. すべてシュウ酸とすると、µg/m 3 濃度はその 3.75 倍にな. の場合)。モデル計算では中国での NH 3 排出量を変化. り、モデル計算値は過小となる。OC には直接大気中に. させた感度解析も行ったが、中国の NH 3 排出量の大小. 排 出 される一 次 粒 子 だけでなく、大 気 中 の化 学 反 応 に. -. で、越境される NO 3 濃度が変化した。従って、冬季の年. よって生成される二次粒子(Secondary Organic Aerosol,. 毎 の NO 3 - が過 大 や過 小 となる要 因 として、気 象 条 件 と. SOA)の寄与が大きい。SOA の二次生成過程は未解明. NH 3 排出量が影響していると考えられる。. の点が多く、OC の過小評価は化学輸送モデルに共通. BC は年平均濃度で比較すると、4 割程度の過小で あった。BC は発生源から直接大気中へと排出される一. の課題となっている 19) が、前述のように WSOC 測定値 は水 溶 性 有 機 物 の目 安 と考 えることが妥 当 であり、ここ.
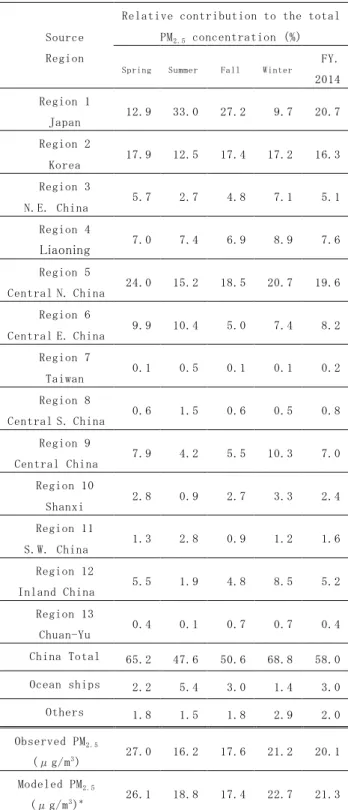
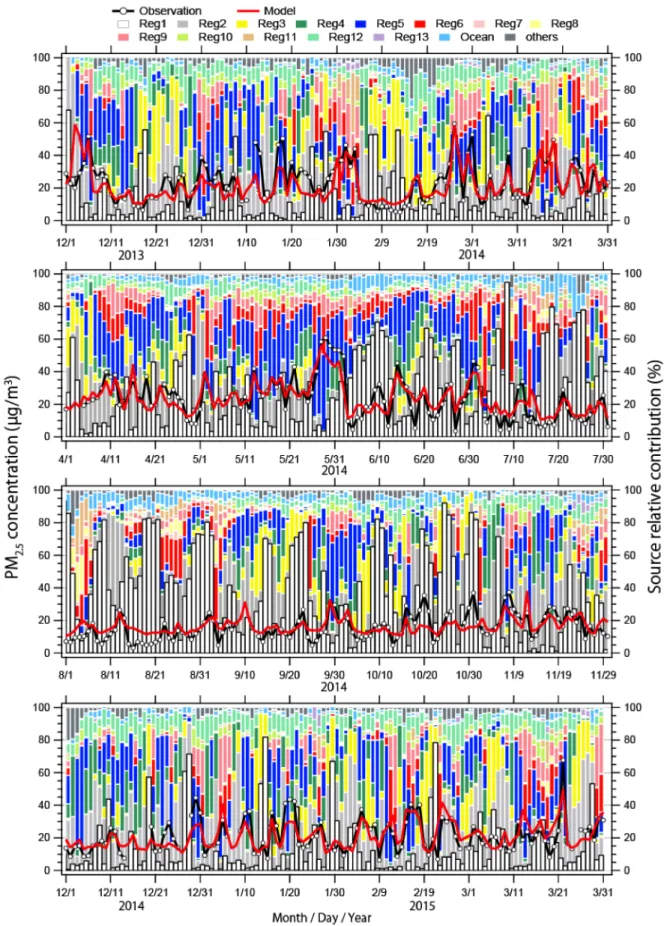
(9) 九州大学応用力学研究所所報 第 152 号 2017 年 3 月. 7. では、絶 対 濃 度 の議 論 ではなくて、相 対 的 な季 節 変 化. 寄 与 も高 くなることが判 る。また、朝 鮮 半 島 、中 国 東 北. 傾 向 の比 較 に重 点 をおきたい。季 節 変 化 としては、暖. 部 (Region 3) 、 遼 寧 省 、 中 国 中 北 部 、 中 国 内 陸 部. 候 期 に濃 度 が低 く、寒 候 期 に濃 度 の増 加 を示 し、この. (Region 12)の寄 与 は夏 季 よりも冬 季 に高 いのに対 し、. 傾 向 は観 測 もモデルも一 致 している。その季 節 変 化 は. 中国中東部、中国中南部、中国南西部(Region 11)の. BC とも類似している。これは、排出量の季節変化を反 映した結果と考えられる。なお、ACSA による WSOC は、. Table 2. Source relative contributions (%) to PM 2.5 in. 2014 年2月と 2015 年2月で濃度レベルが異なり、2014. Fukuoka. (Spring: March-May, Summer: June-August,. 年 2月 はモデル結 果 と変 化 傾 向 が異 なるが原 因 は不 明. Fall: September-November, Winter: December-February). である。. Relative contribution to the total. 福岡市保健環境研究所で測定・分析された 2013 年 度の PM 2.5 の成分割合. 20). では、SO 4 2- の割合が最も高く、. PM 2.5 concentration (%). Source Region. FY. Spring. Summer. 12.9. 33.0. 27.2. 9.7. 20.7. 17.9. 12.5. 17.4. 17.2. 16.3. 5.7. 2.7. 4.8. 7.1. 5.1. 7.0. 7.4. 6.9. 8.9. 7.6. 24.0. 15.2. 18.5. 20.7. 19.6. 9.9. 10.4. 5.0. 7.4. 8.2. 0.1. 0.5. 0.1. 0.1. 0.2. 0.6. 1.5. 0.6. 0.5. 0.8. 7.9. 4.2. 5.5. 10.3. 7.0. 2.8. 0.9. 2.7. 3.3. 2.4. 1.3. 2.8. 0.9. 1.2. 1.6. 5.5. 1.9. 4.8. 8.5. 5.2. 0.4. 0.1. 0.7. 0.7. 0.4. China Total. 65.2. 47.6. 50.6. 68.8. 58.0. 岡における PM 2.5 の濃度は冬季から春季に高く、夏季に. Ocean ships. 2.2. 5.4. 3.0. 1.4. 3.0. 低 い 。 日 本 の 相 対 寄 与 は 冬 季 に は 9.7% 、 春 季 に は. Others. 1.8. 1.5. 1.8. 2.9. 2.0. 27.0. 16.2. 17.6. 21.2. 20.1. 26.1. 18.8. 17.4. 22.7. 21.3. PM 2.5 濃度の 35%以上を占めているが、組成の同定でき ない部分が約 20%程度存在する。GEOS Chem で計算し. Region 1. ている PM 2.5 成分の構成要素を中島らの測定結果から. Japan. 積み上げると、全体の約 77%に相当する。また、モデル. Region 2. に含まれない成分に加えて、過小評価傾向である BC、. Korea. OC を考慮すると、図3、4に示した PM 2.5 濃度としては、. Region 3. 観測で測定される PM 2.5 質量重量の少なくとも3—4 割程. N.E. China. 度の過小が生じると考えられる。. Region 4. Liaoning . 4. ソース・リセプター解析結果. Region 5 Central N. China. 4.1 発生源地域別の相対寄与. Region 6 Central E. China. 福岡における PM 2.5 の日平均濃度(左軸)とその発生. Region 7. 源 地 域 別 の相 対 寄 与 (右 軸 )を Fig. 6に示 す。Fig. 7. Taiwan. には、月平均濃度についての同様な結果を示す。Table. Region 8. 2 には、季節ごとの領域寄与率を示す。領域寄与率は、 期 間 平 均 濃 度 を先 に計 算 し、標 準 計 算 と感 度 計 算 の 差 から求 めた。時 間 毎 の寄 与 率 を先 に計 算 し、それを 期間平均とすると PM 2.5 の低濃度時の国内寄与の影響 が大 きくでるため、両 者 は一 致 しない。図 には、観 測 の 月平均値(実線)と Fig. 3に示した回帰式で補正された モデル計算値(赤線)も示している。 Table 2 の発生源地域別の相対寄与解析から、2014 年度の年平均は、福岡における PM 2.5 の人為起源のうち 約 20%は国内寄与であり、残りの約 80%は越境輸送によ るものであった。特に影響が顕著な地域としては、北京・ 河北省を含む中国中北部(Region 5)が 19.6%、朝鮮半 島(Region 2)が 16.3%である。季節毎の特徴をみると、福. 12.9%、夏季には 33.0%と、夏季に国内寄与が上昇する が、PM 2.5 が高 濃 度 となる冬 季 から春 季 については約 9 割が越境輸送によるものである。冬季から春季について その内 訳 を見 ると、季 節 を問 わず影 響 の大 きい中 国 中 北部や朝鮮半島に加え、遼寧省(Region 4)や上海域を 含 む中 国 中 東 部 (Region 6)、中 国 中 央 部 (Region 9)の. Central S. China Region 9 Central China Region 10 Shanxi Region 11 S.W. China Region 12 Inland China Region 13 Chuan-Yu. Observed PM 2.5 (μg/m 3 ) Modeled PM 2.5 (μg/m 3 ) * . Fall. Winter. 2014. * Model results were corrected by regression shown in Fig.3..
(10) 8. 桑原・鵜野ほか:ソース・レセプター解析による西日本・日本海沿岸への PM2.5 越境輸送. Fig. 6 Source-receptor results of PM 2.5 at Fukuoka. Color bar indicate the source contribution from the region shown in Fig. 1. Solid line is the observed PM 2.5 , and red solid line is the model simulated result (corrected by the regression shown in Fig. 3)..
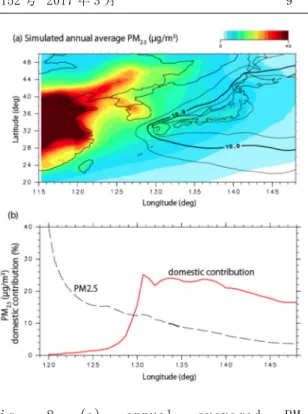
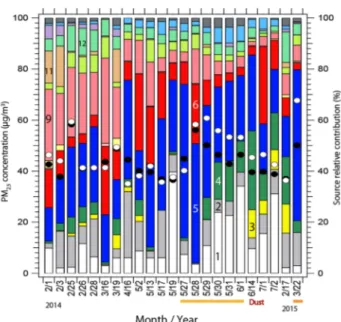
(11) 九州大学応用力学研究所所報 第 152 号 2017 年 3 月. 9. Fig. 7 Same as Fig. 6 but for monthly averaged source region contribution.. 風 が冬 季 は大 陸 側 から吹 く北 西 風 なのに対 し、夏 季 は. Fig. 8 (a) annual averaged PM 2.5 concentration (model vertical first layer at z = 65m; color) and domestic contribution % by line. (b) PM 2.5 and domestic contribution along the latitude of 33.6˚N.. 太 平 洋 高 気 圧 の縁 をまわる南 西 風 の影 響 を受 けるため. す。Table 3 には、その高濃度日のみを対象として平均. である。そのため、海洋船舶排出からの寄与も夏季に高. 相 対 寄 与 をまとめた。モデル計 算 値 の環 境 基 準 達 成 の. く、冬季に低いことが判る。. 判 断 には、モデル計 算 値 と観 測 値 の回 帰 直 線 により修. 寄 与 は冬 季 に比 べ夏 季 に高 い傾 向 にある。これは季 節. 正されたモデル計算値を用いた。 Fig. 8(a) には、モデルで計算された PM 2.5 の年平均. PM 2.5 高濃度時には、国内寄与の平均は 11.8%であ. 値 (カラー)と国 内 寄 与 率 (コンター)の地 域 分 布 を示 す。. るが、季 節 を問 わず国 外 寄 与 が支 配 的 であり、特 に中. 朝鮮半島から日本付近の PM 2.5 年平均濃度は、日本列. 国中北部の影響が約 30%と顕著であることが判る。冬季. 島にそう形で南西から北東方向の帯状のコンターを示し、. から春 季 の高 濃 度 時 には国 外 寄 与 が人 為 起 源 の寄 与. 3. 九州域では広域にわたって 9−12 µg/m である(福岡で. の 8 割から 9 割程度を占め、夏季の高濃度時には冬季. 線形回帰された換算濃度では 17 – 20 µg/m 3 に相当)。. から春 季 に比 べて国 内 寄 与 が大 きい傾 向 を示 した。高. 一方、国内寄与は首都圏で最大で 40%以上に達する. 濃度時の国外寄与の内訳について、冬季から春季の高. が、西 日 本 ・九 州 域 では圧 倒 的 に越 境 寄 与 の大 きいこ. 濃度時には中国の中北部、中東部、中央部、南西部の. とが自明である。東シナ海から九州・四国を東西に横断. 寄与が特に大きくなっていることが判る。. す る 北 緯 33.6˚ ラ イ ン ( 福 岡 市 に 相 当 ) に そ っ た 地 上. これらの解析から、冬季から春季における PM 2.5 の高. PM 2.5 濃度と国内寄与率を Fig. 8(b) に示すが、PM 2.5. 濃度現象(黄砂によるものを除く)は、この時期に支配的. 濃度は九州から東シナ海へ西進するにつれてわずかに. である朝 鮮 半 島 、中 国 東 北 部 、中 国 中 北 部 からの寄 与. 増 加 し、逆 に、国 内 寄 与 は減 少 している。これは特 に九. に加 え、中 国 中 東 部 、中 国 中 央 部 、中 国 南 西 部 からの. 州 から東 シナ海 域 では国 内 寄 与 の減 少 の分 だけ越 境. 寄 与 が重 合 することによって引 き起 こされると考 えること. 寄与率が増加して、PM 2.5 濃度はほとんど変化しない構. ができる。. 造 となっているためと考 えられる。これらの結 果 は Ikeda. et al. 7) の結果と整合的である。 Fig. 9 には福岡市でモデル計算値および観測値とも に環境基準(日平均値 35µg/m 3 )を超えた 23 日間のみ を抜き出して、日平均値(左軸)と相対寄与(右軸)を示. 5. まとめ 本研究では、福岡で観測される PM 2.5 に対する越境 輸送の影響をより詳細に把握し、PM 2.5 のソース・リセプ.
(12) 10. 桑原・鵜野ほか:ソース・レセプター解析による西日本・日本海沿岸への PM2.5 越境輸送. ター関 係 を明 らかにすることを目 的 として、化 学 輸 送 モ デル GEOS-Chem モデルによる解析を行った。以下で は、本研究から得られた知見をまとめた。 モデル計算結果は福岡、佐渡、隠岐、福江、宮古島 の合計 5 地点において観測された PM 2.5 濃度の時間変 化 、季 節 変 化 を概 ね再 現 していた。しかし、モデルは観 測 値 を過 小 評 価 する傾 向 があった。成 分 ごとの比 較 か ら、モデル計算値の BC、OC が過小であること、これは、 モデルでは考 慮 されない成 分 が存 在 することがモデル の PM 2.5 濃度が過小となる要因として考えられた。 東 アジア地 域 の発 生 源 地 域 を国 ・地 域 、中 国 の省 ご とに 15 領域に分割し、各領域の人為起源排出量の削 減 感 度 計 算 を行 い、各 領 域 の人 為 起 源 汚 染 質 の相 対 寄与率を示した。福岡における年平均として PM 2.5 濃度 に対する人為起源の寄与の内、約 80%は国外寄与であ. Fig. 9 Source-receptor results when the daily averaged environmental standard of PM 2.5 level was exceeded 35µg/m 3 at Fukuoka (between January 2014 and March 2015). Color bar indicates the source region shown in Fig. 1. Solid circle is the observed PM 2.5 , and open circle is the model simulated result (corrected by the regression shown in Fig. 3).. った。影 響 の大 きな地 域 としては中 国 中 北 部 の相 対 寄 与が 19.6%、朝鮮半島の相対寄与が 16.3%であった。季 節ごとの特徴をみると、PM 2.5 が高濃度となる冬季から春 季にかけては約 90%が国外寄与であり、朝鮮半島、およ び、中国東北部から中北部からの寄与が大きかった。 福岡における PM 2.5 濃度が環境基準を超えた 23 日 間 については、冬 季 から春 季 の高 濃 度 現 象 は、この時 期に支配的である朝鮮半島、中国東北部、中国中北部 の寄 与 に加 え、上 海 周 辺 地 域 や河 南 省 などの中 国 中 東 〜中 央 部 、中 国 南 西 部 の寄 与 が重 合 することによっ て引 き起 こされると考 えられた。国 内 寄 与 は東 日 本 側 で. Table 3 Source relative contributions (%) to PM 2.5 in. 高 く、国 外 寄 与 は大 陸 に近 い西 日 本 側 で高 かった。発. Fukuoka when the daily averaged environmental. 生 源 地 域 別 の特 徴 を比 べると、中 国 東 北 部 は日 本 海. standard was exceeded.. 側の地域に、中国中南部は東シナ海側の地域に、中国 中 北 部 の影 響 は全 域 に大 きな影 響 を及 ぼすことを示 し. Source No. Region 1 Japan Region 2 Korea Region 3 NE China Region 4 Liaoning Region 5 Central N. CH. Region 6 Central E. CH. Region 7 Taiwan Region 8. % 11.8. 8.8. 2.2. 7.6. 29.3. Source No. Region 9 Central CH. Region 10 Shanxi Region 11 SW China Region 12 Inland China Region 13 Chuan-Yu. % 11.9. た。季 節 ごとの変 化 としては、夏 季 には国 内 寄 与 が高 く、 冬季から春季には、国外寄与が高いことが判った。 謝辞. 3.9. 本研究は、第 1 著者の修士論文の結果をもとに加筆・ 解 析 を加 えたものである。研 究 の一 部 は、JSPS 科 研 費. 2.0. 基 盤 研 究 S (MEXT/JSPS KAKENHI Grand Number JP25220101) の研究として行った。また、九州大学応用. 5.4. 力学研究所の全国共同利用研究のサポートも受けた。. 0.9. 11.2. China Total. 75.1. 0.1. Ocean Ship. 2.5. 0.5. Others. 1.7. 参考文献 1). 環境省: 微小粒子状物質による大気の汚染に係る 環境基準について (2009).. 2). 環 境 省 : 微 小 粒 子 状 物 質 (PM2.5)に関 す る情 報 (2015a).. 3). 環 境 省 : 平 成 25 年 度 大 気 汚 染 状 況 に つ い て.
(13) 九州大学応用力学研究所所報 第 152 号 2017 年 3 月. 4). (2015b).. 2000-2008: Regional Emission inventory in ASia. 茶谷聡, 森川多津子, 芦崎翠, 平井洋, 國見均:. (REAS) version 2, Atmos. Chem. Phys. , 1 3 ,. わが国の汚染物質濃度に対する発生源・越境輸送 の感度解析, 大気環境学会誌, 4 3 , 79-91 (2008). 5). 7). 8). Zhu, M. Hu, and H. Zhang: A high-resolution. 大気シミュレーションによる2005年度日本三大都市. ammonia emission inventory in China, Global. Biogeochem Cycles , 2 6 , GB1030 (2012).. 度解析, 大気環境学会誌, 4 6 , 101-110 (2011).. 14) 気象庁: 各火山の活動状況 (2014).. Ikeda, K., Yamaji, K., Kanaya, Y., Taketani, F.,. 15) Aiken, A. C., DeCarlo, P. F., Kroll, J. H.,. Pan, X., Komazaki, Y., Kurokawa, J., Ohara, T.:. Worsnop, D. R., Huffman, J. A., Docherty, K. S.,. Sensitivity analysis of source regions to PM 2.5. Ulbich, I. M., Mohr, C., Kimmel, J. R., Sueper, D.,. concentration at Fukue Island, Japan, Journal of. Sun, Y., Zhang, Q., Trimborn, A., Northway, M.,. the Air & Waste Management Association , 6 4 ( 4 ) ,. Ziemann, P. J., Canagaratna, M. R., Onasch, T. B.,. 445-452 (2014).. Alfarra, M. R., Prevot, A. S. H., Dommen, J.,. Ikeda, K., Yamaji, K., Kanaya, Y., Taketani, F.,. Duplissy, J., Metzer, A., Baltensperger, U., and. Pan, X., Komazaki, Y., Kurokawa, J., Ohara, T.:. Jiminez, J. L.: O/C and OM/OC ratios of primary,. Source. secondary, and ambient organic aerosols with. region. attribution. of. PM 2.5. mass. concentrations over Japan, Geochemical Journal ,. high-resolution. 4 9 , 185-194 (2015).. spectrometer, Environ. Sci. Tech. , 4 2 , 4478–4485. Bey, I., Jacob, D. J., Yantosca, R. M., Logan, J. A.,. (2008).. time-of-flight. aerosol. mass. Field, B. D., Fiore, A. M., Li, Q, Liu, H. Y.,. 16) 紀 本 英 志 、植 田 明 子 、辻 本 賢 太 、三 谷 洋 一 、戸 矢. Mickley, L. J., Schultz, M. G.: Global modeling of. 崎 保 雄 、紀 本 岳 志 :, 大 気 エアロゾル化 学 成 分 連. tropospheric. 続自動分析装置の開発, クリーンテクノロジー, 2 3 ,. chemistry. with. assimilated. meteorology: Model description and evaluation, J.. Geophys. Res ., 1 0 6 , 23073-23096 (2001). 9). 11019-11058 (2013). 13) Huang, X., Y. Song, M. Li, J. Li, Q. Huo, X. Cai, T.. 茶谷聡, 森川多津子, 中塚誠次, 松永壮: 3次元 圏 PM 2.5 濃 度 に対 する国 内 発 生 源 ・越 境 輸 送 の感. 6). 11. 49-52 (2013). 17) Itahashi, S., Uno, I., Osada, K., Kamiguchi, Y.,. Uno, I., N. Sugimoto, A. Shimizu, K. Yumimoto, Y.. Yamamoto, S., Tamura, K., Wang, Z., Kurosaki, Y.,. Hara, and Z. Wang: Record heavy PM2.5 air. and Kanaya, Y.: Nitrate transboundary heavy. pollution over China in January 2013: Vertical and. pollution over East Asia in winter, Atmos. Chem.. horizontal dimensions. SOLA , 1 0 , 136 − 140,. Phys.. doi:10.2151/sola.2014-028 (2014).. (2016).. Discuss. ,. doi:10.5194/acp-2016-879. 10) 鵜 野 伊 津 志 ,弓 本 桂 也 ,原 由 香 里 ,板 橋 秀 一 ,金. 18) 板 野 泰 之 、 植 田 明 子 、 辻 本 賢 太 、 紀 本 岳 志 :. 谷 有 剛 ,杉 本 伸 夫 ,大 原 利 眞 : 何 故 2013年 冬 季. PM2.5質量および成分の時間値連続測定に基づく. の中 国 でPM 2.5 が高 濃 度 になったか? 大 気 環 境 学. 大 阪 市 の汚 染 特 性 の解 析 、第 53回 大 気 環 境 学 会. 会誌,4 8 ,. 年会講演演要旨集p. 495, 3F0926 (2012).. 274-280 (2013).. 11) Fairlie, T. D., Jacob, D.J., Park, R.J.: The impact. 19) 森 野 悠 , 茶 谷 聡 , 速 水 洋 , 佐 々木 寛 介 , 森 康 彰 ,. of transpacific transport of mineral dust in the. 森川多津子, 大原利眞, 長谷川就一, 小林伸治:. United States, Atmos. Environ., 4 1 , 1251-1266. 大 気 質 モ デ ル の 相 互 比 較 実 験 に よるO 3 、PM 2.5 予. (2007).. 測 性 能 の 評 価 , 大 気 環 境 学 会 誌 , 4 5 , 212-226. 12) Kurokawa, J., Ohara, T., Morikawa, T., Hanayama,. (2010).. S., Greet, J.-M., Fukui, T., Kawashima, K.,. 20) 中 島 亜 矢 子 , 木 下 誠 , 大 平 良 一 , 宇 野 映 介 , 田. Akimoto, H.: Emissions of air pollutants and. 中 衛 : 福 岡 市 に お け る PM 2.5 成 分 組 成 に つ い て ,. greenhouse gases over Asian regions during. 第56回大気環境学会年会 要旨集, 479 (2015)..
(14) Reports of Research Institute for Applied Mechanics, Kyushu University No.152 (12– 17) March 2017. Effect of the packing structure of silicon chunks on the melting process and carbon reduction in Czochralski silicon crystal growth Xin LIU*1, Xue-Feng HAN*1, Satoshi NAKANO*1 and Koichi KAKIMOTO*1 E-mail of corresponding author: [email protected] (Received January 31, 2017). Abstract Carbon (C) contamination in Czochralski silicon (CZ-Si) crystal growth mainly originates from carbon monoxide (CO) generation on the graphite components, which reaches a maximum during the melting stage. Loading a crucible with poly-Si feedstock includes many technical details for optimization of the melting and growth processes. To investigate the effect of the packing structure of Si chunks on C accumulation in CZ-Si crystal growth, transient global simulations of heat and mass transport were performed for the melting process with different packing structures of poly-Si. The heat transport modeling took into account the effective thermal conductivity (ETC) of the Si feedstock, which is affected by the packing structure. The effect of the chunk size on the melting process and C accumulation were investigated by parametric studies of different packing structures. The heat transport and melting process in the crucible were affected by the ETC and the emissivity of the Si feedstock. It was found that smaller Si chunks packed in the upper part could speed up the melting process and smooth the power profile. Decreasing the duration of the melting process is favorable for reduction of C contamination in the Si feedstock. Parametric studies indicated that optimization of the melting process by the packing structure is possible and essential for C reduction in CZ-Si crystal growth. Keywords: Computer simulation, Impurities, Mass transfer, Czochralski method. 1. Introduction The minority carrier lifetime of silicon (Si) wafers is one of the most important parameters in fabrication of power devices. The bulk lifetime of Si crystals is shortened by oxygen (O) precipitates, which are enhanced by carbon (C) contamination1, 2). Therefore, reduction of C contamination in Czochralski silicon (CZ-Si) crystal growth is required for production of Si wafer with a long carrier lifetime. Contamination of C in Si crystals mainly originates from carbon monoxide (CO) generation on the graphite components, which reaches a maximum in the melting stage3). It is essential to control CO generation and C incorporation from melting to tailing. Loading a crucible with poly-Si feedstock includes many technical details for optimization of the melting and growth processes4). In the CZ-Si process, poly-Si in the form of granules, chunks, or a mixture of chunks and granules is first loaded into a quartz crucible. The packing density of poly-Si within the crucible is greater than about 0.7. For the melting of packed Si chunks, the packing structure can affect the heat transport by the effective thermal conductivity (ETC), which is different from the thermal conductivity of bulk Si. The ETC is a function of many parameters, including the conductivities of the solid and the fluid, porosity, *1 Research Institute for Applied Mechanics, Kyushu Univ.. emissivity, temperature, and chunk size5). Many researchers have proposed ETC models according to different modeling principles6). Several models have the full-function definition, including contributions from conduction of the solid and the fluid, contact of spheres, and thermal radiation. They include the classic ZBS model7) (proposed by Zehner, Bauer, and Schlunder in 1978) and the IAEA model8) (applied by International Atomic Energy Agency in 2000). The IAEA model is a hybrid model based on several proposed models, and it was validated by the experimental data of the pebble bed. Transport phenomena of C as well as relevant impurities and species in the CZ-Si process have been extensively studied in the last few decades9-17). It has been found that back diffusion of the generated CO is the main origin of C contamination in Si feedstock. Accumulation of C in the melt must be investigated according to the transient feature of the CZ-Si process. Bornside et al.13) derived a chemical model for coupled CO and SiO from thermodynamic analysis of their reactions in the high temperature range. Based on this chemical model, Gao et al.14) developed a coupled transport model for SiO and CO in argon (Ar) gas, and C and O in a Si melt. However, the C content predicted under the quasi-static assumption does not account for C accumulation during.
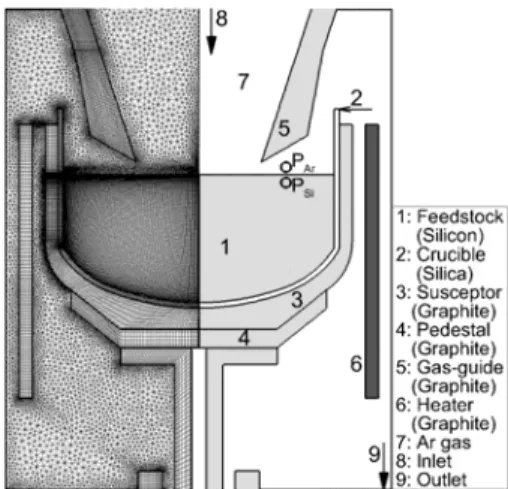
(15) Reports of Research Institute for Applied Mechanics, Kyushu University No.152 March 2017 CZ-Si crystal growth11). Transient global simulations of heat and mass transport have been performed for C accumulation in the melting process of CZ-Si crystal growth16, 17). However, in these studies, packed Si chunks were modeled with the thermal conductivity of bulk Si. The difference between the thermal conductivities of packed Si chunks and bulk Si can result in unreliable prediction of the thermal history of the melting process. The present study focuses on evolution of C contamination during the melting process of packed Si chunks in CZ-Si crystal growth. The heat transport modeling took into account the ETC of packed Si chunks, which is affected by the packing structure, as a function of the chunk size and porosity. The ETC model proposed by IAEA8) was applied in the transient global simulation of the melting process. The effect of the chunk size on the melting process and C accumulation were analyzed by parametric studies of different packing structures.. 2.. Modeling and Formulations. The methodology for transient global simulation of the coupled heat and mass transport during the melting process of CZ-Si crystal growth has been reported elsewhere16). A virtual proportional integral derivative (PID) controller for the temperature 18) was introduced to realize power control of the heater. The coupled boundary conditions for the transport of impurities were modeled based on the chemical reactions in a CZ-Si crystal furnace.. 13. state. The results at two locations in the gas domain and Si domain (labeled as PAr and PSi , respectively) were monitored during the transient global simulation, as shown in Fig. 1. 2.1 IAEA model for the ETC of packed Si chunks In the idealized packing structure, heat is simultaneously transported by four mechanisms: radiation in the void region, conduction of the gas, conduction of spheres, and convection of the gas. The heat flux is considered to consist of three parts excluding convection: a solid conduction–void radiation–solid conduction process, a solid conduction–gas conduction–solid conduction process, and a solid conduction–contact area conduction–solid conduction process. Therefore, the following three different types of effective conductivity must be evaluated: void radiation plus solid conduction ( ker ), gas conduction plus solid conduction ( k ec ), and contact conduction plus solid conduction ( kec ). The total effective conductivity is the sum of these three parts 6): keff ker keg kec (1) Definitions of these three parts can be found in which was validated by IAEA-TECDOC-11638), experimental data for the entire temperature range. In addition, a porosity function must be applied for the packed Si chunks 19):. 1 (1 )exp 6 / . (5). where is the bulk porosity of the homogeneous is the dimensionless wall distance domain and L / d p , where L is the wall distance. At the top surface of the Si feedstock, the boundary condition of thermal equilibrium is keff. T 4 SB Eeff T 4 Tenv n. (6). where is the effective emissivity of the packed Si chunks, which is given by the fitted function20).. . . Eeff E S 1 0.95exp 1000d p 1 E S .. (7). where ES is the emissivity of Si and d p is the equivalent diameter of the Si chunks.. 2.2 Reactions and deposition on the surface of Si chunks Fig. 1 Configuration and grids used to simulate the melting process of CZ-Si crystal growth. The configuration of the system and the computational grids for the melting process of CZ-Si crystal growth are shown in Fig. 1. The furnace was divided into a number of domains and a structured mesh was generated for the solid and Si feedstock domains, while an unstructured mesh was applied for the Ar gas domain. The furnace is described in detail in Ref. 16). In order to simplify the transient global modeling, the volume of Si domain was kept constant, and set the density as bulk Si or melted Si according to its phase. The chemical reactions and transport mechanisms of the species during the melting process in CZ-Si growth are shown schematically in Fig. 2. The coupled boundary conditions for the transport of impurities were modeled based on the following six reactions that occur in a CZ furnace: (1) Crucible/susceptor interface: SiO2 s +C s CO g +SiO g . (2) Graphite fixture surfaces: SiO 2 s +C s CO g +SiO g . (3) Melt/crucible interface: SiO2 s Si m +2O m . (4) Gas/Si interface (for O):.
(16) 14. Xin LIU et al.: Packing structure of Si chunks on melting process and C reduction in CZ-Si Crystal Growth. Si m +O m SiO g . (5) Gas/Si interface (for C): CO g C m +O m . (6) Gas/Si interface (for SiC): 2Si s/m +CO g SiC s +SiO g . In the above equations, (s) denotes a solid, (m) denotes a melt, and (g) denotes a gas. These coupled boundary conditions were defined and implemented in the same manner as in Ref. 16).. reaction between gaseous CO and solid Si was assumed to occur in a similar way to the process that occurs in a packed-bed reactor. The generated SiC was assumed to dissolve in the melt as C and Si atoms until the C concentration reached the limit of the solubility of C. Finally, C contamination in the melted Si feedstock from dissolution of SiC can be predicted. The other boundary conditions for the Ar gas and Si headstock were as follows. A zero-flux boundary condition was used for C at the crucible wall. Zero SiO and CO fluxes were used for the non-C walls and the symmetry axis in the gas. The SiO and CO concentrations were set to zero for the gas inlet. Zero SiO and CO gradients were used for the gas outlet.. 3.. Fig. 2 Schematic of the transport of the species during the melting stage of CZ-Si crystal growth. Si chunks and melted Si coexist in the crucible during the melting process. Reactions (4)–(6) are involved at the gas/Si interface and in the unmelted Si feedstock. To investigate the surface reaction and deposition, a simplified model for SiC generation by the reaction between CO and Si was used for the surface of the packed Si chunks17). O, C, SiO, CO, and SiC coexist in the unmelted Si feedstock and at the gas/Si interface. In reaction (6), CO is consumed and SiO is generated in the solid Si feedstock. Unmelted Si is defined as the buffer between the melt and the gas. SiO and CO diffuse in this porous media with effective diffusion coefficients. The block-shaped Si feedstock was assumed to be equivalent to identical spheres with FCC packing and porosity of 1 / 18 . Under this assumption, gaseous SiO and CO can penetrate into the porous Si feedstock. Deposition of SiC on the surfaces of the blocky Si feedstock was modeled using a volume generation source:. . . 0 GSiC K SiC AV CCO CCO ,. Results and discussion. Incorporation of C from the gas/melt interface proceeds from the melting stage to the tailing stage. According to accumulation of C in the Si feedstock, the thermal history, processing duration, and Ar gas flow pattern are the key factors for C reduction. The accumulation process of C can only be predicted by transient global simulation. Therefore, a set of transient global simulations was performed for the melting process of CZ-Si crystal growth with different packing structures. The thermal field, melt and gas flow, and transport of the species were dynamically predicted using fully coupled boundary conditions for the heat, flow, and species. The reference values of furnace pressure and Ar gas flow rate were set to 15 Torr and 10 SLPM (standard liter per minute at 273.15 K and 760 Torr), respectively. Packed Si chunks were modeled by the closest packing of identical spheres with the ETC model from the IAEA. The porosity function with a bulk porosity of 0.26 was involved in the ETC model for every case. Porosity and chunk size were included only in the ETC model but not the control volume and mass of transport equations. The heights of solid and melt were also set with identical value, with the weight about 120 kg of bulk Si. A top layer with the thickness of 50 mm was set as the area of interest. 3.1 Relationship between the ETC and the Si chunk size or porosity. (8). where K SiC is the reaction equilibrium constant ( K SiC exp 9610 / T 3 ), AV is the specific surface area 0 (by volume), and CCO CCO is the increase in the CO content. Diffusion transport of CO and SiO in void areas was assumed to be dominated by the effective diffusion coefficient: Deff DAr , (9) where DAr is the diffusion coefficient in Ar gas. The. (a).
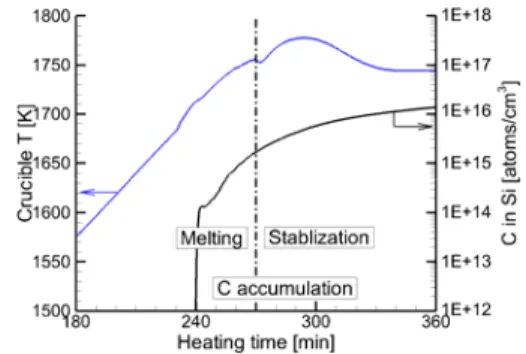
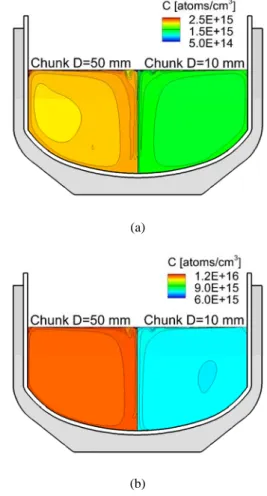
(17) Reports of Research Institute for Applied Mechanics, Kyushu University No.152 March 2017. 15. The heater power profiles and the monitored Si temperature are plotted in Fig. 4 with the ETC model (porous Si chunks) and without the ETC model (ideal bulk Si). Application of the ETC model leads to significant differences in the heating power and melting duration for identical setting temperature profiles of the heater. This indicates that the effect of porous Si on the thermal history cannot be ignored when modeling the melting process.. (b) Fig. 3 ETC profiles for (a) different sized Si chunks and (b) different porosities of the packing structure. To investigate the effect of the packing structure of Si on the melting process, two of the important parameters of the ETC model were considered: the chunk size and the porosity. Because the ETC is a function of the packing structure and the temperature, the ETCs for different porosities and different chunk sizes were plotted for a wide temperature range. Comparison of the ETC profiles for different sized chunks is shown in Fig. 3(a) with a constant porosity of 0.26. The thermal conductivity of bulk Si is always higher than the ETCs for different chunk sizes except in the high temperature range. Thus, the difference between the conductivities has to be taken into account by the ETC model of packed Si chunks. Increasing the chunk size resulted in an increase of the ETC, as well as the temperature. These trends are related to the thermal radiation contribution of the ETC model, which is proportional to 4 d p T 4 . At high temperatures, thermal radiation among chunks dominates the heat transport in the packed Si feedstock. Comparison of ETC profiles for different porosity packing structures is shown in Fig. 3(b) with a constant equivalent diameter of 50 mm. With increasing porosity, the ETC increases and exceeds the conductivity of bulk Si in the high temperature range. Thermal radiation is also enhanced by the increase of the void space between packed Si chunks. Because the ETC model is fully coupled with the temperature, it is believed that the chunk size and porosity of packed Si could affect the thermal history of melting. 3.2 Effect of the ETC model on the melting duration and C contamination. With the effective conductivity model, a transient global simulation of heat and mass transport was performed for the entire melting process with the ETC model. PID control18) of the temperature at the heater was implemented by manipulating the heating power. The heater temperature reached the set point (1835 K) from its initial state in 4 h. The Si feedstock in the crucible melted and then stabilized for the next stage. The temperature at the top center of the Si feedstock was monitored as indicator of the fully melted state.. Fig. 4 Power profiles and temperature evolution by the thermal conductivity of bulk Si and the ETC model of porous Si.. Fig. 5 Temperature evolution of the crucible wall and the C concentration of the monitoring point in the Si feedstock. The temperature at the end of the vertical crucible wall was monitored as judgment of the melting start. CO incorporated into Si as C from the melt surface. The monitored crucible temperature and the C concentration in the Si feedstock temperature are plotted in Fig. 5. C contamination before melting is insignificant. C accumulation started from the melting stage, and lasted until the stabilization stage. This plot indicates that most C contamination comes from the stabilization stage owing to the larger incorporation area. 3.3 Effect of the chunk size on the melting duration and C contamination. A top layer with the thickness of 50 mm was set as the area of interest to investigate the chunk size effect on the melting process and C accumulation. The layer of interest was replaced by smaller chunks with diameters of 10 and 25 mm. Small chunks packed in the upper part of the layer can.
(18) 16. Xin LIU et al.: Packing structure of Si chunks on melting process and C reduction in CZ-Si Crystal Growth. reduce the total time of the melting process, as shown in Fig. 6(a). For the 10 mm chunks, the durations of melting and stabilization were both shorter than those for the 50 mm chunks. The total duration of melting and stabilization was shortened by the decrease of Si chunk size in the interested layer. Comparison of the power profiles and temperature evolution are shown in Fig. 6(b). Smaller Si chunks packed in top part smoothed the power profile and sped up the melting process. This is because heat loss at the top surface follows the heat flux boundary condition, the heat balance between conduction flux and radiation flux (Eq. 6). Small Si chunks result in lower ETC and effective emissivity. Loading small chunks in the upper part of the layer can reduce heat loss because of the lower ETC and effective emissivity.. was a 36% decrease for the final C concentration of the melting process. Therefore, small chunks packed in the upper part of the layer can reduce C accumulation in Si by speeding up the melting process.. (a). (a). (b) Fig. 7 Effect of the chunk size on C accumulation. (a) C accumulation during the melting stage and (b) C accumulation during the stabilization stage for 50 (left) and 10 mm (right) chunks.. 4. Conclusion. (b) Fig. 6 Effect of the chunk size on the melting process. (a) Duration of melting (black) and the stabilization stage (red) for different chunk sizes and (b) power profiles and temperature evolution for 10 and 50 mm chunks. The effect of the packing structure on C contamination was also investigated in the melting and stabilization stages. The concentration of C in melted Si is compared for 50 mm and 10 mm chunks in Fig 7(a). Small Si chunks packed in the top part of the layer resulted in much lower C contamination. The final C concentrations after the stabilization stage for these two cases are shown in Fig. 7(b). With 10 mm Si chunks packed in the upper part of the layer, the total C concentration decreased by 24% after melting, while there. To investigate C contamination prior to the growth stage of CZ-Si crystal growth, transient global simulations of heat and mass transport were performed for the melting process of CZ-Si with different packing structures of Si chunks. The heat transport modeling took into account the ETC of the packed Si chunks, which depends on the parameters of the packing structure. The ETC model proposed by IAEA was used in the melting process prediction of packed Si. Parametric studies of different packing structures indicate that heat transport in the crucible is affected by the ETC and the emissivity of the Si feedstock. It was found that smaller Si chunks packed in the upper part of the layer can speed up the melting process and smooth the power profile by heat loss reduction. Decrease in the durations of melting and the stabilization stage resulted in reduction of C accumulation in the Si feedstock. Optimization of the melting process by the.
(19) Reports of Research Institute for Applied Mechanics, Kyushu University No.152 March 2017 packing structure is possible and essential for C reduction in CZ-Si crystal growth. Random packing of irregular shaped and various sizes of Si chunks or granules needs to be investigated to determine the generality of the findings.. Acknowledgment. This work was partially supported by the New Energy and Industrial Technology Development Organization (NEDO) under the Ministry of Economy, Trade and Industry (METI), Japan.. References 1) K. Seigô, M. Yoshiaki, K. Masaru, I. Takashi, Thermally induced microdefects in Czochralski-grown silicon: nucleation and growth behavior, Jpn. J. Appl. Phys., 21 (1982), pp. 1-12. 2) Y. Nagai, S. Nakagawa, K. Kashima, Crystal growth of MCZ silicon with ultralow carbon concentration, J. Cryst. Growth, 401 (2014), pp. 737-739. 3) L. Raabe, O. Pätzold, I. Kupka, J. Ehrig, S. Würzner, M. Stelter, The effect of graphite components and crucible coating on the behaviour of carbon and oxygen in multicrystalline silicon, J. Cryst. Growth, 318 (2011), pp. 234-238. 4) U. Martini, L. Bonanno, P. Collareta, M. Porrini, Method of loading a charge of polysilicon into a crucible, in, Google Patents, 2014. 5) W. van Antwerpen, C.G. du Toit, P.G. Rousseau, A review of correlations to model the packing structure and effective thermal conductivity in packed beds of mono-sized spherical particles, Nucl. Eng. Des., 240 (2010), pp. 1803-1818. 6) W. Van Antwerpen, Modelling the effective thermal conductivity in the near-wall region of a packed pebble bed, in, North-West University, Potchefstroom, South Africa, 2009. 7) R. Bauer, E.U. Schluender, Effective radial thermal conductivity of packings in gas flow. Part II. Thermal conductivity of the packing fraction without gas flow, International Journal of Chemical Engineering, 18 (1978), pp. 189-204. 8) I.A.E. Agency, Heat transport and afterheat removal for gas cooled reactors under accident conditions, in, International Atomic Energy Agency (IAEA), Vienna, 2001, pp. 301-304. 9) H.M. Liaw, Oxygen and carbon in Czochralski-grown silicon, Microelectronics Journal, 12 (1981), pp. 33-36. 10) B.O. Kolbesen, A. Mühlbauer, Carbon in silicon: Properties and impact on devices, Solid-State Electron., 25 (1982), pp. 759-775. 11) R.W. Series, K.G. Barraclough, Control of carbon in Czochralski silicon crystals, J. Cryst. Growth, 63 (1983), pp. 219-221.. 17. 12) T. Fukuda, M. Koizuka, A. Ohsawa, A Czochralski silicon growth technique which reduces carbon to the order of 1014 per cubic centimeter, J. Electrochem. Soc., 141 (1994), pp. 2216-2220. 13) D.E. Bornside, R.A. Brown, T. Fujiwara, H. Fujiwara, T. Kubo, The effects of gas-phase convection on carbon contamination of Czochralski-grown silicon, J. Electrochem. Soc., 142 (1995), pp. 2790-2804. 14) B. Gao, K. Kakimoto, Global simulation of coupled carbon and oxygen transport in a Czochralski furnace for silicon crystal growth, J. Cryst. Growth, 312 (2010), pp. 2972-2976. 15) A.N. Vorob’ev, A.P. Sid’ko, V.V. Kalaev, Advanced chemical model for analysis of Cz and DS Si-crystal growth, J. Cryst. Growth, 386 (2014), pp. 226-234. 16) X. Liu, B. Gao, K. Kakimoto, Numerical investigation of carbon contamination during the melting process of Czochralski silicon crystal growth, J. Cryst. Growth, 417 (2015), pp. 58-64. 17) X. Liu, B. Gao, S. Nakano, K. Kakimoto, Numerical investigation of carbon and silicon carbide contamination during the melting process of the Czochralski silicon crystal growth, Cryst. Res. Technol., 50 (2015), pp. 458-463. 18) Y. Lee, J. Lee, S. Park, PID controller tuning for integrating and unstable processes with time delay, Chem. Eng. Sci., 55 (2000), pp. 3481-3493. 19) M.L. Hunt, C.L. Tien, Non-darcian flow, heat and mass transfer in catalytic packed-bed reactors, Chem. Eng. Sci., 45 (1990), pp. 55-63. 20) J. Yamada, Y. Kurosaki, T. Nagai, Radiation Heat Transfer Between Fluidizing Particles and a Heat Transfer Surface in a Fluidized Bed, J. Heat Transfer, 123 (2001), pp. 458-465..
(20)
図
+7

関連したドキュメント
It is suggested by our method that most of the quadratic algebras for all St¨ ackel equivalence classes of 3D second order quantum superintegrable systems on conformally flat
[11] Karsai J., On the asymptotic behaviour of solution of second order linear differential equations with small damping, Acta Math. 61
Keywords: continuous time random walk, Brownian motion, collision time, skew Young tableaux, tandem queue.. AMS 2000 Subject Classification: Primary:
This paper is devoted to the investigation of the global asymptotic stability properties of switched systems subject to internal constant point delays, while the matrices defining
Related to this, we examine the modular theory for positive projections from a von Neumann algebra onto a Jordan image of another von Neumann alge- bra, and use such projections
Proof.. One can choose Z such that is has contractible connected components. This simply follows from the general fact that under the assumption that the functor i : Gr // T is
Then it follows immediately from a suitable version of “Hensel’s Lemma” [cf., e.g., the argument of [4], Lemma 2.1] that S may be obtained, as the notation suggests, as the m A
We will give a different proof of a slightly weaker result, and then prove Theorem 7.3 below, which sharpens both results considerably; in both cases f denotes the canonical
