Full-field digital mammography システム
における異なる乳腺密度とコントラスト雑音比
の検討
中 村 哲 子
鈴鹿医療科学大学大学院 医療科学研究科 医療科学専攻
博士(医療科学)の学位申請論文
指導教員 奥田逸子 客員教授
2019 年3月
博 士 論 文 審 査 委 員
主査 柴田幸一 教授
副査 山本晧二 教授
副査 有馬 寧 教授
副査 東出 了 准教授
副査 中舍 幸司 助教
1 DH16103 中村哲子 【様式2】
Full-field digital mammography システムにおける異なる乳腺密度とコントラスト雑音比の検討
医療科学専攻 中村 哲子 (指導教員 : 奥田 逸子客員教授) 【はじめに】 乳房は乳腺と脂肪組織から成り、乳腺は脂肪組織と比べ X 線の透過性が低い。マンモグラフィ(以下、 MMG)では乳腺と脂肪組織の X 線減弱の差が画像のコントラストとなる。MMG における乳癌の検出に乳 腺密度が大きく関係する。また、乳腺密度の高い高濃度乳腺は、乳癌の検出感度を低下させる。 MMG の被ばくは皮膚表面ではなく計算値である平均乳腺線量(Average glandular dose ; AGD)で表さ れる。AGD は予測変数であり、さらに画質と線量はトレードオフの関係にある。乳腺密度の違いによる MMG の画質評価に関する報告は少ない。画質の物理的指標の一つであるコントラスト雑音比(Contrast to noise ratio ; CNR)と乳腺密度の関係を数値化することは、検出感度が低下する高濃度乳腺の乳癌診 断において有益なデータとなり得る。完全な画像評価は複数の測定方法を必要とするため、MMG にお ける画質評価の指標の一つとして用いられる CNR と AGD との複雑な関係は完全に解明されていない。 我々は AGD と CNR との相関がファントム研究から解明できれば、MMG の撮影中にこの知識を適用して、 乳癌診断の信頼性を向上するためのツールとして使用できると仮定する。 【目的】
乳房撮影装置(Full-field digital mammography : FFDM)において、乳腺密度、乳房の厚さ、AGD が CNR に及ぼす影響について検討し、AGD と乳腺密度を用いて CNR を高精度に予測する計算式を開発 する。 【方法】 General Electric 社製 FFDM システムおよび異なる乳腺密度(乳腺/脂肪)を有する 3 種類の乳房モデ ル A(30/70)、B(50/50)、C(70/30)の乳房等価ファントムを使用した。5mm、10mm、20mm の厚さのファン トムを組み合わせ、10m から 70mm までの 7 つの厚さの乳房モデルを作成した。ファントム撮影はターゲッ ト/付加フィルタおよび管電圧を自動的に選択する自動露出機構を用いた。装置に表示されたファントム 画像の撮影条件(管電圧、管電流時間積、AGD)を記録した。各乳房モデルは 3 回撮影し、各表示値の 平均値を CNR 計算に用いた。CNR 測定は IEC61223-3-2Ed.2.0 に記載されたガイドラインに従って実施 した。100mm×100mm×0.2mm サイズの 99.9%高純度アルミニウム板をコントラスト物質としてファントムの 中心に配置した。撮影した画像は各乳房モデルの中心にアルミニウム板あり、またはなしの 2 種類であっ た。得られた 2 種類の画像について、乳房支持台ユニットの胸壁端から 60mm離れた乳頭側で X 線管 長軸方向の中央線上に対応する 20mm×20mmの矩形関心領域(ROI)を設定し、Image J ソフトウェアを 用いてアルミニウム板あり、またはなしの二つの画像の ROI 内の平均画素値を測定した。測定された画 素値から数式に従い CNR 値を算出した。統計解析には SAS 社製統計ソフトウェア JMP ver13.1.0 を用 いた。Excel 関数を使用して、各乳腺密度について予測式を得た。二乗平均平方根誤差(RMSE)分析を 用いて、AGD によって調整された CNR の予測値を、各乳腺密度についての実際の CNR 値と比較するこ とによって、予測精度を評価した。
2 DH16103 中村哲子 【結果】 CNR 値は、全ての厚さで乳房モデル A(30/70)において最も高かった。より低い乳腺密度およ びより低い乳房モデル厚さでより高い CNR 値が得られた。 3 つの乳房モデル間の CNR の変動は、 より低いファントム厚さ(10〜30mm)では低い(変動係数、3.4〜8.7%)が、より高いファントム厚さで は高い(変動係数、10.5〜16.8% 50~70mm)。特に、乳房モデルの厚さが 70mm の場合、乳房モ デル C(70/30)の CNR は乳房モデル A(30/70)のそれに比べて相対的に 26%低かった。乳腺密 度および AGD の p 値はそれぞれ 0.0476 および<0.0001 であり、統計的有意差を示した。結果は、 乳腺密度および AGD の両方が CNR の重要な予測因子であることを示した。乳房モデル A (30/70 )と C(70/30)は両モデル間の CNR に統計学的有意差を示した。3 つの乳腺密度はすべ てにおいて、CNR と AGD との間に強い負の相関(r = -0.8989)があった。CNR 予測式は次式のよ うに得られた。CNR = -10.81×AGD + 各乳腺密度の係数 + 27.1 この予測式は r2 = 0.865 および二乗平均平方根誤差(RMSE) = 1.893 であり、AGD、乳腺密度を 用いて CNR を予測することが可能であることを示した。 【考察】 CNR は様々な画像診断装置における画質の指標と考えられている。画像処理および画像表示 はデジタル画像機器の画質に影響を与えるため、画像を物理的に評価し画質を評価することは重 要である。したがって、画質の唯一の指標として CNR を使用することは理想的ではない。本研究で は、乳房等価ファントムを用いて乳房 X 線撮影の異なる組織密度と厚さに基づく CNR と AGD を検 討した。我々の結果は、より低い乳腺組密度およびより低い厚さを有する乳房ファントムでより高い CNR 値が得られたことを示した。これらの結果は、MMG 画像の品質が高密度の乳房ではより劣っ ているという以前からの知見を裏付けている。さらに、MMG における乳房の厚さの CNR と画質の関 係を明らかにしている。 多変量解析では、乳腺密度および AGD の両方が CNR の重要な予測因子であり、AGD は CNR に大きな影響を与えることが示された。 CNR は、合理的に高い精度(r2は 0.865、RMSE は 1.893) で、AGD と乳腺密度を用いた予測式によって計算することができた。異なる乳腺密度を有する乳 房モデル間で、CNR の統計的に有意な差が観察された。 3 つの乳腺密度すべてにおいて、CNR と AGD との間に強い負の相関が見出された。 FFDM システムを使用して AGD および乳腺密度情 報から CNR を容易かつ正確に予測するための CNR 予測式が構築された。 CNR と乳腺密度、 AGD、およびファントム厚さとの相関を評価することを目的とした多変量線形回帰分析モデルは、 乳腺密度およびファントム厚さと CNR との間に有意な相関を示した。しかし、解析モデルに組み込 まれた各変数が独立していることを保証する必要があり、解析モデルに関連する変数を同時に組 み込むと結果が悪化することが知られている。したがって、ファントム厚さを組み込んだ第 1 のモデ ルと AGD を組み込んだ第 2 のモデルの 2 つの追加モデルを使用して回帰分析を行った。臨床で は、CNR に類似した観察項目を測定することが困難であり、臨床応用の観点から AGD を説明変数 として使用することが重要であることに留意されたい。 【結論】 FFDM システムにおいて、乳腺密度、乳房の厚さ、AGD が CNR におよぼす影響について検討し た。そして、CNR が AGD および乳腺密度を用いて高精度に予測可能であると示唆された。乳腺密 度に基づく CNR 予測は、乳癌診断における MMG の診断信頼性を数値化し、乳腺密度が CNR に 及ぼす影響を客観的に管理し、乳癌診断の信頼性を向上するためのツールとして期待できる。
3 Table of contents
1.Abstract ... 4
2.Key word ... 4
3.Introduction ... 4
4.Materials and Methods ... 5
4.1. Breast-Equivalent Phantoms ... 5
4.2. Imaging of Breast-Equivalent Phantoms ... 6
4.3. CNR Measurements and Calculation ... 6
4.4. Statistical Analysis ... 6 5.Results ... 7 6.Discussion ... 9 7.Conclusions ... 10 8.Acknowledgments ... 10 9.References ... 10
10.Research achievement list ... 28
4
Effect of different breast densities and average glandular dose on contrast to noise ratios in full-field digital mammography: Simulation and phantom study
Noriko Nakamura,1,2 Yuka Okafuji,1 Saori Adachi,1 Kana Takahashi,3 Takashi Nakakuma,3 Sohichirou
Ueno3
1 Department of Radiology, Ageo Central General Hospital, Ageo-city, Saitama 362-8588 Japan 2Graduate School of Health Science, Suzuka University of Medical Science, Mie 510-0293, Japan 3 Department of Breast Surgery, Ageo Central General Hospital, Ageo-city, Saitama 362-8588 Japan
Correspondence should be addressed to Noriko Nakamura; [email protected]
1. Abstract
We aimed to investigate the effects of mammary gland density and average glandular dose (AGD) on contrast-to-noise ratio (CNR) of breast-equivalent phantoms with different mammary gland/fat tissue ratios. Full-field digital-mammography breast X-rays were performed on breast-equivalent phantoms with three different mammary gland/fat tissue ratios (Phantom A [30/70], Phantom B [50/50], and Phantom C [70/30]) and seven thicknesses ranging from 10 mm to 70 mm. The prediction formula for the CNR was calculated by multivariate analysis and the effects of the various parameters on CNR were evaluated using a multiple regression analysis model. Higher CNR values were obtained with lower mammary gland/fat tissue ratios and lower phantom thicknesses. Variation in CNR among the three breast models was low (coefficient of variation, 3.4–8.7%) at lower phantom thicknesses (10–30 mm), and high (coefficient of variation, 10.5–16.8%) at higher phantom thickness (50–70 mm). CNR showed a strong negative correlation (r = -0.8989) with AGD across all three mammary gland ratios. A predictive formula for CNR using AGD and mammary gland density was developed. CNR can be predicted with high precision using AGD and mammary gland density. The predicted CNR could be used to measure the diagnostic reliability of mammography in breast cancer.
2. Key word
Average Glandular Dose, Contrast to Noise Ratios, Full-Field Digital Mammography, Different Breast Densities
3. Introduction
Early detection of breast cancer though mammographic screening has significantly reduced breast cancer mortality [1]. Since mammary glands are less permeable to X-rays than fat tissue in the breast, mammography (MMG) essentially creates a contrast image of the breast based on differences in X-ray attenuation by different tissue components [2]. The area ratio of mammary gland tissue to the fat tissue within the entire breast mammogram is referred to as the mammary gland density in MMG. Breast density
5
is a significant factor in the reliability of breast cancer diagnosis for two reasons. Dense breast tissue has not only been demonstrated to be a risk factor for breast cancer in Western [3-9] and Japanese women [10-12], it is also known to reduce the detection sensitivity of breast cancer in clinical settings [13]. Kolb et al. [13] reported that the detection
sensitivity of cancer in low-density mammary gland tissue is 83%–98% compared to 48%–64% in dense breast tissue.
Considering the importance of breast density in cancer diagnosis and risk evaluation, the American College of Radiology has proposed a Breast Imaging Reporting and Data System (BI-RADS) classification system for standardized interpretation and reporting of mammograms [14]. As per the latest version, lesions are classified into six grades, including two high-risk grades that pertain to highly dense mammary gland breast tissue. Appropriate diagnosis depends not only on proper interpretation but also on good mammogram image quality [15]. Identifying breast cancer in dense breast tissue is challenging because of the masking effect of the mammary glands, which results in poor image quality in dense breasts [8,16,17]. Currently, most mammography equipment uses full field digital mammography (FFDM), which has a high detection quantum efficiency. FFDM enables the acquisition of images suitable for diagnosis with the addition of image processing, even in thickened breast tissue. Such imaging has been shown to be effective in breast cancer screening in dense breasts [18].
One of the physical indicators of digital imaging quality is contrast to noise ratio (CNR) [19]. CNR is used to manage the precision of digital equipment and to compare their performance. By increasing the exposure and average glandular dose (AGD) of radiation, the MMG image quality in dense breast tissue can be improved [20]. There is, however, a trade-off relationship between image quality and exposure. To optimize image quality, especially in thick breast tissues, it is important to understand the complex relationship between the CNR and AGD in MMG. Breast-equivalent phantoms mimic the 3-dimensional structure of the human breast and offer an attractive option to study the variation of CNR and AGD with different breast thicknesses [21]. Breast phantoms are available in different thicknesses and tissue ratios corresponding to varying mammary gland densities and have been extensively used for MMG imaging studies [22,23]. A previous study using breast phantoms showed AGD increases with increasing breast thickness [24]. Another study with breast phantoms showed that with increased breast thickness, AGD values increase and CNR values decrease [25]. The aim of this study was to corroborate the relationship between CNR, mammary gland ratio, AGD, and phantom thickness using breast phantoms of varying thickness. We hypothesized that the correlation of AGD and CNR could be applied to clinical settings to enable the acquisition of images with an optimal trade-off between image quality and radiation dose.
4. Materials and Methods
An FFDM breast X-ray device and three types of breast-equivalent phantoms with different tissue ratios were used. The prediction formula for the CNR was calculated by multivariate analysis, and the effects of the various mammary gland densities and AGD on CNR were evaluated using a statistical analysis model.
6 4.1. Breast-Equivalent Phantoms
Breast-equivalent phantoms (Eastek Breast Phantom Research Set CI RS Model 14A, Norfolk, VA) of three mammary gland/fat tissue ratios were used: Phantom A (30/70), Phantom B (50/50), and Phantom C (70/30). By combining individual phantoms of 5-mm, 10-mm and 20-mm thicknesses, breast phantom models of seven thicknesses ranging from 10 mm to 70 mm were created. A polymethyl methacrylate phantom was arranged around the periphery of the breast model to suppress the effect of scattered radiation, and the device was configured so the detector was completely covered (Fig. 1).
4.2. Imaging of Breast-Equivalent Phantoms
The phantoms (three tissue ratios, seven thicknesses) were imaged using FFDM (General Electric Senographe Essential F, Buc, France). Imaging was performed using the Auto Exposure Control imaging mode, which automatically selected the target/additional filter combinations (molybdenum [Mo]/Mo, Mo/rhodium [Rh], or Rh/Rh) and tube voltage for imaging. The imaging conditions (tube voltage, current time product [mAs value], and average glandular dose [AGD]) as displayed on the equipment were recorded. Each breast model was imaged thrice and the mean of each displayed value was calculated.
4.3. CNR Measurements and Calculation
CNR measurements were performed following the guidelines described in IEC 61223-3-2Ed.2.0 [26]. A 99.9% pure aluminum plate (CIRS T43009) measuring 100 mm × 100 mm × 0.2 mm was placed at the center of the phantom as a contrast substance. Images were acquired with and without the aluminum plate in place for each breast model. A 20 mm × 20 mm rectangular region of interest (ROI) was marked along the central line on the longitudinal axis of the X-ray for the two captured images, corresponding to the nipple side and 60 mm away from the chest wall side of the breast support table. The average pixel value within the ROI was measured in both images (with and without the aluminum plate, Fig. 2) using ImageJ software (National Institutes of Health, Bethesda, MD).
CNR values were calculated from the measured pixel values according to the following previously published equation (1) [27].
(1)
where is the mean pixel value of the 20 × 20 mm ROI with the aluminum plate in position, is the corresponding pixel value standard deviation, is the mean pixel value without the aluminum
plate in place, and is the corresponding pixel value standard deviation.
7
SAS JMP ver13.1.0 (SAS Institute, Cary, NC) and Student’s t test were used and p < 0.05 was considered significant for all statistical analyses. Residual sum of squares and multivariate (simple linear regression) analysis were performed with the mammary gland tissue ratio and AGD as independent variables and the CNR as the dependent variable to assess the effect of the mammary gland tissue ratio and AGD on CNR. The mean CNR at each mammary gland tissue ratio was adjusted by the AGD as a covariate and the difference in CNR values between different mammary gland tissue ratios was determined.
Next, the correlation between the AGD and CNR was assessed for each mammary gland ratio. A strong positive correlation was defined as r ≥ 0.7. Using an Excel function, a prediction equation was obtained for each mammary gland ratio. Using the root mean square error (RMSE) analysis, prediction accuracy was assessed by comparing the predicted values of the CNR adjusted by the AGD with the actual CNR values for each mammary
gland ratio.
A multivariate (least squares method) analysis was performed with the mammary gland tissue ratio (30/70, 50/50, 70/30) and AGD as independent variables and the CNR as a dependent variable to identify the factors associated with CNR. Factors with t-values below |2.00| were defined as not contributing significantly to the CNR. Additionally, larger absolute values were defined to have a greater contribution. A predictive formula of CNR was obtained by generalizing the analysis model. Predicted and measured values of the CNR were compared using the RMSE to evaluate the accuracy of the predictive formula. Finally, a multivariate linear regression model with the CNR as the objective variable and mammary gland ratio, AGD, and phantom thickness as the explanatory variables was constructed, with the intent to determine the correlation between the CNR and each measurement item. Additionally, analysis of variance based on the constructed multivariate linear regression model was conducted and the contribution rate for each of the variables was calculated. For the analysis of variance, the mammary gland ratio used AGD as the variable factor and phantom thickness as the continuous variable. R (v. 3.2.4) was used for this analysis (R Foundation for Statistical Computing, Vienna, Austria) and Wald Test was used to estimate the regression coefficient and 95% confidence interval.
5. Results
Table 1 and Figure 3 show the imaging conditions and CNR values calculated for the three breast models with different tissue ratios and thicknesses. CNR values were highest in Phantom A (30/70) at all thicknesses. In general, higher CNR values were obtained with lower mammary gland ratios and lower phantom thicknesses. The variation in CNR among the three breast models was low (coefficient of variation, 3.4-8.7%) at lower phantom thicknesses (10–30 mm), and increased (coefficient of variation, 10.5-16.8%) with increases in phantom thickness (50–70 mm). Notably, with a breast model thickness of 70 mm, the CNR in breast model C (70/30) was 26% lower compared to that in breast model A (30/70). Table 2 shows the results of the multivariate analysis performed to investigate the effects of the mammary gland tissue ratio and AGD on the CNR. The p-values for the mammary gland ratio and AGD were < 0.0476 and < 0.0001, respectively, showing statistical significance. The results showed that both the mammary gland ratio and AGD were significant predictors of CNR.
8
The mean CNR of each mammary gland ratio adjusted by the AGD as a covariate is shown in Table 3. The difference in CNR between mammary gland ratios is shown in Table 4. The p-value for the comparison between Phantoms A (30/70) and C (70/30) was 0.0213, showing a statistically significant difference in CNR between the two models.
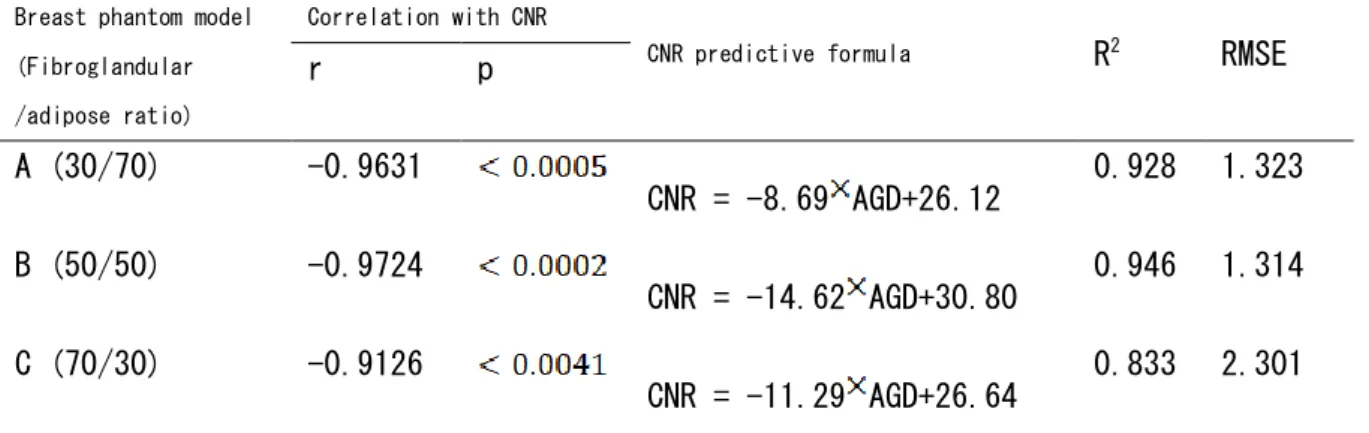
Figure 4 shows that there was a strong negative correlation (r = -0.8989) between the CNR and AGD across all three mammary gland ratios. In addition, a strong negative correlation (r = -0.8989) was also observed between the CNR and AGD at each mammary gland ratio. The prediction equations for the CNR based on the AGD values for each mammary gland ratio are provided in Table 5. The comparison between the predicted values of the CNR adjusted by AGD and the actual CNR values for each mammary gland ratio are shown in Figure 5 and Table 5. The accuracy of the CNR predicted by the mammary gland ratio was highest (r2 = 0.946, RMSE = 1.314) in Phantom B (50/50), followed by Phantom A (30/70) (r2 = 0.928, RMSE = 1.323) and Phantom C (70/30) (r2 = 0.833, RMSE = 2.301).
Based on the multivariate (least squares method) analysis of the mammary gland tissue ratio and AGD as independent variables and the CNR as a dependent variable, and on generalizing the analysis model, the CNR-predictive formula was obtained as follows (equations 2,3,4):
Fibroglandular adipose mass (%) : 30/70
(2) Fibroglandular adipose mass (%) : 50/50
(3) Fibroglandular adipose mass (%) : 70/30
(4)
This predictive formula revealed r2 = 0.865 and RMSE = 1.893, indicating that it is possible to predict the CNR using the AGD and mammary gland ratio.
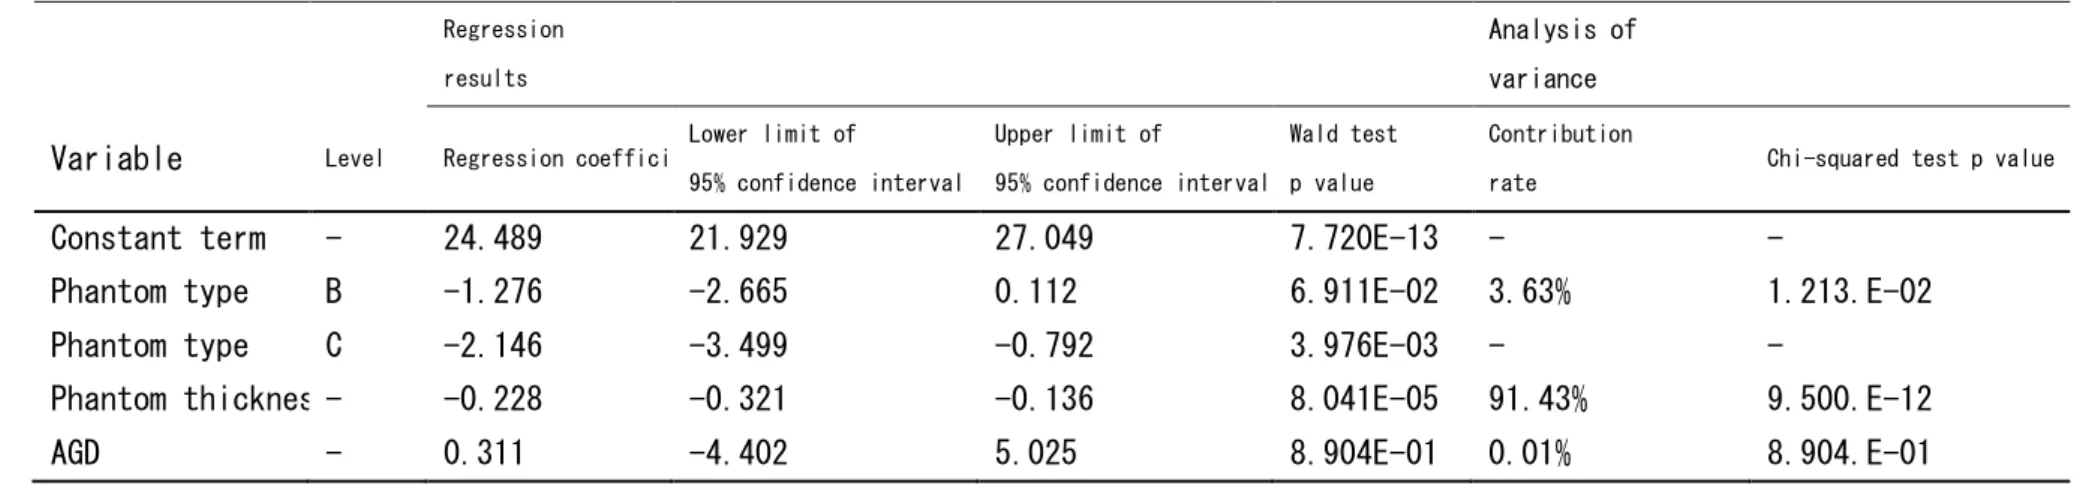
Table 6 shows that there was a significant correlation between the mammary gland ratio and phantom thickness and CNR (Regression coefficient 24.449, p value = 7.720E-13). The regression value was significantly lower for phantom C (Regression coefficient = -2.146, p value = 3.976E-03). The results suggest that the regression value significantly decreases as the phantom thickness increases (Regression coefficient = -0.228, p value = 8.041E-05). The phantom thickness contribution rate was 91.43%, which suggests that it can explain 91.43% of the CNR.
Table 7 shows that there was a significant correlation between the mammary gland ratio and phantom thickness and CNR (Regression coefficient = 24.629, p value = 1.038E-17). The results show that the regression value was significantly lower for phantoms B (Regression coefficient = -1.3, p value = 4.946E-02) and C (Regression coefficient = -2.157, p value = 2.684E-03). A decrease in the CNR value
9 with an increase in phantom thickness was observed.
Table 8 shows that there was a significant correlation between the mammary gland ratio and AGD and CNR (Regression coefficient = 28.668, p value = 3.647E-13). The results suggest that the CNR value was significantly lower for phantom C (Regression coefficient = -2.559, p value = 2.178E-02). A significant decrease in the CNR value was observed along with the increase in AGD value. A comparison of the results with the Akaike's Information Criterion value, which expresses the goodness of fit of the model, showed that using phantom thickness as the explanatory variable produces a better model than using the AGD as the explanatory variable.
6. Discussion
In this study, we investigated the CNR and AGD of mammography using breast-equivalent phantoms with different tissue ratios and thicknesses. Our results showed that higher CNR values were obtained with breast-equivalent phantoms having lower mammary gland tissue ratios and lesser thickness. The CNR values showed a strong negative correlation with AGD values. These results corroborate previous reports of reduced
cancer diagnosis sensitivity and poor MMG image quality in high-density mammary glands [13,16,17]. CNR is generally considered to be an index of image quality in various diagnostic imaging devices [28]. Image quality should also undergo manual evaluation, as image processing and image displays can significantly affect image quality in digital imaging equipment. Breast thickness is an important factor affecting image quality [16,17]. The average breast thickness has been reported to vary from 37.7 mm in Japanese women [29] to 45 mm in American women, 52 mm in British women, and 56 mm in German women [30]. Most FFDM use an automatic imaging mode that automatically selects targets/additional filters based on breast thickness to optimize exposure [31]. Therefore, the effect of breast thickness on CNR is often missed. Our results can be extrapolated to such clinical situations, where the effect of breast thickness on CNR can be estimated using AGD as an explanatory variable. Our results suggest that CNR prediction based on the tissue ratio could be used as a yardstick to evaluate the diagnostic reliability of MMG in breast cancer. CNR could be used as a post-processing index to objectively control for the effect of the mammary gland ratio and thickness on image quality and improve the reliability of diagnosis that is otherwise subjective and dependent on the mammography readers.
Our study findings closely relate to previous studies that show the effect of breast density on mammographic sensitivity [13,16,17]. These studies show that sensitivity of mammographic detection declines with increasing breast density and that adjunct screening methods like ultrasonography could be used to increase detection sensitivity. Another study that evaluated the effect of breast thickness on AGD and CNR reported results complementary to our findings [25]. They showed that with increasing breast thickness, AGD values increase and CNR values decrease. Our study extends these results and establishes a predictive formula for CNR based on AGD, which has high accuracy and precision (R2 of 0.865 and RMSE of 1.893). Our results show that both mammary gland ratio and AGD are significant predictors of CNR, with AGD having a greater effect on CNR. Interestingly, our results also show that variation of CNR within the three breast tissue models is low at low phantom thickness (10-30 mm;
10
coefficient of variation: 3.4-8.7%) and increases with increased phantom thickness (50~70 mm; coefficient of variation: 10.5-16.8%). This suggests that breast thickness might be a strong predictor of CNR, independent of the tissue density.
Finally, multiple logistic regression analysis results showed that mammary gland ratio and phantom thickness were significantly correlated with CNR. To ensure that each variable was incorporated in the analysis model independently and to avoid inferior results from incorporating related variables into the analysis model at the same time, we conducted the regression analysis using two additional models, where the first model incorporated phantom thickness and the second model incorporated the AGD.
This study has several limitations. First, there is the inherent limitation of a basic research study using phantoms. Phantoms have uniform tissue ratios and do not possess the heterogeneity of mammary gland density distribution encountered in the human breast [21]. The results of this study will require clinical validation in human subjects. Second, MMG was performed using a single FFDM device; therefore, it may not be possible to directly apply or extrapolate the results to other MMG devices. Third, we used a high-contrast aluminum plate for CNR measurement and investigated only the spatial resolution aspect, but not the density resolution aspect, of contrast resolution. CNR evaluates the signal difference between the two surfaces and the noise ratio of the obtained image. Therefore, CNR is not considered to provide sharpness information. It is also essential to investigate image features like density resolution and visibility. Since ultrasound examination is known to improve diagnostic reliability in dense breasts, future studies should investigate the role of the CNR in
approaches combining ultrasound examinations and MMG for breast cancer screening [32].
CNR is one of the image assessments under mammography. The CNR value cannot be obtained without using phantom. On the other hand, AGD appears on the mammography monitor under FFDM. This value can be easily obtained. Thus, applying the computation expression obtained under this research will enable us to easily obtain the CNR from the AGD value in real time immediately after mammography. Originally, the MMG observer used to make subjective evaluations based on the image contrast and noise. However, having the CNR value will enable more objective observations of images and this is anticipated to improve the diagnostic performance of cancer.
7. Conclusions
In this investigation we demonstrated that CNR varies inversely with mammary gland to fat tissue ratio and breast tissue thickness, which explains the clinical observation of poor MMG image quality in dense breasts. We also demonstrated a significant correlation between the CNR and AGD based on the tissue ratio and developed a predictive formula for CNR using AGD and mammary gland density. CNR prediction based on the tissue ratio could be used as a yardstick to measure the diagnostic reliability of MMG in breast cancer, objectively control for the effect of mammary gland ratio on image quality and improve the reliability of diagnosis that is otherwise subjective.
8. Acknowledgments
Editorial support in the form of medical writing was provided by Editage. We received guidance from Dr. Itsuko Okuda, a faculty professor at our institution (Graduate School of Health Science, Suzuka
12 University of Medical Science).
9. References
1 Falun Meeting, Falun, Sweden OC. Breast‐cancer screening with mammography in women aged 40–49 years. International Journal of Cancer. 1996 Dec 11;68(6):693-9.
2 G. Sakamoto, H. Inaji, F. Akiyama, S. Haga, M. Hiraoka, K. Inai, T. Iwase, S. Kobayashi, G. Sakamoto, M. Sano, T. Sato, “General rules for clinical and pathological recording of breast cancer 2005,” Breast cancer (Tokyo, Japan), vol. 12, no. S1, 2005.
3 J.N. Wolfe, A.F. Saftlas, M. Salane, “Mammographic parenchymal patterns and quantitative evaluation of mammographic densities: a case control study,” American Journal of Roentgenology, vol. 148, no. 6, pp. 1087–1092, 1987.
4 M.S. Rice, K.A. Bertrand, T.J. VanderWeele, B.A. Rosner, X. Liao, H.O. Adami, R.M. Tamimi, “Mammographic density and breast cancer risk: a mediation analysis,” Breast Cancer Research, vol. 18, no. 1, pp. 94, 2016.
5 P. Mehnati, H. Alizadeh, H. Hoda, “Relation between mammographic parenchymal patterns and breast cancer risk: considering BMI, compressed breast thickness and age of women in Tabriz, Iran,” Asian Pacific Journal of Cancer Prevention, vol. 17, no. 4, pp. 2259–63, 2016.
6 V.L. Green, “Mammographic breast density and breast cancer risk: implications of the breast density legislation for health care practitioners,” Clinical Obstetrics and Gynecology, vol. 59, no. 2, pp. 419–438, 2016.
7 V.A. McCormack, I. dos Santos Silva, “Breast density and parenchymal patterns as markers of breast cancer risk: a meta‒analysis,” Cancer Epidemiology and Prevention Biomarkers, vol. 15, no. 6, pp. 1159‒69, 2006.
8 N.F. Boyd, H. Guo, L.J. Martin, L. Sun, J. Stone, E. Fishell, R.A. Jong, G. Hislop, A. Chiarelli, S. Minkin, M.J. Yaffe, “Mammographic density and the risk and detection of breast cancer,” New England Journal of Medicine, vol. 356, no. 3, pp. 227‒236, 2007.
9 L. Yaghjyan, G.A. Colditz, L.C. Collins, S.J. Schnitt, B. Rosner, C. Vachon, R.M. Tamimi, “Mammographic breast density and subsequent risk of breast cancer in postmenopausal women according to tumor characteristics,” Journal of the National Cancer Institute, vol. 103, no. 15, pp. 1179–1189, 2011.
10 Y. Nagao, Y. Kawaguchi, Y. Sugiyama, S. Saji, Y. Kashiki, “Relationship between mammographic density and the risk of breast cancer in Japanese women: a case‒control study,” Breast Cancer, vol. 10, no. 3, pp. 228‒33, 2003.
11 C. Nagata, T. Matsubara, H. Fujita, Y. Nagao, C. Shibuya, Y. Kashiki, H. Shimizu, “Mammographic density and the risk of breast cancer in Japanese women,” Br J Cancer, vol. 92, no. 12, pp. 2102‒6, 2005.
12 Y. Kotsuma, Y. Tamaki, T. Nishimura, M. Tsubai, S. Ueda, K. Shimazu, “Quantitative assessment of mammographic density and breast cancer risk for Japanese women,” The Breast, vol. 17, no. 1, pp. 27‒35, 2008.
13
mammography, physical examination, and breast US and evaluation of factors that influence them: an analysis of 27,825 patient evaluations,” Radiology, vol. 225, no. 1, pp. 165–75, 2002.
14 C.J. D'Orsi, E.A. Sickles, E.B. Mendelson, E.A. Morris, editors, “ACR BI-RADS® Atlas, Breast Imaging Reporting and Data System,” American College of Radiology, 2013
15 R.S. Saunders, J.A. Baker, D.M. Delong, J.P. Johnson, E. Samei, “Does image quality matter? Impact of resolution and noise on mammographic task performance,” Medical physics, vol. 34, no. 10, pp. 3971-3981, 2007.
16 S. Destounis, L. Johnston, R. Highnam, A. Arieno, R. Morgan, A. Chan, “Using volumetric breast density to quantify the potential masking risk of mammographic density,” American Journal of Roentgenology, vol. 208, no. 1, pp. 222–227, 2017.
17 K. Kerlikowske and A.I. Phipps, “Breast density influences tumor subtypes and tumor aggressiveness,” Journal of the National Cancer Institute, vol. 103, no. 15, pp. 1143–1145, 2011. 18 J.M. Lewin, R.E. Hendrick, C.J. D'Orsi, P.K. Isaacs, L.J. Moss, A. Karellas, G.A. Sisney, C.C. Kuni, G.R. Cutter, “Comparison of full-field digital mammography with screen-film mammography for cancer
detection: results of 4,945 paired examinations,” Radiology, vol. 218, no. 3, pp. 873–880, 2001.
19 P. Baldelli, N. Phelan, G. Egan, “A novel method for contrast-to-noise ratio (CNR) evaluation of digital mammography detectors,” European radiology, vol. 19, no. 9, pp. 2275-85, 2009.
20 M. Oliveira, M.S. Nogueira, E. Guedes, M.C. Andrade, J.E. Peixoto, G.S. Joana, J.G. Castro, “Average glandular dose and phantom image quality in mammography,” Nuclear Instruments and Methods in Physics Research Section A: Accelerators, Spectrometers, Detectors and Associated Equipment, vol. 580, no. 1, pp. 574-577, 2007.
21 N. Kiarashi, A.C. Nolte, G.M. Sturgeon, W.P. Segars, S.V. Ghate, L.W. Nolte, E. Samei, J.Y. Lo, “Development of realistic physical breast phantoms matched to virtual breast phantoms based on human subject data,” Medical physics, vol. 42, no. 7, pp. 4116-26, 2015.
22 M.S. Ko, H.H. Kim, J.H. Cha, H.J. Shin, J.H. Kim, M.J. Kim, “Dose reduction in automatic optimization parameter of full field digital mammography: Breast phantom study,” Journal of breast cancer, vol. 16, no. 1, pp. 90-96, 2013.
23 N. Kiarashi, J.Y. Lo, Y. Lin, L.C. Ikejimba, S.V. Ghate, L.W. Nolte, J.T. Dobbins, W.P. Segars, E. Samei, “Development and application of a suite of 4-D virtual breast phantoms for optimization and evaluation of breast imaging systems,” IEEE transactions on medical imaging, vol. 33, no. 7, pp. 1401-1409, 2014.
24 F. Al Kaabi, N. Al Bariki, J. Janeczek, “Variation of the Breast Mean Glandular Doses According to Breast Thicknesses,” In World Congress on Medical Physics and Biomedical Engineering May 26-31, 2012, Beijing, China 2013 (pp. 1125-1127). Springer, Berlin, Heidelberg.
25 M.K. Karaaslan, Ö. Gündoğdu, N. Muzoğlu, M.A. Arıcı, “Variation of contrast-noise ratio (CNR) and mean glanduler dose according to breast thickness,” InBiomedical Engineering Meeting (BIYOMUT), 2016 20th National 2016 Nov 3 (pp. 1-4). IEEE.
26 Evaluation and routine testing in medical imaging departments Part 3-2: Acceptance tests - Imaging performance of mammographic X-ray equipment. International Electrotechnical Committee.
14 2007
27 K. Matsubara, C. Matsumoto, Y. Mochiya, K. Toda, K. Noto, K. Koshida, “Radiation dose evaluation in a photon-counting digital mammography unit,” Nihon Hoshasen Gijutsu Gakkai zasshi, vol. 70, no. 5, pp. 445-452, 2014.
28 M.J. Tapiovaara and R.F. Wagner, “SNR and noise measurements for medical imaging: I. A practical approach based on statistical decision theory,” Physics in Medicine & Biology, vol. 38, no. 1, pp. 71, 1993.
29 M. Matsumoto, K. Nishizawa, Y. Akiyama, K. Horita, H. Kato, A. Ishioka, “The Mean breast thickness for Japanese patients for use in estimating the glandular dose in mammography,” Journal of Japan Association of Breast Cancer Screening, vol. 9, pp. 95–102, 2000. In Japanese.
30 N. Jamal, K.H. Ng, D. McLean, “A study of mean glandular dose during diagnostic mammography in Malaysia and some of the factors affecting,” The British Journal of Radiology, vol. 76, no. 904, pp. 238–245, 2003.
31 N. Shramchenko, P. Blin, C. Mathey, R. Klausz, “Optimized exposure control in digital mammography,” In Medical Imaging 2004: Physics of Medical Imaging 2004 May 6 (Vol. 5368, pp. 445-457). International Society for Optics and Photonics.
32 N. Ohuchi, A. Suzuki, T. Sobue, M. Kawai, S. Yamamoto, Y.F. Zheng, Y.N. Shiono, H. Saito, S. Kuriyama, E. Tohno, T. Endo, “Sensitivity and specificity of mammography and adjunctive ultrasonography to screen for breast cancer in the Japan Strategic Anti-cancer Randomized Trial(J-START): a randomize controlled trial,” The Lancet, vol. 387, no. 10016, pp. 341–348, 2016.
14 Tables
Table 1: CNR values based on mammary gland density and imaging conditions Fibroglandular adipose mass (%) Thickness of phantom (mm) Target filter Tube voltage (kV) mAs (mAs) AGD (mGy) CNR Phantom A (30/70) 10 Mo/Mo 26 16.7 0.48 23.1 20 26 27.9 0.75 20.1 30 Mo/Rh 27 41.7 1.01 16.2 40 28 57.1 1.27 15.1 50 Rh/Rh 29 60.8 1.33 13.0 60 29 74.9 1.58 11.7 70 30 90.2 1.95 10.9 Phantom B (50/50) 10 Mo/Mo 26 18 0.53 21.8 20 26 34 0.85 20.8 30 Mo/Rh 27 47.2 1.07 16.0 40 Rh/Rh 29 50.1 1.2 13.7 50 30 52.4 1.23 11.4 60 31 59.7 1.49 9.6 70 30 75 1.47 8.4 Phantom C (70/30) 10 Mo/Mo 26 19.1 0.54 21.8 20 26 37.8 0.87 19.1 30 Mo/Rh 27 44 0.9 13.8 40 Rh/Rh 29 59.7 1.23 12.6 50 30 69 1.55 10.6 60 30 64 1.29 9.0 70 30 95.3 1.73 8.1
15
Table 2: Results of the multivariate analysis for effect of mammary gland density and AGD on CNR
Variables Parameter df Sum of squares F value p
Mammary gland tissue ratio 2 2 26.3 3.66 0.0476
AGD 1 1 376.6 105.06 < 0.0001
16
Table 3: Mean CNR for each mammary gland tissue ratio adjusted by the AGD as a covariate.
Breast phantom model (Fibroglsndular /adipose ratio) CNR Unadjusted difference [95%CI] p CNR Adjusted for AGD difference [95%CI] p A (30/70) 15.73 -1.3 [-6.84, 4.24] 0.6274 16.14 -0.92 [-2.23, 0.39] 0.1459 B (50/50) 14.43 15.22 C (70/30) 13.57 -2.17 [-7.7, 3.37] 0.4217 16.14 -2.66 [-4.03, -1.29] 0.0017 13.48 A (30/70) 15.73 B (50/50) 14.43 -0.87 [-6.4, 4.67] 0.7465 15.22 -1.74 [-2.5, -0.98] 0.0006 C (70/30) 13.57 13.48
17
Table 4: Pairwise differences in the CNR between phantoms with different mammary gland ratios
CNR difference [95%CI] p
A (30/70) vs. B (50/50) -2.12 [-4.26, 0.02] 0.0521
A (30/70) vs. C (70/30) -2.57 [-4.71, -0.43] 0.0213
B (50/50) vs. C (70/30) -0.45 [-2.59, 1.69] 0.6637
18
Table 5: Predictive formulae for CNR according to breast density
Breast phantom model (Fibroglandular
/adipose ratio)
Correlation with CNR
CNR predictive formula R2 RMSE
r p A (30/70) -0.9631 CNR = -8.69 AGD+26.12 0.928 1.323 B (50/50) -0.9724 CNR = -14.62 AGD+30.80 0.946 1.314 C (70/30) -0.9126 CNR = -11.29 AGD+26.64 0.833 2.301 Model: p < 0.0001, R2 = 0.865, RMSE = 1.893. CNR: contrast to noise ratio, RMSE: root mean square error
19
Table 6: Results of multivariate linear regression analysis using CNR as the objective variable, and mammary gland ratio, AGD, and phantom thickness as the explanatory variables
Regression results
Analysis of variance
Variable Level Regression coefficient Lower limit of 95% confidence interval Upper limit of 95% confidence interval Wald test p value Contribution
rate Chi-squared test p value
Constant term - 24.489 21.929 27.049 7.720E-13 - -
Phantom type B -1.276 -2.665 0.112 6.911E-02 3.63% 1.213.E-02
Phantom type C -2.146 -3.499 -0.792 3.976E-03 - -
Phantom thickness - -0.228 -0.321 -0.136 8.041E-05 91.43% 9.500.E-12
AGD - 0.311 -4.402 5.025 8.904E-01 0.01% 8.904.E-01
20
Table 7: Results of multivariate linear regression analysis using CNR as the objective variable and phantom type and phantom thickness as the explanatory variables
Regression results
Analysis of variance Variable Level Regression
coefficient Lower limit of 95% confidence interval Upper limit of 95% confidence interval Wald test p value Contribution rate Chi-squared test p value
Constant term - 24.629 23.228 26.029 1.038.E-17 - -
Phantom type B -1.3 -2.597 -0.003 4.946.E-02 3.63% 9.247.E-03
Phantom type C -2.157 -3.454 -0.861 2.684.E-03 - -
Phantom thickness - -0.223 -0.249 -0.196 2.108.E-12 91.43% 2.108.E-12
21
Table 8: Results of multivariate linear regression analysis using CNR as the objective variable and phantom type and AGD as the explanatory variables
Regression results
Analysis of variance Variable Level Regression
coefficient Lower limit of 95% confidence interval Upper limit of 95% confidence interval Wald test p value Contribution rate Chi-squared test p value
Constant term - 28.668 25.607 31.729 3.647.E-13 - -
Phantom type B -2.119 -4.262 0.024 5.230.E-02 3.63% 1.305.E-01
Phantom type C -2.559 -4.697 -0.421 2.178.E-02 - -
AGD - -10.822 -13.048 -8.595 1.070.E-08 82.96% 1.070.E-08
22 Figure legends
Fig. 1 Experimental set up of the phantom for the CNR measurement based on the International Electrotechnical Committee guidelines (a) without, and (b) with the aluminum plate placed at the center of the horizontal axis of the breast support. CNR: contrast to noise ratio, PMMA: polymethyl methacrylate
Fig. 2 Schematic showing the region of interest (ROI) in the breast-equivalent phantom (a) without and (b) with the aluminum plate. Pixel values were calculated using ImageJ in the ROI without (BG-ROI), and with (Al-ROI) the aluminum plate
Fig. 3 Contrast to noise ratio (CNR) measurement results in breast phantoms with three different tissue ratios plotted against phantom thickness. The CNR was highest in phantom model A (30/70) at all thicknesses. The CNR decreased as the mammary gland density increased, and the thickness of the breast model increased. Mo: molybdenum, Rh: rhodium
Fig. 4 Correlation between the AGD and CNR (a) across all three mammary gland ratios, and in (b) model A (30/70), (c) model B (50/50), and (d) model C (70/30). AGD: average glandular dose, CNR: contrast to noise ratio
Fig. 5 Correlation between the CNR predicted value measured at different tissue ratios in (a) model A (30/70), (b) model B (50/50), and (c) model C (70/30). CNR: contrast to noise ratio
23 Figure 1
24 Figure 2
25 Figure 3
26 Figure 4
27 Figure 5
28 【研究業績リスト】
論 文
Noriko N; Yuka O; Saori A; Kana T; Takashi N; Sohichirou U. Effect of different breast densities and average glandular dose on contrast to noise ratios in full-field digital mammography: Simulation and phantom study. Radiology Research and Practice. 2018,
Noriko N; Yuka O; Saori A; Kyoko Ichiura; Interpolation of Dance’s coefficients ( g and c Conversion Factors) for the estimation of average glandular dose in mammography. Jouenal of Rural Medicine. 2019,
学会発表 中村哲子:乳房用 X 線装置における乳腺密度別の平均乳腺線量の検討.第 74 回日本放 射線技術学会学術大会,横浜,2018.4. 中村哲子:乳房用 X 線装置における乳腺密度別の平均乳腺線量の検討.第 45 回日本放 射線技術学会秋季大会,広島,2017.10. 中村哲子:CR 乳房用X線装置における乳腺濃度と平均乳腺線量の関係. 第 31 回日本 診療放射線技師学術大会, 京都, 2015.11. 中村哲子:乳房撮影装置における圧迫器の圧迫圧の検討. 第 30 回日本診療放射線技 師学術大会, 別府, 2014.9. 中村哲子:当院乳がん検診と早期発見との関係について. 第 29 回日本診療放射線技 師学術大会, 島根, 2013.9. 中村哲子:当院における住民乳がん検診成績. 第 28 回日本診療放射線技師学術大会, 名古屋, 2012.9. 中村哲子:マンモグラフィ上の微細石灰化像の範囲と乳がん進展範囲との対比. 第 28 回日本診療放射線技師学術大会, 名古屋, 2012.9. 中村哲子:当院における MMG 住民乳癌検診成績. 第 21 回日本乳癌検診学会, 岡山, 2011.9.