著者
Mlodkowski Pawel, Stalinska Anna, Tastulekova
Aigul
journal or
publication title
Comparative culture, the journal of Miyazaki
International College
volume
24
page range
89-81
year
2019
59
International Capital Flows and Stock Market
Performance: The Case of Oman and Kazakhstan
Pawel Mlodkowski
School of International Liberal Arts, Miyazaki International College, Miyazaki, Japan
Anna Stalinska
Modern College of Business and Science, Muscat, Sultanate of Oman
Aigul Tastulekova
FORBES Kazakhstan, Almaty, Kazakhstan
.
Abstract:
The paper focuses on the performance of local stock markets in two oil-producing countries with different economic history and diverse political background. We try to associate stock exchange developments in the most recent period with international capital flows. Kazakhstan pretends to be the economic and financial hub of Central Asia. Oman is an economic hub of the Arab Peninsula, with a significant role in global supply chains. With unquestionable economic potential in both cases, and with tailored economic policies along with political stability one can argue that both countries are on their way to local domination. The last global crisis, originating from the US sub-prime loan problems has taken a great toll in Kazakhstan, resulting in the deterioration of stock market performance. However, it was not the case for Oman. We ask a question: to what extent is the observed stock market behavior a result of international capital flows, and to what extent is it driven by local factors? The answer is based on a systematic and rigorous regression analysis between proxies for external factors and stock market performance. We use the official stock exchange databases and Balance of Payments Statistics provided by the IMF for information about foreign capital flows to and from the countries of interest. Results allow for a set of conclusions that may serve both domestic policy-makers and international investors interested in taking long positions in two respective stock
60
markets. In both cases we observe small open economies, with a financial sector highly sensitive to international capital flows in case of Kazakhstan, and a much less sensitive one in case of Oman.
Keywords: portfolio investment, developing countries, Kazakhstan, Oman, stock market. JEL Code: F33, G14, G28.
.
Introduction
There are a multitude of empirical studies on emerging economies that focus on external financing issues. The reason is in a well-known fact related to lack, or shortage, of domestic savings in such countries. The importance of foreign capital for domestic production function can be traced back already in the classical model. However, there are also problems with external financing of developing countries, as pointed out explicitly by Stiglitz (2002) in his prominent critique of globalization. Liberalization of the balance-of-payments accounts creates many potential risks for emerging economies. These risks materialize when external or internal factors undermine confidence in the underlying developing economy and result in sudden stops and reversals of capital flows. We would like to tell a story of the unique cases of the Republic of Kazakhstan and the Sultanate of Oman and their domestic stock market performance with comments on the specific role of capital flows over almost the last 10 years.
Goetzman and Jorion (1997) propose socio-economic reasons driving investments in stock markets in the 20th century. They suggest that the demographic factor of being a “baby-boomer”, concerned about the future post-retirement income (and consumption), may fuel a specific pattern of behavior. This is simply: (1) saving more of the current income, and (2) investing it in financial assets with an absolute and relative higher rate of return. As a consequence, the appreciation of financial assets results not from the ability to generate cash flows by the underlying real assets, but from continuous inflow of capital, fueling prices. We support their claim and we extend it beyond the year 2000. As most developed countries suffer from public pension system deficits, with growing potential for their bankruptcy in the future, rational agents seek to diversify post-retirement income sources and hedge against the risk of default. This in turn means that private voluntary savings increase. With the available technology along with liberalized financial accounts in most countries, the capital flows “there
61
and back again” seeking the maximum rate of return in the global scale, visiting emerging economies. Therefore, we claim that the observed performance of stock exchanges in developing countries is highly sensitive to international capital flows. International investors have potential for fueling financial asset appreciation and even for destabilizing foreign stock markets, when discouraged or frightened.
According to Henry and Kannan (2006), there are two main reasons driving investors’ decisions about taking long positions in financial assets issued in developing countries. The first one is derived directly from the portfolio theory: stock market returns in emerging economies have a low correlation with returns in industrialized world. Diversification opportunities create a potential for higher profits at a reduced level of risk. The other argument coming from “conventional wisdom” states that investments in developing countries offer greater opportunities due to absolute higher growth rates. As formulated by Malkiel and Mei (1998) or Mobius (1994), due to higher expected economic growth rates in emerging economies, the long-run expected rates of return on investments are also above of the level projected for developed countries. The empirical analysis, however, undermines this proposition (Henry and Kannan, 2006, Fig 8.1, p. 241). Not only is the sign of the relationship between the average GDP growth rates and stock market returns insignificant, but it also turns negative. The Republic of Kazakhstan, despite not being covered by the mentioned study, is not an exception. Despite the fact that it has been growing relatively and absolutely faster than most other economies in the world in the post-2008 period, the stock market performance did not mirror it, as could be expected.
Asian economies have represented a puzzle for economists due to their ability to maintain higher growth rates in the long run. Krugman (1994) explains this phenomenon for Asian Tigers, offering an argument that there has been rapid capital accumulation made possible by the thriftiness of their populations. This argument counters suggestions about growth fueled by the changes in the Total-Factor-Productivity. Such an interpretation may be valid for East– and South-East Asian countries, but again fails when used in explaining the performance of the Republic of Kazakhstan. In this particular case, there may have been many more factors in play that are responsible for the observed macroeconomic results. The Soviet-Union heritage has made it relatively easy to achieve high absolute rates of GDP growth in the mid-run. An abundance of natural resources, on the other hand, has been a very good insurance
62
against sudden stops and international liquidity problems that have been detrimental for economic growth and development in most African countries for decades (Mlodkowski, 2007).
One may argue that, in case of emerging economies, the fast accumulation of capital has lead to a systematic decrease of its productivity. This may have been true for middle-income countries, with no prior experience with communism. However, for post-Soviet Union cases, there has been much of the hidden growth and productivity potential that have been released over the most recent period. A brief economic history of the Republic of Kazakhstan, offered below, has been intended to give hints about the situation and its consequences for the results we obtain in the empirical study.
Modern Economic History of Kazakhstan
The declaration of independence of the Republic of Kazakhstan in 1991 marked the beginning of a new period of development of this Central Asian country. It started to reform and to develop towards a market economy. By this time, the administrative and central planning system in the Soviet Union has already been completely discredited. In fact, this system brought all Soviet Union republics to the point of economic implosion. Perestroika, launched in 1987 by Mikhail Gorbachev, was a reorganization of social and economic relationships. This reform was intended to bring economic liberalization and democratization of social processes. However, it could not prevent the fall of industrial and agricultural production (Ayaganov, et al., 2010, p. 118). In addition, the negative impact on the economy of Kazakhstan caused a substantial difference in the distribution and level of development of productive forces. The major industrial and high-tech final stage production had been located in the western part of the USSR. The rest of the Soviet Union, including Kazakhstan, played the role of raw material appendages (Ayaganov, et al., 2010, p. 119).
After the collapse of the Soviet Union, the new independent states have realized all the negative effects of raw material-oriented economy. We can say that at that time all large-scale mining companies in Kazakhstan found themselves without demand for their output. The existing production facilities were obsolete and therefore, unable to process raw materials up to the standards suitable for marketing in international markets. The industries of the former Soviet Union, previously the major consignee, were in decline, and demanded no raw materials
63
extracted in Kazakhstan (Masanova 1999). In turn, a collapse of industrial giants in Kazakhstan caused a "domino effect" domestically (Masanova 1999). One after another, the decline spilled over to the services sector, retail, health care, etc. (UNDP, 1995, p. 68).
The decline in industrial production, and the resulting shortage of consumer goods, led to unprecedented inflation due to unrealized accumulated purchasing power and the fact that the central government budget deficit was financed directly by a central bank. The peak of this inflation was when Russia introduced its new currency in early 1993. Kazakhstan remained in the ruble zone until November 1993, so the domestic production and financial system of Kazakhstan were highly dependent on the monetary policy of Russia. As a result of the introduction of the new Russian currency, both countries signed an agreement on the parallel circulation of the two types of new Russian rubles banknotes and the old Soviet rubles. However, the agreement has not been fulfilled.The new Russian Ruble did not come to Kazakhstan. Instead, the huge mass of old Soviet rubles flooded into Kazakhstan bringing a wave of hyperinflation (Ayaganov, et al., 2010, p. 221). Due to the hyperinflation, the demand for capital in this initial period of independence was low. The society lost trust in the legal tender and most of the transactions were based on bartering.
An important step in the process of economic reforms was the creation of the country's financial system. On the eve of the declaration of independence, a financial system based on market mechanisms did not exist in Kazakhstan. Before 1991, the Republican Bank, despite its name and status, was actually only a branch of the Soviet Union Bank. The Board and the central administration were located in Moscow. The rules of a centrally planned economy were in place and a monetary policy along with the basic strategy for the banking system were formulated without Kazakh contribution. Operations were reduced to following instructions received from Moscow (Ayaganov, et al., 2010, p 219). At time of Soviet Union, there was no need for a domestic, independent financial and credit policy. It was already in early 1991, when the “Law On Banks and Banking Activity in the Kazakh SSR." was passed. Under this Act, the Republican State Bank was transformed into the National Bank of the Republic of Kazakhstan. In addition, the Union Industrial Bank branch offices were changed into Republican banks as: Promstroibank, Zhilsotsbank, Agroprombank, Vneshtorgbank (National Bank of Kazakhstan, 2001, p. 8). The banking sector was fragmented. Commercial banks were highly concentrated and subject to substantial credit risk. They served, very often,
64
specific regions, particular industries, or even individual large enterprises only, which duplicates to some extent the pattern observed in South Korea (chaebol) and Japan (keiretsu). Such organizational solutions allow for increased efficiency, and facilitate supply of capital along with economic and financial stability of large industrial conglomerates.
The initial period of independence observed a dynamic growth of the private banking sector. The number of registered banks exceeded 200 in the early 1990s (Ayaganov, et al., 2010, p 221). Most of these banks were under-capitalized and therefore unable to satisfy demand for capital. There was another reason for their fast expansion. These small financial intermediaries were very convenient for serving various illegal operations, including the theft of state funds and money laundering. Top managers of large enterprises used their influence on small banks for managing the resources of the company at their own discretion (Ayaganov, et al., 2010, p 22). As can be seen, the initial period was full of poor allocation of savings and misuse of financial intermediaries along with malfunctions of the majority of the commercial bank sector in Kazakhstan. Banks did not perform their role of transforming the nominal, the term and the risk, in the process of providing financing for viable investment projects. Banking supervision was weak, but developing.
The National Bank of Kazakhstan has played the role of a first-level bank from the very beginning of its operations. It has been responsible for the regulation and supervision of domestic banks. When the national currency was introduced in 1993, the domestic banking system was developed well enough to cope with the responsibilities entrusted to it (Rayeva 2001).
The National Bank of Kazakhstan has also experienced changes in its status, regarding its independence, as have most central banks at the end of the 20th century. This was pronounced in 1995, by the Decree of the President of the Republic of Kazakhstan, Nursultan Nazarbayev. Under his decree, the National Bank of the RK has been no longer subordinated to the Cabinet of Ministers. The National Bank of Kazakhstan has become completely independent and accountable only to the President of the RK. In 1993, another reform was conducted. Kazakhstan adopted a program of reforming the banking system. This program removed the obligation of the National Bank of the RK to lend to commercial banks. The commercial banks had to conduct their lending operations on the basis of deposits they
65
welcomed from the general public. This was a major step towards mobilizing and promoting domestic savings for the financing needs of the national economy. The final step in creating a modern banking sector in Kazakhstan may be tracked back to 1996. It was the decisionto implement International Financial Reporting Standards for their accounting and reporting (National Bank of Kazakhstan, 2001, p. 173). The legal and institutional framework in Kazakhstan has been attractive for foreign banks. Many of them have opened subsidiaries and affiliates to serve the industry and the general public.
The country's transition into a market economy, however, required creation of capital markets with efficient legal and institutional frameworks along with modern technical infrastructure. The main factor for the formation of a stock market in Kazakhstan was mass privatization (Shynybekov D., 2006, p 38) and commercialization of state-owned enterprises. On the 23rd of December 1995, the Law of the Republic of Kazakhstan "On denationalization and privatization" was introduced (Official Journal of the Parliament of the RK, 1995, No. 24, Position 163). This event marked the beginning of the transformation of state property into private property. A massive privatization began. This process is always associated with a substantial increase in demand for capital, and Kazakhstan was not an exception. Due to domestic savings scarcity and low credibility among international investors, the government facilitated the initial stage of privatization. Special privatization funds were created to implement the privatization program. Privatization coupons were distributed through these funds to citizens of Kazakhstan. As the result of this nation-wide general privatization, the society became a shareholder of the newly established joint stock companies (Ayaganov, et al., 2010, p. 208). It was already at that period when the first inflow of foreign capital happened. However, there was no institutional framework for facilitating the transfer of ownership. A national stock exchange was established much later.
The development of Kazakhstan after 1991 is characterized by large-scale and fundamental changes of socio-economic system. Achievements cover, among others, a legal framework, privatized economy, and a vibrant and expanding private sector. Despite these achievements, there are still problems with the stability of the financial sector, especially when one considers the stability and liquidity of the banking system. Due to well-balanced policies and direct government support, Kazakhstan has survived a series of crises and has been able to recover relatively quickly from the 2008-financial crisis.
66
Modern Economic History of Oman in Brief
It was only in 1967 that oil was exported from Oman for the first time. Before that day, Oman was a local player, famous for shipbuilding, fisheries, and pirating (with headquarters on Zanzibar), as the main economic activities. However, the systematic development of oil production and the resulting growth in the national wealth transformed Oman from a very poor country to another fairy tale land of 1001 nights.
In the 1970s there was a Palace Revolution facilitated byGreat Britain, in which a new leader – Sultan Qaboos, took over the responsibility for Oman. The new Sultan modernized the whole country. Historians evaluate positively all the reforms, calling this initial period “the
Omani Renaissance” (Kaplan 2011). In 1971 Oman joined the Arab league. In the same year
the Sultanate also became a member of the United Nations.
From the beginning of this new era in the history of the Sultanate of Oman, its oil revenue has been consistently invested in improving standards of living. Most of the centrally decided spending has been focused on domestic infrastructure. However, hydrocarbons are not the only wealth-generating factor. This country is also poised to take advantage of its strategic trade location on the Indian Ocean and the Persian Gulf. The role in the global supply chains is undeniable.
Due to political factors, Oman did not become a member of OPEC. It is also outside the local association of oil producers. This creates a special setting in which Oman is relatively neutral in the Persian Gulf region, obtaining all benefits, but suffering no penalties for its neutrality. Concerning the regional integration initiatives, Oman was one of six founding members of the Gulf Cooperation Council that was established already in 1981. However, only the most recent period witnessed intensified attempts to promote economic, political, and security cooperation among its members. Historically, the Sultanate of Oman has always been closely associated with Great Britain, remaining under its protectorate, and the United States also has very good relations with this Arab country.
It was in the year 2000 that Oman became a member of the World Trade Organization, and started to liberalize its domestic markets, including the stock exchange – the Muscat Securities Market. The domestic market for financial instruments was established in the late
67
1980s. The legal basis was the Royal Decree (53/88), issued on 21 June 1988 to regulate and control the Omani securities market. The economic situation and the nature of the domestic economy back then did not demand capital for business projects to be supplied via a stock market. Therefore, the development of the stock market was slow until financial liberalization at the eve of the new millennium. After ten years of continuous, but slow, growth there was a need for a better functioning of the Market.
The stock exchange in Muscat is a governmental entity, financially and administratively independent from the regulatory body, but it is at the same time subject to its direct supervision. There is no doubt that the manner of organizing the institutional framework allows it to enhance investors' confidence. The MSM has developed its regulations to provide information and financial data relating to the performance of the market itself and of all listed companies. This is achieved by a modern electronic trading system, in line with global standards. Such a technical setup is easy to understand for all foreign investors. It ensures transparency of transactions and activities. This is considered to be one of the main requirements for a modern capital market. Without doubt, it allows investors to make the right investment decision at the right moment. The existing modern mechanism of clearance and settlement encourages the flow of foreign investment to the domestic economy that is being e studied here.
It was only in 1992 that the stock market index was established. Its name is MSM30. This main measure of the performance of the Muscat Stock Market will be used in our empirical investigation. Since July 1, 2009 MSM30 is being calculated on a free-float market capitalization methodology. A 10% capping (CAP) is set to ensure wider representation of smaller companies in the index. The main objective of MSM 30 is to reflect, objectively and fairly, the prices movement of the listed shares in the Market.
The Model
We start with two simple linear regression models for describing stock market performance (SMP) in the Sultanate of Oman (Model 1) and the Republic of Kazakhstan (Model 2) as the endogenous variable. Net international capital flows (ICF) are the exogenous, explanatory variable. There are a variety of options to capture the national stock market performance in the literature (Edwards, Garcia 2008). The most commonly used seems to be restricted to the main stock market index (MSM30 for Oman and KASE Index for Kazakhstan), capitalization
68
(denominated in the national currencies), and number of companies listed (a simple count), or total trade (denominated in the national currencies). These proxies are sometimes standardized by dividing nominal values by the GDP. However, in our empirical exercise, we start with only nominal variables. Equation 1 defines the general setup for our initial econometric analysis of the proposed relationship between the international capital flows, and the domestic market performance.
(1)
Where:
SMPt – stock market performance in period t, α – constant,
β – slope of the regression function,
ICFt – international capital flows in period t, εt – error term.
Starting with a simple graphical presentation of developments of the crucial variables for our regression analysis for both countries, it becomes possible to observe the first common movements in stock market performance and international flows of capital.
69
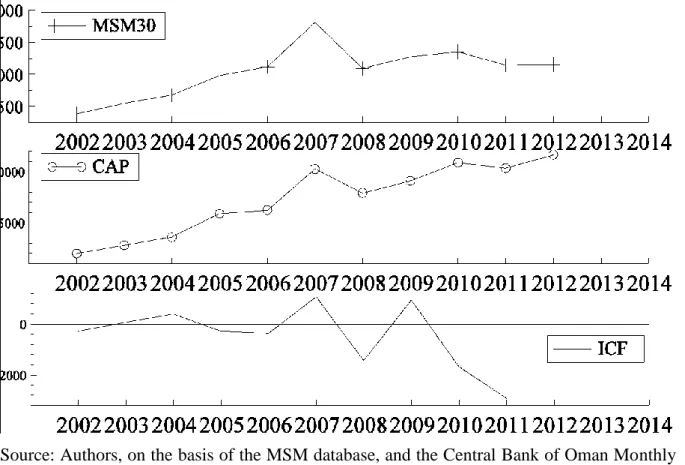
Source: Authors, on the basis of the MSM database, and the Central Bank of Oman Monthly Statistical Bulletin.
Figure 1. Stock market performance measures: MSM30, and market capitalization (CAP) 2002-2012, and Financial Account (ICF) balance 2002-2011 for Oman.
As can be deducted from the graphical presentation (Figure 1), there were only a few episodes when co-movements of variables in question occurred. This, in turn, suggests that in case of the Sultanate of Oman, the international capital flows may play a minor or negligible role in the developments in the domestic stock market. The situation is different, however, in the case of the Republic of Kazakhstan, as depicted in Figure 2. For this country, a different category is used as a proxy of international capital flows. Net Private Capital Flows, from the World Development Indicators database by the World Bank, are a much more meaningful variable that describes net flow of savings.
70
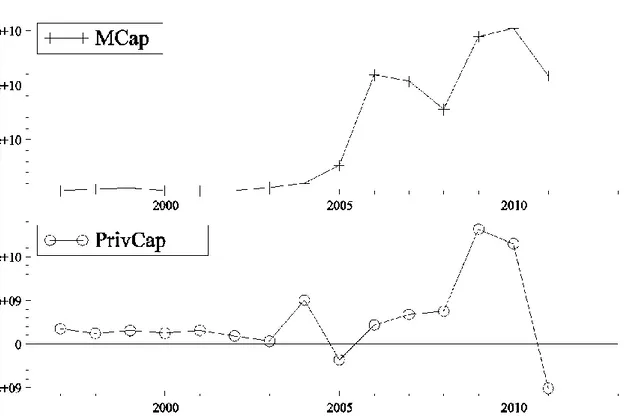
Source: Authors, on the basis of the KASE database, and the World Development Indicators database by the World Bank, Washington D.C. 2013.
Figure 2. Performance measures: KASE capitalization (MCap) 1997-2011, and private capital flows (PrivCap) 2000-2010 for Kazakhstan.
In Kazakhstan, the KASE performance, measured by the market capitalization, seems to mimic the private capital flows. Therefore, international investors may have a significant role in shaping the situation at the local stock market. A more detailed analysis, based on a simple linear regression exercise provides deeper understanding of the observed relationship.
Empirical Analysis Results and Discussion
In the first step, normalization of nominal variables was conducted. This transformation was justified by relatively high denominations of the nominal variables. Without scaling the original data, processing it was difficult and the precision of the estimation results was endangered. Normality test and descriptive statistics for all the variables are presented in the Appendix. Some of the original variables for both countries exhibited instability of their means and variances. This, in turn, required de-trending of the original time series, in order to use them in regression models. Results of the unit-root test (ADF test) for all the variables after de-trending are reported in table 1.
71
Table 1. Unit-root test results for detrended time series of international capital flows and stock performance for Oman and Kazakhstan.
Oman ADF test value Critical values
Stock market performance -3.2667** 1%=-2.968 Financial Account Balance -3.5782** 1%=-2.968
Kazakhstan ADF test value Critical values
Stock market performance -3.3385** 1%=-2.776 Private Capital Flows (net) -2.7188* 5%=-1.97 Source: Authors, using PCGive econometric software.
Correlation coefficients between the endogenous and exogenous variables were different, for Oman: 0.27114, and for Kazakhstan: 0.52784. This was the first indication of the fact that we are going to observe different behavior in these two cases. The following regression analysis cast proxies of international capital flows against performance of domestic stock markets. For the Sultanate of Oman a different set was chosen due to data availability, and a different time period was used for final estimating regression parameters (2004-2011) in comparison with the Republic of Kazakhstan (1999-2011).
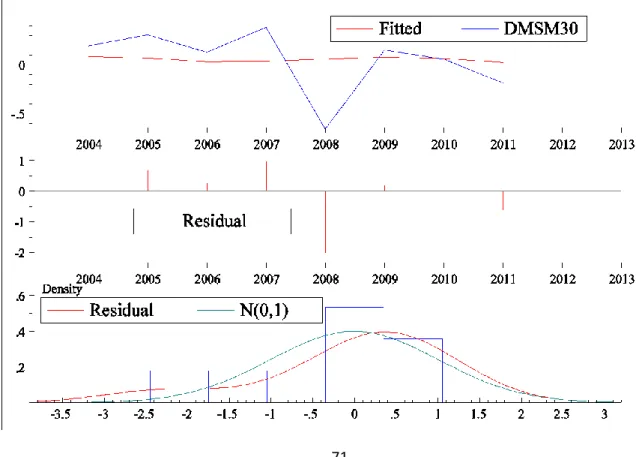
72 Source: Authors, using PCGive econometric software.
Figure 3. Graphical analysis of the regression model for Oman.
It was only in 2008 that a significant negative residual occurred. The model predicted no deterioration, on the basis of international capital flows. This kind of behavior indicates that the performance of the domestic stock market in Oman is driven mostly by local investors’ decisions, and not by international ones. This in turn allows for a conclusion that Oman has not been considered a safe marina for capital in turbulent times. No significant capital flows occurred prior to 2008 or after the outbreak of the global crisis, despite the deterioration of the domestic stock market. Investors were discouraged by the general investment climate, but closing positions has not resulted in net capital outflow. On the one hand, capital invested at the Muscat Stock Market is mostly of Omani origin. On the other hand, despite the liberalization of the BOP accounts, there are no international investors interested in financial instruments traded at the MSM. There may be no problem with domestic savings for real investment projects and therefore no problem of scarcity of capital necessary for further growth and development.
Table 2 presents results of the regression analysis of both stock markets response to international capital flows. Despite the fact that the general formulation of the relationship includes a constant (α), data mining revealed that in both cases fitness of the model is better, with imposed restriction α=0.
Table 2. Regression results for MSM and KASE. Country β t-Statistic R2 DW Oman 0.043212 1.058 0.12 2.37 Kazakhstan 0.27063 2.781 0.56 1.81 Source: Authors, using PCGive econometric software.
From the regression analysis of the postulated relationship between international capital flows and domestic market performance one can conclude that in case of the Sultanate of Oman, there is no statistically significant foreign driving factor. Not only was the estimated coefficient positive, but close to ZERO. Its t-Statistic indicates that this parameter is not statistically
73
significant. The model was able to explain only 12% of the total variability of the stock market index with the variability of the Financial Account balance of the BOP.
The case of Kazakhstan is very different from that of the Sultanate of Oman. The underlying economy is much bigger and the demographic potential is much larger. In the same time, it is only a short period for the actual market economy that allowed for accumulation of capital from domestic sources. Therefore, Kazakhstan is supposed to be more dependent on foreign savings not only due to higher demand for capital for heavy industries, but also because of a weaker domestic base for generating savings. As can be seen in the graphical analysis of the regression run for this Central Asian country, the model is quite efficient in describing the KASE performance using the private capital flows to and from Kazakhstan.
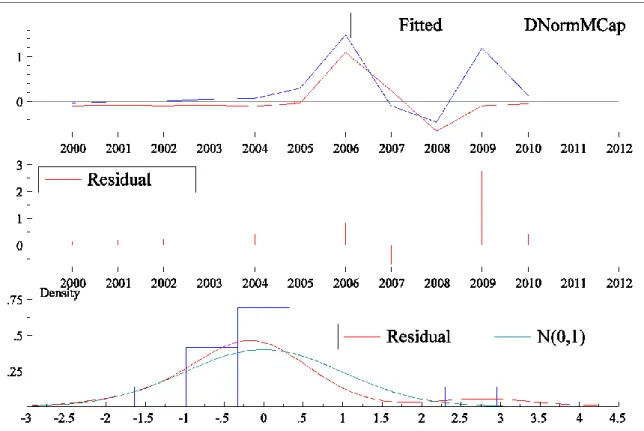
74 Source: Authors, using PCGive econometric software.
Figure 4. Graphical analysis of the regression model for Kazakhstan.
For the Republic of Kazakhstan, the estimation results indicate significant and positive relationship between the international capital flows and stock market performance. It is possible to explain almost 60% of total variability in market capitalization with variability of the private capital flows to and from Kazakhstan. Estimated parameters are significantly different from ZERO, and are statistically significant.
Conclusions
The aim of this empirical study was to analyze the statistical relationship between international capital flows and stock market performance in two developing countries. This topic is well elaborated in the literature on emerging economies due to several economic policy reasons. Stiglitz (2002) suggests that the financial liberalization observed since the end of 1980s has been detrimental for sustainable growth of low-income countries. He claims that globalization brings instability to small open economies that are sensitive to international capital flows. Following this insight, a simple linear regression exercise has been conducted, with a focus on the Sultanate of Oman and the Republic of Kazakhstan. There are some similarities between
75
these two economies, mainly in the pattern of the main sources of income and foreign trade pattern. Hydrocarbons are the main commodity exported from these countries. Both of them have a stock market with relatively short history, and an exchange rate regime that may offer significant protection for all foreign investors willing to take long positions in financial assets in these countries. For international investors these two investment opportunities should be more or less similar. Therefore, one could expect that the response of stock markets in both countries is also similar. We posed this hypothesis and we tested it formally by estimating coefficients for international capital flows in a regression with stock market performance as the endogenous variable.
It was found that these two countries operate stock exchanges that respond to net capital flows in a very different manner. Despite the fact that both are small open economies, and fully included in the global financial system, the Sultanate of Oman seems to be a bit underestimated by foreign portfolio investors. The Republic of Kazakhstan stock market is a different playground that is visited by global portfolio capital much more often. And the KASE responds strongly to any changes in net capital flows. This results in higher volatility of prices at this Central Asian stock market.
There is no simple answer to a question of which of these two stock markets is a more attractive place for investing. The fact that international capital flows avoid Oman may be a result of relatively shallow stock market in this country. Therefore, it would be relatively easy to destabilize this Middle-East stock exchange. A continuous inflow of foreign portfolio investments would result in systematic financial asset inflation, and sudden stops or reversals would cause an inverse effect. Another observation could be that with a higher relative level of domestic savings, there is no gap between demand and supply of capital to be closed by importing foreign savings. This, however, is not the case for Kazakhstan.
The stock market in the Republic of Kazakhstan responds strongly to net flows of capital, which is not an unusual situation for an emerging economy. The de facto fixed exchange rate regime, along with high credibility of this commitment, encourages foreign portfolio investors by significantly reducing exchange rate risk. Despite the fact that it has one of the highest growth rates of the GDP in the world, Kazakhstan still suffers from the lack of domestic savings, and capital is scarce. This specific country has a much shorter history of
76
capital accumulation than Oman, and specific socio-economic conditions that justify low propensity to save, and invest domestically. There have been several serious financial crimes in recent years in Kazakhstan that undermined the credibility of financial intermediaries. Mobilization of domestic savings is therefore challenging. As a result, the national economy imports foreign capital to develop the oil and gas sector along with other heavy industries and agriculture. Capital flows in and out and has some direct and destructive influence on the Kazakhstan Stock Exchange, as observed on the basis of estimated coefficients of the simple regression model. For domestic investors, it becomes important to observe the BOP situation to recognize properly the factors standing behind the observed developments at the national stock market. Residuals in our model for KASE are proxies of the “local content” in its performance. To provide a clear example one could focus on the residual in 2009, when the bullish market was a result of decisions and actions of domestic investors, rather than the foreign ones.
This paper contributes to the methods of empirical analysis of stock market performance. Our proposition is that residuals in a simple regression model (1) are proxies of the local content, when stock market performance is regressed against net foreign capital flows. References: 1. "Банковская система за десять лет независимости Казахстана ". Национальный Банк Республики Казахстан, Алматы, 2001. 2. Ayaganov B. G. Абжанов Х.М., Силвестров С.В. Бекенов М.С. , Современная история казахстана // Институт Истории государства МОН РК, Алматы "Раритет" 2010 год
3. Edwards S., Garcia M. G. P., (2008), Introduction to "Financial Markets Volatility and Performance in Emerging Markets", in “Financial Markets Volatility and Performance in
Emerging Markets”, Edwards S., Garcia M. G. P. (eds.), National Bureau of Economic
Research, University of Chicago Press, ISBN: 0-226-18495-1.
4. Henry B. P., Kannan P., (2006), Growth and Returns in Emerging Markets, in
77
Liberalization, and Exchange Rate Policy (NBER-EASE Volume 17), Takatoshi Ito and
Andrew K. Rose (Editors), The University of Chicago Press, ISBN: 0-226-38682-1, pp. 241 - 265.
5. Kaplan R. D., (2011), Omani Renaissance Man, Foreign Policy, March 1, 2011. 6. Krugman P., (1994), The myth of Asia’s miracle. Foreign Affairs 73:62–78.
7. Malkiel B., and Mei J. P., (1998), Global Bargain Hunting: The Investor’s Guide to
Profits in Emerging Markets. New York: Simon Schuster.
8. Masanova L. E., (1999), Ресурсно-сырьвой профиль Республики Казахстан и
проблемы становления частной собственности и государственного суверенитета // Центральная Азия и Кавказ, 1999 – www.ca-c.org
9. Młodkowski P., (2007), Non-European Monetary Unions. History and Operations, WN PWN, Warsaw 2007.
10. Mobius M., (1994), The Investor’s Guide to Emerging Markets. Columbus, OH: Mc-Graw-Hill.
11. National Human Development Report 1995 "The Challenge of Transition", UNDP Kazakhstan, 1 January 1996 (Monday).
12. Rayeva R. "О банковской системе Казахстана" // журнал "Банки Казахстана", №6 (2001)
13. Shynybekov D. A., (2006), Краткий обзор рыночных преобразований в странах СНГ // Каржы – каражат, Алматы, 2006, № 5 – 6.
14. Stiglitz J., (2002), Globalization and its discontents, W.W. Norton and Company. 15. Ведомости Парламента Республики Казахстан, 1995 г., N 24, ст. 163.
Statistical Appendix
Model for the Republic of Kazakhstan variables:
1. Market Capitalization – MCap, later normalized to NormMCap.
2. Private Capital Flows (net) – PrivCap, later normalized to NormPrivCap
Normality test for NormMCap
Sample size 15: 1997 to 2011 Mean 0.000000 Std.Devn. 1.000000
78 Skewness 0.624731 Excess Kurtosis -1.288177 Minimum -0.854975 Maximum 1.814872 Normality Chi^2(2)= 10.069 [0.0065] ** (asymptotic form of normality test: 2.0128)
Normality test for NormPrivCap
Sample size 15: 1997 to 2011 Mean 0.000000 Std.Devn. 1.000000 Skewness 0.958831 Excess Kurtosis 0.888993 Minimum -1.768159 Maximum 2.370033 Normality Chi^2(2)= 3.9405 [0.1394] (asymptotic form of normality test: 2.7923)
The present sample is: 1997 to 2011
Descriptive statistics Means NormMCap NormPrivCap 6.6613e-017 9.2519e-018 Standard Deviations NormMCap NormPrivCap 1.0351 1.0351 Correlation matrix
79 NormMCap NormPrivCap NormMCap 1.0000 NormPrivCap 0.52784 1.0000 Unit-root tests 1998 to 2011 Critical values: 5%=-1.968 1%=-2.757
t-adf beta Y_1 \sigma lag NormMCap -0.99148 0.84791 0.57259 0 NormPrivCap -2.7664** 0.14637 1.0633 0
Unit-root tests 1999 to 2011 – after de-trending both variables by calculating first differences (lag = 1) and presenting first differences as a percentage rate of
change.
Critical values: 5%=-1.97 1%=-2.776
t-adf beta Y_1 \sigma lag
DNormMCap -3.3385** -0.034680 0.61774 0 DNormPrivCa -2.7188* -0.23424 1.3793 0
Model for the Sultanate of Oman variables:
1. MSM30 market index – MSM30, transformed into percentage rate of change to deal with non-stationary behavior.
2. Financial Account balance of the Balance of Payments –
Normality test for DMSM30
80 Mean 0.073459 Std.Devn. 0.303404 Skewness -1.422026 Excess Kurtosis 1.060607 Minimum -0.660592 Maximum 0.382261 Normality Chi^2(2)= 5.6026 [0.0607] (asymptotic form of normality test: 3.4551)
Normality test for DICF
Sample size 9: 2003 to 2011 Mean 1.912300 Std.Devn. 1.659014 Skewness 1.585520 Excess Kurtosis 1.764127 Minimum 0.253886 Maximum 6.111111 Normality Chi^2(2)= 6.7257 [0.0346] * (asymptotic form of normality test: 4.9379)
The present sample is: 2003 to 2011
Descriptive statistics Means DMSM30 DICF 0.073459 1.9123 Standard Deviations DMSM30 DICF 0.32181 1.7597
81 Correlation matrix DMSM30 DICF DMSM30 1.0000 DICF 0.27114 1.0000 Unit-root tests 2004 to 2011 Critical values: 5%=-1.989 1%=-2.968
t-adf beta Y_1 \sigma lag DMSM30 -3.2667** -0.17531 0.33022 0 DICF -3.5782** 0.34189 1.3947 0