第 56 卷 第 1 期
2021 年 2 月
JOURNAL OF SOUTHWEST JIAOTONG UNIVERSITY
Vol. 56 No. 1
Feb. 2021
ISSN: 0258-2724 DOI:10.35741/issn.0258-2724.56.1.12
Research articleEconomics
U
SING A
M
ATHEMATICAL
M
ODEL TO
E
VALUATE
P
HARMACEUTICAL
C
OMPANIES
’
P
ERFORMANCE IN
V
IETNAM
使用数学模型评估越南制药公司的表现
Dr. Le Tien Muoi a, Prof. Wang Chia Nan b, Dr. Nguyen Han Khanh c, *, MBA. Huynh Cong Danh d
a
Faculty of Economics and Business, Phenikaa University, Yen Nghia Ward, Ha Dong District, Ha Noi 12116, VietNam, muoi.letien@phenikaa-uni.edu.vn
b Department of Industrial Engineering and Management, National Kaohsiung University of Science and Technology, Taiwan, Chien Kung Campus 415 Chien Kung Road, Kaohsiung 807, Taiwan, cn.wang@nkust.edu.tw
c
Faculty of Economics, Thu Dau Mot University, Thu Dau Mot City, Vietnam, khanhnh@tdmu.edu.vn d Faculty of Economics, Thu Dau Mot University, Thu Dau Mot City, Vietnam, danhhc@tdmu.edu.vn
Received: November 28, 2020 ▪ Review: December 25, 2020 ▪ Accepted: January 24, 2021
This article is an open-access article distributed under the terms and conditions of the Creative Commons Attribution License (http://creativecommons.org/licenses/by/4.0)
Abstract
Today, the health industry is known as a human healthcare service required to develop the economy ensuring life and health for people of each country. Applications of science and technology to create tools, equipment, and drugs always focus on applying a lot to healthcare and getting top priority. Therefore, the health sector always has the most important role in providing community health, treating diseases, ensuring life, and maintaining human health to study and work. Besides, the health sector contributes a lot to the socio-economic development of each country. In this study, the authors use data on pharmaceutical enterprises' business situation in 2012-2017 to process, analyze and evaluate the business performance of all these businesses from 2012 through 2017 by using the Malmquist productivity index model of data envelopment analysis. This study has achieved positive results and high applicability; the authors used specific indexes to evaluate the efficiency of use and changes in technique and technology at pharmaceutical companies, which helps managers have both broad and detailed insights into the production and business activities of these enterprises.
Keywords: Pharmaceutical Company, Malmquist Model, Data Envelopment Analysis, Business Performance
摘要 今天,健康产业已成为发展经济以确保每个国家人民的生命和健康所必需的人类保健服务。
科技在创造工具,设备和药物方面的应用始终侧重于在医疗保健中大量应用并获得最高优先级。 因此,卫生部门在提供社区健康,治疗疾病,确保生命和维持人类健康方面的研究和工作中始终 发挥着最重要的作用。此外,卫生部门为每个国家的社会经济发展做出了很大贡献。在这项研究 中,作者使用数据包络分析的马尔奎斯特生产率指数模型,使用 2012-2017 年制药企业的经营状
况数据来处理,分析和评估所有这些企业在 2012 年至 2017 年的经营绩效。该研究取得了积极的 成果,具有很高的适用性。作者使用特定的指标来评估制药公司的使用效率以及技术和技术的变 化,这有助于管理人员对这些企业的生产和经营活动有广泛而详尽的见解。
关键词: 制药公司,马尔奎斯特模型,数据包络分析,业务绩效
I. I
NTRODUCTIONThe economy of Vietnam in 2018 flourished on all three regions of production, supply, and demand of the economy along with development. Economic growth in 2018 reached 7.08% compared to 2017, the highest increase in 11 years [1]. The quality of growth, investment, and business environment has been improved; the newly established businesses increased sharply. The macroeconomic foundation is strengthened and gradually enhanced. Unemployment and underemployment tend to decrease. Social security is concerned about implementation.
GDP of Vietnam in 2018 increased 7.08%, the highest increase since 2008 onwards. This year's growth exceeded the 6.7% target set as a result of the drastic administration of the Vietnam Government. With the growth rate of the whole economy in 2018, the agriculture, forestry, and fishery sector increased by 3.76%, contributing 8.7% to the overall growth rate; industry and construction sector increased by 8.85%, contributing 48.6%; service sector increased by 7.03%, contributing 42.7%. In terms of GDP utilization in 2018, final consumption increased by 7.17% compared to 2017; asset accumulation increased 8.22%; export of goods and services by 14.27%; imports of goods and services increased 12.81% [1].
In industry and construction, the processing and manufacturing industry continues to be the main contributor to economic growth with a high increase of 12.98%, although lower than the growth rate of 2017 but much higher than the growth rate of the years 2012-2016, contributing 2.55 percentage points to the overall growth [1]. Growth results show that the economy had escaped its dependence on mineral and resource exploitation as 2018 was the third consecutive year when the mining industry had a negative growth (down 3.11%), reducing by 0.23 percentage points of the total added value increase of the whole economy [1].
The service sector in 2018 increased by 7.03% higher than the growth rate in the period of 2012-2016, in which the market services sector contributed a large proportion to GDP growth such as wholesale and retail; financial, banking,
and insurance activities; accommodation and catering services; transportation, warehousing, all achieved good growth rates (see Table 1). Trade and service activities in 2018 saw good growth; consumer purchasing power increased, total retail sales of goods and consumer service revenue this year reached 4,395.7 trillion dongs, up 11.7% over with 2017 [2]. Table 1. GDP growth 2012-2018 [3-6] Years GDP growth (%) 2012 5.25 2013 5.42 2014 5.98 2015 6.68 2016 6.21 2017 6.81 2018 7.08 2019 7.02
In recent years, Vietnam's labor productivity has remarkably improved, increasing steadily over the years. Now Vietnam is a country with a high growth rate of labor productivity in the ASEAN region. Labor productivity of the entire economy at current prices in 2018 is estimated at 102 million VND/employee (equivalent to 4,512 USD), increasing by 346 USD compared to 2017. Calculated by comparison price, 2018 labor productivity increased by 5.93% with 2017, the average period of 2016-2018 will increase 5.75% per year, higher than the 4.35% per year increase of the 2011-2015 period [2].
The efficiency of using investment capital is reflected in the gradual improvement of the ICOR index, from 6.42 in 2016 to 6.11 in 2017 and estimated in 2018 to be 5.97. The average period of 2016- 2018 ICOR coefficient is 6.17, lower than 6.25 of the period 2011-2015. The openness of the economy is growing; in 2018, the total turnover of import and export of goods and services is 208.6%, which proves that Vietnam exploits the strength of the domestic economy and at the same time. The world market is possible [2].
The scale of the economy is increasingly expanded thanks to maintaining a good growth rate. GDP at current prices in 2018 reached VND 5,535.3 trillion, twice the size of GDP in 2011.
GDP per capita in 2018 is estimated at VND 58.5 million, equivalent to USD 2,587, up to USD 198 compared to 2017 [2].
Vietnam's economic structure continues to shift positively according to the trend of reducing the proportion of agriculture, forestry, and fisheries; increase the share of industry, construction, and service industry. In 2018, the agriculture, forestry, and fishery sector accounted for 14.57% of GDP; the industry and construction sector accounted for 34.28%; the service sector accounted for 41.17%; product tax minus product subsidies accounted for 9.98% [2].
Foreign direct investment from the beginning of the year to 20/12/2018 attracted 3,046 new licensing projects with a registered capital of USD 17,976.2 million, an increase of 17.6% in the number of projects and a decrease of 15, 5% of registered capital compared to the same period in 2017 [7].
Besides, there are 1,169 licensed projects from previous years registered to adjust investment capital with additional capital of USD 7,596.7 million, reducing 9.7% compared to the same period last year. Thus, the total newly registered and additionally registered capital in 2018 reached USD 25,572.9 million, down 13.9% compared to the same period of 2017. Foreign direct investment capital implemented in 2018 is estimated to reach the USD 19.1 billion, an increase of 9.1% compared to 2017 [7].
II.
L
ITERATURER
EVIEW A. Vietnam Pharmaceutical OverviewThe policy of social security, social welfare, and health care for Vietnam people has been focused and cared for in recent years, ensuring publicity, transparency, timely and right subjects. Good implementation of extraordinary assistance ensures that people in times of risks and natural disasters are timely supported, overcome difficulties, and stabilize their lives.
Vietnam is one of 17 countries classified as having the highest pharmaceutical growth (Pharmerging markets). The Vietnam pharmaceutical industry currently stops at level 3, meaning that there is a domestic pharmaceutical industry, a generic drug manufacturer, and some pharmaceutical products exported (see Table 2).
Table 2.
Value of imported drugs and medication costs per capita [8]
Year Value of imported drugs (million USD)
Medication costs per capita (USD)
2009 1,170.83 19.6 2010 1,252.57 22.3 2013 1,880.00 31.8 2014 2,035.00 34.5 2015 2,320.00 38.0 2016 2,563.00 43.3
By the end of 2017, total pharmaceutical revenue was estimated at the USD 5.2 billion, equivalent to VND 120,000 billion, up 11% compared to the revenue of USD 4.7 billion in 2016 (≈106 trillion VND) and correspondingly increased by 14% when calculated on the local currency. Forecasts of pharmaceutical industry revenue in the following years will still be growing and will keep an average increase of 10% in the next five years [8].
Vietnam is entering the stage of aging, people's awareness of health issues is gradually improved, and per capita income continues to remain high, so the demand for pharmaceutical products and health services will be increasingly expanded. This is shown through the average spending on drug procurement of people tends to increase over the years. Specifically, from 2000 to 2015, the average spending on people's drug products has increased significantly from 5.4 USD/person in 2000 to 38 USD/person in 2015, equivalent to the growth rate. The average annual growth rate is 14% [8].
It is forecasted that per capita pharmaceutical spending will continue to remain high in the coming years, and the average annual growth rate will also remain at 14% per year [8].
* Manufacturing and trading pharmaceutical products in Vietnam:
* Supply network: The drug supply network in Vietnam includes 1,910 domestic pharmaceutical enterprises and 30 foreign-invested enterprises. Although overwhelming in volume, domestic medicine is still weaker than foreign medicine. According to the Drug Administration of Vietnam, the consumption of domestically produced drugs on the total consumption of drugs in the whole country only accounts for 48% of total consumption [8].
* Input market: The situation of importing pharmaceutical products from Vietnam tends to increase strongly in recent years. In 2016, pharmaceutical import value reached USD 2.56 million, up 10.4% compared to 2015, of which the import of pharmaceutical raw materials accounted for nearly 15% of the total value, reaching the USD 381 million (+ 12.7%). The demand for imported pharmaceuticals in the country is mostly a brand-name drug, a patent medicine, and a high-quality medicine (accounting for 55% of total demand). The main import market is Europe, France, Austria, Belgium, Poland, Spain, etc. While for cheap
drugs, the import market mainly comes from India and China [8].
Output market and distribution system: The pharmaceutical industry has two main distribution channels, including hospital channel (ETC) and retail channel (OTC); For ETC channel: According to the General Statistics Office, by 2016, Vietnam currently has 13,591 clinics nationwide, of which there are about 1,077 hospitals and 11,102 medical stations in communes and wards. Enterprises distribute via ETC channel mainly through bidding activities [8].
B. Data Envelopment Analysis Overview The data envelopment analysis (DEA) method was first introduced by Farrell in 1957. DEA is a data processing and analysis tool used in evaluating the performance of enterprises [9]. This method assumes, if producer A uses the inputs X (A) to produce products Y (A), producer B uses the inputs X (B) to produce products that are Y (B), many other manufacturers may have similar production processes. Combine many manufacturers in the market to create a mixed manufacturer (including n inputs and m output elements). In fact, this mixed manufacturer does not exist, so it is called a virtual manufacturer. The DEA method assumes that this virtual manufacturer has the best business performance and then compares the business performance of real businesses other than virtual businesses. If the same amount of inputs is similar but produces more output or the same output with fewer inputs, it is considered an effective virtual producer, a better business [9].
C. Related Studies
Since the introduction by Farrell in 1957, the DEA has been used by many researchers around the world in many scientific projects in many different fields,providing good results [9-14].
The DEA method was used to assess corporations' investment efficiency in urban development investment and infrastructure investment in Vietnam[15]. In this study, the authors focused on assessing investors' effectiveness in urban development and infrastructure investment in Vietnam.
The grey system theory was applied in conjunction with DEA models to help textile enterprises find partners in the supply chain [16]. Thereby helping businesses exploit market opportunities and take advantage of the resources of the textile industry. When implementing an effective alliance, businesses will maintain strategic objectives and contribute to the stable
and sustainable development of the textile industry.
Contractors' performance was evaluated using DEA models [17]. This study shows that contractors are divided into three groups: highly efficient contractors, stable contractors, and inefficient groups. Thus, the authors have proposed the government, management agencies, and investors selecting good contractors to develop strategies and policies for transport infrastructure development in Vietnam.
The optimal algorithm in the DEA was applied to evaluate the companies' business efficiency in 2014–2017 and the Grey system theory to forecast business results and their future use from 2018 through 2021[30]. This study suggested a method to measure, evaluate, and forecast the logistics companies' business performance.
The data of Thailand's energetic enterprises from 2013 to 2017 and from 2018 to 2020were evaluated by implementing the DEA Malmquist model and the Grey model (1,1) GM(1,1) [31].
The eco-efficiency assessment was conducted for 17 European countries by the Slacks-based measure (SBM) Data Envelopment Analysis (DEA) model. Catch-Up, Frontier-Shift, and Malmquist Productivity Index (MPI) have been used to evaluate eco-efficiency and efficiency change, technological change, and productivity change over 2013–2017 [32].
Besides, many other types of research in many other fields were implemented by scholars around the world and brought about highly relevant results.
III. R
ESEARCHM
ETHODOLOGY A. Research ProcessTo assess the business performance of pharmaceutical companies in Vietnam, the authors, in turn, followed the nine-step procedure.
Step 1: Based on the context of the
socio-economic situation in Vietnam. Especially the importance of the pharmaceutical industry has a great impact on human health. The authors consider that implementing the evaluation of pharmaceutical enterprises' business performance in Vietnam is an urgent topic and needs to be done immediately. Along with reviewing the scientific works done in the past, the authors identified the research objectives.
Step 2: After reviewing previous studies, the
authors identified this study as completely new, not duplicating other studies. Since then, the authors have built a target to assess
pharmaceutical companies' business performance in Vietnam between 2012 and 2017.
Step 3: Select pharmaceutical enterprises that
meet the requirements of the target and the conditions of the DEA research method to model the study: Specifically, the authors collected 21 enterprises with data of the business situation that meets the study's requirements to conduct analysis and evaluation.
Step 4: The authors have consulted about the
factors used by previous studies and achieved good results to select the factors in this study. Specifically, the authors used five inputs and two output factors to evaluate the business performance of pharmaceutical enterprises in Vietnam: Total assets (INPUT1); Equity (INPUT2); Cost of goods sold (INPUT3); Cost of sales (INPUT4); Enterprise cost management (INPUT5), and two output factors: Net sales (OUTPUT1); Profit after-tax corporate income (OUTPUT2).
Step 5: The DEA analysis and processing
method has many models used for many different research purposes based on the objectives of this study. The authors chose the Malmquist productivity index model as the main tool for evaluating pharmaceutical enterprises' business performance in Vietnam from 2012 through 2017.
Step 6: Data is synthesized statistically for 21
pharmaceutical enterprises in Vietnam between 2012 and 2017. The authors used the Malmquist productivity index model of DEA to evaluate the business performance of these businesses.
Step 7: The authors use the Pearson
coefficient to examine the correlation between the inputs and outputs used in this study to ensure the requirements of the DEA method.
Step 8: After using the Malmquist
productivity index model of DEA to analyze and process the data, the authors verified the results to ensure the appropriate correlation according to the conditions of the models. Based on this result, the authors analyzed and commented on pharmaceutical companies' business situation in Vietnam in 2012-2017. Based on the results of the leading enterprises in the pharmaceutical industry, the authors make general comments for the entire industry as a basis for regulatory agencies to adjust the industry strategy to suit the actual situation.
Step 9: Based on the analysis and evaluation
the authors draw the final conclusion of this study.
B. Samples Collection
1) Company Data Collection
The main product group in the pharmaceutical market in Vietnam is divided into product groups: Western medicine and oriental medicine.
For new medicines: The market for new medicines is considered a potential market with diversified products, great consumption demand, and an extensive distribution network. Revenue from the western medicine market always accounts for a large proportion of total revenue (~ 90%) [8].
For traditional medicines: The market share of traditional medicines accounts for a modest proportion, with the total pharmaceutical revenue contribution at only 10%. Oriental medicines are produced from raw materials such as plants, herbs, minerals, and so on. The effectiveness of treatment of oriental medicine is weaker than that of new medicines. However, oriental medicine can solve some chronic diseases according to body balancing mechanism. In addition, due to the production of natural medicinal products, traditional medicine products ensure safety for users [8].
After researching and learning about the pharmaceutical market in Vietnam, the authors have selected 21 enterprises in this industry from the Website of the General Statistics Office of Vietnam, which has business data to ensure the conditions of distribution processing DEA data. Enterprises are synthesized and coded by the authors, as shown in Table 3 below [2].
Table 3.
List of pharmaceutical companies [2]
Pharmaceutical company Coded
ARMEPHACO PH1 BECAMEX PH2 DAK LAK PH3 BEN TRE PH4 CUU LONG PH5 DA NANG PH6 HAI DUONG PH7 HAU GIANG PH8 HA TAY PH9 DOMESCO PH10 DANAMECO PH11 TRUNG UONG 3 PH12 DONG NAI PH13 TIPHARCO PH14 IMEXPHARM PH15 LAM DONG PH16 MEDIPHARCO PH17 NAM DUOC PH18 OPC PH19 PHARMEDIC PH20 TRAPHACO PH21 2) Collection of Elements
Determination of factors for evaluating the business efficiency of pharmaceutical companies
in Vietnam is very important. The used factors ensure both correlations of statistical significance following research methods and correlation of economic significance. Therefore, before selecting the factors for this study, the authors studied the factors that were used in previous studies, as follows:
Four input factors were used in [15]to assess corporations' investment efficiency in urban development investment and infrastructure investment in Vietnam: (1) Equity; (2) Total assets; (3) Cost of goods sold; (4) Total operating expenses, the researchers also applied two output factors: (1) Net sales; (2) Profit after-tax corporate income.
The researchers [16]used four input factorsfortextile enterprises to find partners in the supply chain: (1) Total assets; (2) Cost of sold capital; (3) Cost of sales; (4) Enterprise cost management, and two output factors: (1) Revenue of sales; (2) Profit after-tax corporate income.
The DEA was used to evaluate the performance of financial companies in Taiwan[23]. In that study, the researchers used three input factors: (1) Total assets; (2) Equity; (3) Number of employees and four output factors: (1) Income; (2) Profits; (3) Net earnings per share; (4) Market value. Their studies were successful and greatly applicable in the business activities of enterprises and industries of those countries [18].
Besides, the authors also refer to other studies assessing enterprises' business activities around the world that own DEA applications. Based on reference topics with specific objectives, in this study, the authors used five input factors and two output factors to evaluate the business efficiency of pharmaceutical companies in Vietnam from 2012 to 2017, including Total assets (INPUT1); Equity (INPUT2); Cost of goods sold (INPUT3); Cost of sales (INPUT4); Enterprise cost management (INPUT5), and two output factors: Net sales (OUTPUT1); Profit after-tax corporate income (OUTPUT2). The authors summarize the data on the business situation of 21 companies that ensure conditions of the DEA research method from Table 4 to Table 9 below.
Table 4.
Data for 2012 (USD Thousand) [2]
Table 5.
Data for 2013 (USD Thousand) [2]
Table 6.
Table 7.
Data for 2015 (USD Thousand) [2]
Table 8.
Data for 2016 (USD Thousand) [2]
Table 9.
Data for 2017 (USD Thousand) [2]
C. Application of the Data Envelopment Analysis Model
1) Correlation Coefficients
According to conditions when using DEA models, the authors used the correlation coefficient (k) to examine the correlation
between the factors used in this study. The correlation coefficient (k) is a statistical index that measures the correlation between two observed variables (a) and (b). The Pearson correlation coefficient is estimated by the following formula [14]: 1 2 2 1 1 (a )(b ) (a ) (b ) n i i i n n i i i i a b k a b
(1)The correlation coefficients range from (-1) to (1). The closer the Pearson correlation coefficient value is to 1, the stronger the correlation between these two factors is. In contrast, the closer the value of this coefficient is to 0, the weaker the correlation between these two factors. If (k)> 0, the two factors have a positive correlation, and if (k) <0, the two factors have a negative correlation [19].
2) The Malmquist Model
In 2001, a specialized model was announced for evaluating and ranking the business efficiency of enterprises [20-25]. The Malmquist productivity index model can measure profits change of an enterprise by scale.
The Malmquist productivity index (MPI) measures productivity change and time change and can be separated into efficiency and technology changes with DEA as a non-standard approach. In particular, the separation of business efficiency of an enterprise is influenced by two factors: The efficiency of technical changes and efficiency of technology change in the research period. MPI can be expressed as a distance function (E) as equation (1) and equation (2) using observations at time t and t+1 [26].
1 1
(
,
)
( ,
)
t t t t I I t t t IE x
y
MPI
E x y
(2) 1 1 1 1 1(
,
)
( ,
)
t t t t I I t t t IE
x
y
MPI
E
x y
(3) In particular, the authors indicate the direction of the MPI model. The geometric mean of two MPIs in equation (2) and equation (3) gives the equation (4) [27]. 1 2 1 2 1 1 1 1 1 1 1 ( ) ( , ) ( , ) [ ] ( , ) ( , ) G t t I I I t t t t t t I I t t t t t t I IMPI MPI MPI
E x y E x y E x y E x y (4)
It is possible to separate the input-oriented geometric mean of MPI by using the concept of input-orientation technique change (TECHCH)
and input-orientation efficiency change (EFFCH) as given in the equation [27].
1 2 1 1 1 1 1 1 1 1 1 1 ( ) ( , ) ( , ) ( , ) [ ] ( , ) ( , ) ( , ) G G I I I t t t t t t t t t I I I t t t t t t t t t I I I
MPI EFFCH TECHCH
E x y E x y E x y E x y E x y E x y (5)
The first and second clauses represent efficiency change and technology change, respectively. MPI given by equation (4) and equation (5) can be defined using distance functions like DEA [27]. It means that MPI components can be taken from estimating distance functions defined on frontier technology. The MPI is the most popular method among the those developed to estimate production technology [28-29]. By using both CRS and VRS DEA boundaries to estimate distance functions in Formula (5), technical performance can be separated into technical components precisely and purely. A scale change (SECH) is given in formula (6). 1 2 1 1 1 1 1 1 1 1 1 1 1 1 ( , ) ( , ) ( , ) ( , ) [ ] ( , ) ( , ) ( , ) ( , ) t t t t t t vrs vrs t t t t t t crs crs t t t t t t vrs vrs t t t t t t crs crs E x y E x y E x y E x y SECH E x y E x y E x y E x y (6)
Moreover, a pure ecological change (PECH) is given in (7) [28-29]. 1 1 1 1
(
,
)
( ,
)
t t t ers t t t crsE
x
y
PECH
E
x y
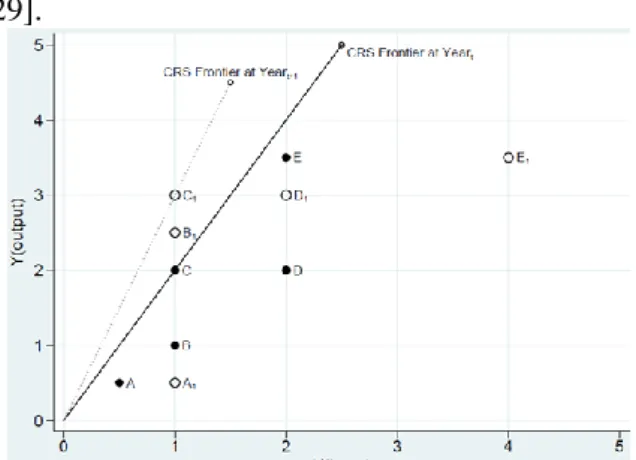
(7) Figure 1 shows that the observations and boundaries at time t and t1 are determined by constant proportional returns presented as considering input and output. This means that there is no effective increase for D in the time t and t1. When we use DEA distance measures, all values can be obtainedin Formulas (5, 6, 7) [28-29].Figure 1. Concepts of MPI using CRS DEA Frontier
If three indexes mentioned above are greater than 1, it shows the enterprise's business
efficiency at the time of comparison is better than the initial time. If these three indexes are equal to 1, the enterprise's business efficiency at the time of comparison corresponds to the original period. Finally, if these indexes are less than 1, the enterprise's business efficiency at the time of comparison is less ineffective than the initial time.
IV. R
ESULTS ANDD
ISCUSSION A. Results for Correlation CoefficientsIn this study, the authors used five input factors and two output factors to evaluate 21 pharmaceutical companies' business efficiency in Vietnam between 2012 and 2017. For data analysis and processing, the authors use the Malmquist productivity index model of DEA to evaluate companies' business efficiency. Based on conditions when using these models, the necessary condition is that the input and output factors used for analysis must have a positive correlation (k > 0). The authors use the Pearson correlation coefficient to test this condition. The obtained results are shown in Tables 10, 11, 12, 13, 14, and 15 below: Table 10. Correlation coefficients in 2012 Table 11. Correlation coefficients in 2013 Table 12. Correlation coefficients in 2014 Table 13. Correlation coefficients in 2015 Table 14. Correlation coefficients in 2016 Table 15. Correlation coefficients in 2017
The results for correlation coefficients in the above tables show that the correlation between factors in this study is positive (k > 0.4), indicating that the authors' input and output factors in this study have a positive correlation. This fact confirms that the analysis of the DEA model application and method used in this study is appropriate, highly reliable, and accurate enough to analyze and propose recommendations and solutions for companies in the particular and pharmaceutical industry in Vietnam in general.
B. The Malmquist Productivity Index Results
The Catch-up index in the Malmquist productivity index model of the DEA method is used to assess the performance changes in pharmaceutical companies' technical field in Vietnam in 2012-2017. The technical equipment of pharmaceutical companies plays a very important role in helping pharmaceutical companies manufacture good quality products, and modern techniques will contribute to the improvement of labor productivity. At the same time, technical development increases competitiveness through product diversification to better meet customer's requirements. Therefore, enterprises operating in the pharmaceutical industry must pay attention to technical aspects to enhance the company's competitive advantage in the market.
The Catch-up index results in Table 16 show that the pharmaceutical companies in Vietnam in 2012-2017 have not invested and innovated in technology, so they have not achieved good technical efficiency in this period. Specifically, the Catch-up index evaluated from 2012 through 2017 has not been up to standard (Average Catch-up 2012–2017 =0.9913<1).In particular, the points over years are shown in detail as follows: Average Catch-up 2012–2013 =0.9790; Average Catch-up 2013–2014 =1.0200; Average Catch-up 2014–2015 =0.9591; Average Catch-up 2015–2016 =1.0157; Average Catch-up 2016– 2017 =0.9827).
Table 16. Catch-up index
Especially in this period, many enterprises have achieved very high technical efficiency. Specifically, the technical efficiency point of PH10 in the period 2012-2013 was only 0.7814, but in the later period, it has achieved very high efficiency and maintained this until now (Average Catch-up 2013–2014 = 1.2762; Average Catch-up 2014–2015 = 0.8987; Average up 2015–2016 = 1.0129; Average Catch-up 2016–2017 = 1.1071). However, there are many pharmaceutical companies with low technical efficiency; for instance, PH6's technical efficiency points over the years are respectively: 0.6164; 0.8607; 0.8874; 0.9198; 0.7560. Pharmaceutical companies in Vietnam from 2012 to 2017 have not achieved good efficiency in technical performance. Therefore, it is necessary to have better investment and technical management to ensure the companies' business efficiency, thereby making the effectiveness of Vietnam's pharmaceutical industry stable and developing further.
2) The Frontier-Shift Index Results
The Frontier-shift index in the Malmquist productivity index model of the DEA method is used to assess the level of performance change in terms of technology of pharmaceutical companies in Vietnam between 2012 and 2017. In the pharmaceutical industry, the factors play a very important role and help pharmaceutical
companies manufacture good quality products; modern technology will facilitate product manufacturing at the lowest cost. The application of high technology in production will improve labor productivity, directly enhancing the competitiveness of goods and enterprises. The application of science and technology to increase labor productivity is an indispensable development rule in the industrial era 4.0. In Vietnam, many pharmaceutical companies have created products of high economic value thanks to the application of new science and technology. Therefore, pharmaceutical companies should pay attention to investing in technology, improve production lines to raise labor productivity, and get better advantages compared to other companies.
Table 17.
Frontier-shift index
According to analysis results shown in Table 17, technology in Vietnamese pharmaceutical companies has not been effectivein 2012-2017. However, technology efficiency points tend to increase in recent years; namely, pharmaceutical companies' average technical efficiency over each stage is as follows: 0.6715; 0.9775; 0.9723; 0.9850; 1.0129. These results show the technology solutions are selected to be applied in the pharmaceutical companies in Vietnam are being invested properly (particularly in
2016-1017, point of technology efficiency is > 1, Average Frontier 2016–2017 = 1.0129). In 2012-2013, the entire 21/21 pharmaceutical companies did not achieve efficiency in technology improvement. However, in 2016-2017, 14/21 pharmaceutical companies achieved good results in technology investment and development. This fact reflects that the proposed solutions are basically suitable and contributed significantly to promoting pharmaceutical companies' business situation, improving their competitiveness through diversification of products and services, and dominating market shares by automatic trading equipment in production lines.
3) The Malmquist Index Results
The result of business data processing from the Malmquist productivity index model of the DEA method reflects the inefficiency for pharmaceutical companies' business situation in Vietnam in 2012-2017 (Average Malmquist index for 2012–2017 = 0.9150). Under the current pharmaceutical conditions, when the economy is expanding, relation+-ships with multinational companies are increasingly being improved, especially when Vietnam deploys a policy of opening the pharmaceutical market following its commitment as joining the World Trade Organization (WTO), it is definite that more and more large multinational pharmaceutical companies around the world will penetrate the Vietnamese market, which makes Vietnam become a more intense and competitive market. It is not only an opportunity but also a great challenge for pharmaceutical companies in Vietnam. Therefore, to develop and dominate the domestic market, strong investment in technical and technological improvements, and simultaneously enhancing competitiveness to replace import goods is the prerequisite that Vietnamese pharmaceutical enterprises need to follow.
The detailed result of Table 18 reflects that pharmaceutical companies' business situation in Vietnam was getting more and more effective in 2012-2017. Specifically, the efficiency point was improved over years: 0.6616; 0.9891; 0.9332; 0.9995; 0.9914.The detailed result of Table 18 reflects that pharmaceutical companies' business situation in Vietnam was getting more and more effective in 2012-2017.Specifically, the efficiency point was improved over years: 0.6616; 0.9891; 0.9332; 0.9995; 0.9914. However, this result is not really commensurate with the potential of Vietnam's pharmaceutical industry.
Malmquist index
Some companies have achieved very good business performance in this period, such as PH13 with efficiency point tending to increase continuously and stably: 0.6714; 0.7630; 1.2003; 1.0224; 1.2234. These enterprises' effective operation greatly impacts the Vietnamese economy and contributes to the socio-economic development, industrialization, and modernization in Vietnam. However, there are also companies with erratic fluctuations of the business situation like PH6, its efficiency points in this period are, in turn: 0.2756; 0.7948; 0.7003; 0.8720; 0.8712.
The Vietnamesepharmaceutical companies face fierce competition from foreign pharmaceutical companies and companies with foreign direct investment. Therefore, business efficiency is actually not high. Suppose pharmaceutical companies in Vietnam want to achieve bigger business goals. In that case, they must increase investment and expenses in both the technical and technological fields and simultaneously sacrifice prevailing revenue and profits to pay attention to strategic objectives for each enterprise and the entire pharmaceutical technology industry of Vietnam.
V. C
ONCLUSIONSA. Conclusions
Vietnam's population is entering an aging stage, people's health problems are increasingly concerned and improved, and per capita income remains high. Therefore the demand for pharmaceutical products and medical services will be increasingly focused and expanded. Specifically, the average spending on drug procurement of people in recent years tends to increase. From 2000 to 2015, average spending on drug products increased significantly from 5.4 USD/person in 2000 to 38 USD/person in 2015, equivalent to an average annual growth rate of 14%. It is forecasted that per capita pharmaceutical spending will continue to be high in the coming time, and the average annual growth rate will continue to remain at 14%/year [2].
Therefore, the authors used actual business data from the business results of 21 pharmaceutical companies in Vietnam between 2012 and 2017 to assess the business efficiency of these companies in particular and the pharmaceutical industry of Vietnamese in general to help managers in companies, investors, and government agencies can rely on these results of this study for evaluating and making business and investment strategies and the whole-sector structure in the future, which has practical and urgent implications.
The data source which is used by the authors in this study follows the research objective and area. This data source is tested to ensure conditions when processing and analyzing so that the research results are highly reliable.
Business data collected by the authors for six consecutive years ensure to provide persistent perspectives to managers in companies, investors in this area of business activities, and the pharmaceutical industry in Vietnam in the period 2012-2017.
The results in this research help managers see the actual conditions of the business, identify the stages that are operating well and which parts are not performing well within the enterprise itself. At the same time, there is a basis to compare to other businesses in the same business sector and the overview of the economy enabling them to make better investment decisions in the future.
In the study, the authors used specific indexes to evaluate the efficiency of use and changes in technique and technology at pharmaceutical companies, which helps managers have both broad and detailed insights into the production and business activities of these enterprises.
This study has achieved positive results and high applicability. However, there are still some certain limitations:
The number of enterprises selected as models is limited.
The internal environmental factors and external ones of enterprise have not been combined.
The macro factors and micro factors have not been combined.
The interdisciplinary factors such as health, education, and other socio-economic situations have not been combined.
These limitations will be further studied by the authors. Furthermore, more inputs and outputs variables can be discussed and assessed by this proposed model in further studies.
A
CKNOWLEDGMENTThe authors no received any financial support for the research, authorship, and/or publication of this article.