(PET) image & Functional Near Infrared
Spectroscopy (fNIRS) data
著者
ファイルス ビンティ モハマナシ−
学位授与機関
Tohoku University
Positron Emission Tomography (PET) Image
And
Functional Near Infrared Spectroscopy (fNIRS) Data
FAIRUZ BINTI MOHD NASIR
GRADUATE SCHOOL OF BIOMEDICAL ENGINEERING TOHOKU UNIVERSITY
A thesis submitted to the Graduate School of Biomedical
Engineering in Partial Fulfilment of Requirements for the
Degree of Doctor of Philosophy in Biomedical Engineering
i
Abstract
Functional Near-Infrared Spectroscopy (fNIRS) and Positron Emission Tomography
(PET) is the imaging technique that gives functional information, especially for imaging
the brain activity. The objective of this PhD project is to register fNIRS signals on the
PET image. fNIRS measures oxyhaemoglobin and deoxyhaemoglobin in blood while
PET measure the physiological function of the human body such as measuring the
glucose consumption in the active area of the brain. fNIRS has high temporal resolution
while the PET image has better spatial resolution compared to fNIRS. However, fNIRS
measures haemodynamic changes in the cortex region but not in deeper brain structures.
Thus, the proposed registration methods of fNIRS and PET is to improve the specificity
given by both methods. The registration is based on a hardware-based system which
used an optical tracking system; Polaris. The proposed method was validated using a
fNIRS-PET phantom. Thereafter, the registration of fNIRS on PET image was
performed on eleven subjects where each subject undergoes fNIRS examination along
with the fNIRS task and then PET scan. To register the fNIRS probe on the PET image,
we did a several series of the transformation of fNIRS probe coordinate into the PET
coordinate. Polaris markers were used as the references marker to determine the
transformation matrixes. The fNIRS probe was registered on the PET image using the
in-house software and the activation area during the fNIRS task can be view on the PET
image. The registration done in this study is successful as we can view the fNIRS
ii
Acknowledgement
Firstly, I would like to express my sincere gratitude to my supervisor, Professor Hiroshi Watabe for the continuous support of my PhD study and related research. His guidance helped me in all the way to finish my research and writing of this thesis. I am very grateful to have a supervisor who has immense knowledge, patience and motivated.
Besides my supervisor, I would like to thank Professor Manabu Tashiro who allowed me to join his research team. Without their precious support, it would not be possible to conduct this research.
My sincere thanks also go to Mr Masayasu Miyake and Mr Soichi Watanuki for their help in my research.
I would like to thank my fellow laboratory members for the discussions and for all the fun we have had in the last four years. Besides that, thank you also to all staff of Cyclotron and Radioisotope centre for their help and support throughout my present-day here.
Special acknowledgement to the Malaysian government especially Ministry of Higher Education for the scholarship under Academic Training Scheme and University Sultan Zainal Abidin (UniSZA) who gave me the opportunity to further my study to the PhD level.
Also, a special thanks to my husband, Mr. Ashadi Izzat for his continuous and tremendous support over this journey and all Malaysian friends and who always help and be like a big family here.
Last but not least, I would like to acknowledge with a deep sense of reverence, my gratitude towards, my parents Mr. Mohd Nasir and Mrs. Sofiah, my siblings and family in law for supporting me spiritually throughout writing this thesis and my life in general.
iii
Content
Abstract ... i Acknowledgement ... ii Content ... iii List of tables ... viList of figures ... vii
Abbreviations ... xii
Nomenclature ... xiii
Chapter 1 ... 1
Introduction ... 1
1.1 Medical image registration... 1
1.2 Methods of medical image registration ... 4
1.3 Objective ... 4
1.4 Structure of the thesis ... 6
Chapter 2 ... 7
Study background ... 7
2.1 Introduction ... 7
2.2 Functional Near-Infrared Spectroscopy (fNIRS) ... 8
2.3 Positron Emission Tomography (PET) ... 10
2.4 Literature review on the combination of fNIRS and PET ... 12
2.5 An overview of multimodal fNIRS with other imaging modalities ... 15
2.5.1 fNIRS-fMRI ... 15
2.5.2 fNIRS-EEG ... 16
Chapter 3 ... 20
Imaging modalities and optical tracking system ... 20
3.1 Introduction ... 20
3.2 Positron Emission Tomography (PET) ... 20
iv
3.3 Optical tracking system; Polaris ... 22
Chapter 4 ... 25
Theory of registration method... 25
4.1 Introduction ... 25
4.2 Consideration criteria for the transformation ... 26
4.2.1 The fNIRS measurement channel on the cap ... 26
4.2.2 The Polaris marker ... 27
4.2.3 Gantry markers ... 28
4.3 The coordinate system ... 28
4.4 Proposed registration methods ... 29
4.4.1 The transformation and registration ... 29
4.4.2 The calibration experiment ... 30
Chapter 5 ... 31 Validation study ... 31 5.1 Introduction ... 31 5.2 Objectives ... 31 5.3 Phantom set-up ... 32 5.4 Methods ... 33
5.4.1 fNIRS and Polaris measurement ... 34
5.4.2 PET and Polaris measurement ... 35
5.4.3 Calibration experiment ... 36
5.5 The transformation ... 37
5.6 Result ... 38
5.6.1 Transformation steps ... 38
5.6.2 The probe position in PET coordinate ... 38
5.6.3: The precision test ... 40
5.6.4 The accuracy test ... 41
5.6.5 fNIRS signal ... 42
5.6.7 The registration ... 43
v Chapter 6 ... 45 Human study ... 45 6.1 Introduction ... 45 6.2 Objectives ... 45 6.3 Experimental design ... 46 6.4 Methods ... 47 6.4.1 Data measurement ... 47 6.4.1.1 Participant ... 47 6.4.1.2 Study protocol ... 48 6.4.1.3 fNIRS preparation ... 49 6.4.1.4 fNIRS task ... 50
6.4.1.5 PET and Polaris measurement ... 52
6.4.1.6 Calibration experiment ... 53
6.4.2 The transformation ... 53
6.4.2.1 Conversion of PfNIRS (x, y, z) into CPOL ... 54
6.4.2.2 Conversion of PPOL (x, y, z) and MPOL (x, y, z) into CPET ... 55
6.4.3 The registration ... 56
6.5 Result ... 57
6.5.1 Transformation matrices ... 57
6.5.2 fNIRS signals ... 58
6.5.3 The fusion image ... 59
6.5.4 The activation area on the PET image ... 60
6.6 Discussion ... 60
Chapter 7 ... 62
Discussion and summary ... 62
References ... 69
vi
List of tables
Table 2.1 : The positron emission radionuclide that commonly used in PET... 11 Table 5.1 : Markers in PET coordinate for position 1……….. 39 Table 5.2 : Markers in PET coordinate for position 2……….. 39 Table 5.3 : Markers in PET coordinate for position 3……….. 39 Table 5.4 : The standard deviation shows the difference between the three
vii
List of figures
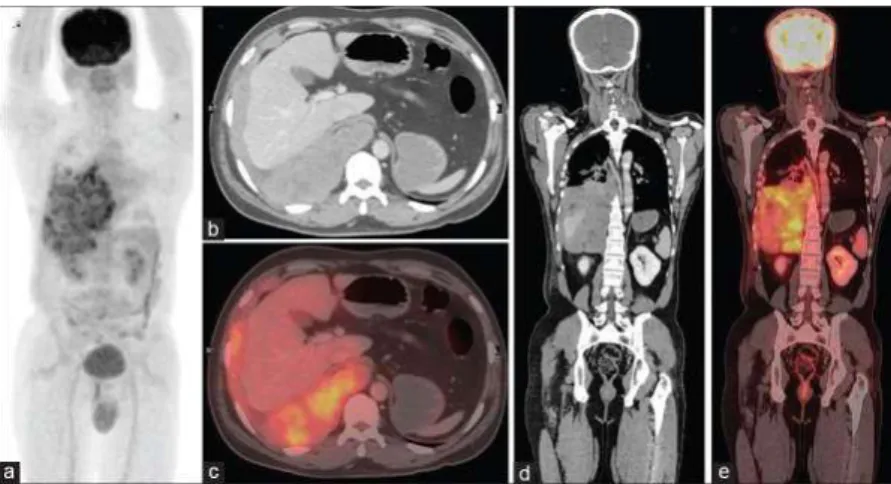
Figure 1.1: The example of whole-body 18-fluoride-fluoro deoxyglucose (18F-FDG) PET-CT scan fusion image to study primary pleural
synovial sarcoma………. 3
Figure 1.2: The example of an image from integrated SPECT-CT. This image is the transverse and coronal images of a patient's SPECT-CT fused data sets including the three lower lumbar
vertebrae………... 3
Figure 2.1: The illustration of the emitting and receiving probe of fNIRS. The light travels in banana shape through the cortex region and detected by the receiving probe………. 10 Figure 2.2: The illustration of the principle of the PET imaging system. The
annihilation photon will be detected the detector as coincidence event and used to reconstruct PET image………. 12 Figure 3.1: The PET machine used in this study; Eminence STARGATE
PET-CT scanner. This study only involves using a PET scan
instead of CT-scan……… 20
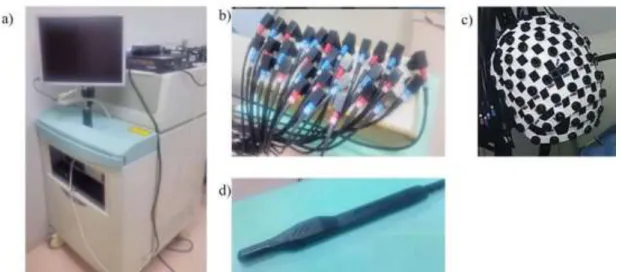
Figure 3.2: a) fNIRS system which consists of a monitor and operating console b) fNIRS probes; emitting and receiving probe c) fNIRS cap with the hole to fix the corresponding probes and d) the Fastrak 3D magnetizer which used to determine the probe location………... 21 Figure 3.3: The example of fNIRS probe fixed on the cap and fitted on the
subject head. The probe must be fixed in the corresponding hole so that the signal record as mapped in the system……… 22 Figure 3.4: The Polaris used in this study to track the 3D position of the
Polaris markers within a defined coordinate system by emitting infrared light and detect the reflected infrared light from the
Polaris marker………... 23
Figure 3.5: The ball type, passive Polaris markers. The material of these markers can reflect the infrared light coming from the Polaris
system………... 24
Figure 3.6: The sticker type Polaris markers shown by red arrows. It is easier to stick on the curve surface, for example, in the picture, three sticker markers are attached on the fNIRS cap to determine the 3D position of the fNIRS channel on the cap……… 24
viii Figure 4.1: The illustration of the emitting, receiving and the measurement
signal channels. The red colour blocks indicate the transmitting probe and the blue colour blocks are the receiving probes while the numbers in the yellow colour blocks are the channel number. 26 Figure 4.2: The illustration of Polaris markers that used as the reference
marker in both fNIRS and PET scan. Since the subject wears the same cap, the markers share the same coordinate in both fNIRS
and PET measurements……… 27
Figure 4.3: The illustration of the Polaris markers on the PET gantry that used as the reference of the Polaris position so that the Polaris do not have to be in a fix position during each time measurement………. 28 Figure 4.4: The illustration of the transformation of the fNIRS probe to the
CPET. The coordinate of the probe on the cap must be transformed into the PET coordinate in order to register the probe on the PET
image……… 29
Figure 4.5: The illustration of the transformation flow and registration. The probe coordinate must be transformed from fNIRS coordinate to Polaris coordinate and PET coordinate and then register on the
PET image……… 30
Figure 5.1: (a) the fNIRS-PET phantom, which is special design phantom that can be used for both fNIRS and PET measurement (b) Aqueous lipid solution which uses as the medium for the fNIRS measurement and (c) the black ink which used to get the continuous signal during the fNIRS record………... 32 Figure 5.2: The set-up of the fNIRS-PET phantom. The aqueous lipid
solution was filled in the tank, and the black ink in the container was held by the source holder and the fNIRS probe was fixed from the bottom side of the phantom……… 32 Figure 5.3: The illustration of the sheet that similar to the probe position. The
red colours are the transmitting probe while the blue colours are the receiving probe. The ‘x’ marks are the Polaris marker position that placed randomly in between of the probe. These markers are used as the reference markers to transform into PET
coordinate………. 33
Figure 5.4: The position of the Polaris and fNIRS-PET phantom during the fNIRS measurement. The sheet consist of Polaris markers was placed facing the Polaris……… 34
ix Figure 5.5: The position of the Polaris and fNIRS-PET phantom during the
PET scan. The phantom was placed on the PET bed and the Polaris read the Polaris marker position in the phantom……….. 35 Figure 5.6: a) The Na-22-point source which surrounded by three Polaris
markers, and placed on the adjustable tool and b) the set-up of the calibration experiment where Polaris read the markers around the source and the gantry markers………. 36 Figure 5.7: The Illustration of the general idea of the transformation flow of
the phantom. The probes on the phantom should be transformed to Polaris coordinate beforehand transformed to CPET, while the Polaris markers were transformed directly to CPET……… 37 Figure 5.8: The illustration of the actual flow of the transformation done on
the phantom. The probes were transformed to Polaris coordinate 1 (during fNIRS) and the Polaris coordinate 2 (during PET scan) beforehand transformed to CPET. The Polaris markers were transformed directly to CPET………. 38 Figure 5.9: The bar graph of the precision test of marker coordinate of the
three different positions. All markers show less than 0.07mm…. 40 Figure 5.10: The bar graph of the accuracy test of marker coordinate in the
x-axis comparison of the three different positions……… 41 Figure 5.11: The signal during the fNIRS measurement. The black ink
container was moved towards the bottom on channel 6 and give a higher signal which is shown by the red colour signal on
channel 6………. 42
Figure 5.12: The fusion image on the source on channel 6, the probe and the Polaris markers image. The blue ‘dot’ is the probes; the white ‘dot’ (appointed by the arrows) are the markers while the red ‘dot’ is the source………. 43 Figure 5.13: The illustration of the probe position, the channel number and
the Polaris markers position. The source is marked on channel 6 (appointed by the arrow)……….. 43 Figure 6.1: The process to register the fNIRS on PET image. The fNIRS
measurement is undergoing a transformation process beforehand register on PET image………... 46 Figure 6.2: The schematic timeline of the entire study protocol as the subject
arrived at the centre until finished the PET scan. The FDG-18 was injected after the fNIRS set up prior to the fNIRS examination. The whole procedure took 2 hours and 30 minutes. 48
x Figure 6.3: The procedures to fix the cap on the subject. Three Polaris
marker was attached on the fNIRS cap and fixed on the subject head, then the probes coordinate was determined using a magnetic probe. After that, the probes were fixed on the relative holes on the cap and finally, the subject is ready to perform the
fNIRS task………. 49
Figure 6.4: The schematic diagram of the back-to-back challenges. The subject must determine the match illustration which is presented before the previous illustration……….. 50 Figure 6.5: The schematic diagram shows the Stroop task. The subject must
decide whether the “actual colour” of the character presented in the upper position matched or mismatched the “meaning” of the character presented in the lower position………. 51 Figure 6.6: The schematic diagram for each of the fNIRS task cycle. Each
task took 60 seconds after 20 seconds pre-resting period and followed by 20 second post resting period……… 51 Figure 6.7: a) Illustration of the Polaris and subject set up. The Polaris placed
in between CT and PET gantry and connected to a personal computer system for the data recording. b) The position of the subject head as well as Polaris. Three Polaris markers are attached to the cap and three markers on PET gantry………….. 52 Figure 6.8: The Na-22-point source at the centre of three Polaris markers and
mounted on the adjustable tools. The Polaris tracked the position of the markers that used to calculate the source
coordinate………. 53
Figure 6.9: Illustration of the entire flow of the transformation process. The 30 probes were transformed to Polaris coordinate beforehand transformed to CPET, while the Polaris markers were transformed directly to CPET……….. 54 Figure 6.10: The 3D image of a) fNIRS probe and Polaris marker in CPET, b)
the probe and markers on the 3D image of PET brain and c) the probe and markers on the brain surface. The blue dots represent the probe whereas the red dots represent the Polaris marker…… 56 Figure 6.11: The graphs of the transformation matrix error of each subject.
Three subject shows error more than 1mm while one subject which is subject 8 shows higher error up to 10mm error………. 57 Figure 6.12: The fNIRS signal during the task. The red signal is the oxy-Hb,
xi oxygen in the blood. The signal can be seen clearly on each channel of measurement………..
58
Figure 6.13: The activation area during the fNIRS task on the standard MRI brain image. The significant channel data are superimposed onto the standard magnetic resonance imaging brain template images which are done by fNIRS-SPM……….. 58 Figure 6.14: The fusion image of the fNIRS probe on the PET image. a) The
PET image of the brain b) the probe image in PET coordinate and c) the PET image registered with the probe image………… 59 Figure 6.15: The activation area based on fNIRS task, which observed on PET
image. The red colour shows the activation area during the fNIRS task. a) The activation area during the first task, b) The activation area during the second task and 3) The activation area during the third task……….. 60
xii
Abbreviations
fNIRS functional Near Infra-red Spectroscopy
PET Positron Emission Tomography
CT Computed Tomography
MRI Magnetic Resonance Imaging
fMRI functional Magnetic Resonance Imaging
SPECT Single Photon Emission Computed Tomography
EEG electroencephalography
SPM Statistical Parametric Mapping
FDG-18 18-Fluorodeoxyglucose
PC Personal Computer
CBV Cerebral Blood Volume
CBF Cerebral Blood Flow
xiii
Nomenclature
CfNIRS fNIRS coordinate
CPOL Polaris coordinate
CPET PET coordinate
PfNIRS (x, y, z) 3D probe position in fNIRS coordinate
PPOL (x, y, z) 3D probe position in Polaris coordinate
PPET (x, y, z) 3D probe position in PET coordinate
MfNIRS (x, y, z) 3D marker position in fNIRS coordinate
MPOL (x, y, z) 3D merker position in Polaris coordinate
MPET (x, y, z) 3D marker position in PET coordinate
TfNIRS – POL Transformation matrix from fNIRS to Polaris
1
Chapter 1
Introduction
In medical imaging technology today, multimodal images are gaining attention among
medical practitioners to enhance their understanding of diagnosis the medical images.
Multimodal imaging is the integrated system from two imaging modalities or
combination of two imaging system that acquired an image of the same patient. The
important criteria that need to be considered when using multimodal imaging are the
registration of the multimodal images. There are several methods of medical image
registration and each of them presents a specific benefit for better medical imaging
outcome.
This PhD project is focused on the registration of information from two powerful
neuroimaging tools; functional near-infrared spectroscopy (fNIRS) and positron
emission tomography (PET). This first chapter discussed the medical image registration
in general, the image registration methods, the main objective of this PhD project and
the structure of the thesis.
1.1 Medical image registration
Calvin Maurer (1993) defined the image registration as the determination of one-to-one
mapping between the coordinates in one space and those in another such that points in
the two space that correspond to the same anatomical point are mapped to each other
(Fitzpatrick, Hill, & Maurer, 2004). The image registration is to align the images with
respect to each other, match the corresponding images based on certain features, assist
2 corresponding points and can serve as input to a system further along in the image
acquisition (Fitzpatrick et al., 2004),(El-Zahraa, et al, 2015)
Nowadays, many imaging modalities available in diagnostic radiology such as
computed tomography (CT) and magnetic resonance imaging (MRI) while in nuclear
medicine there is nuclear imaging technique such as single-photon emission computed
tomography (SPECT) and positron emission tomography (PET). Each of these imaging
modalities has its purpose, specialities and drawbacks. To optimize the advantages and
specialities of these single imaging modalities, many researchers concerned to register
images of the same patient from different modalities to expand the anatomical and
physiological information.
There are two types of the medical image; 1) functional images such as a
physiological image from PET, SPECT or functional magnetic resonance imaging
(fMRI) and 2) structural images such as an anatomical image from MRI and CT.
Normally, the registration image is between the integration of the structural and
functional image to impose a structure anatomical image on the functional image. Most
common multimodal image registration is to view both functional and anatomical
information of one patient in one image such as PET-MRI, PET-CT, and SPECT-CT.
The integrated multimodal imaging system already manufactured with image fusion
software. Such in figure 1.1, the example of a fusion image from an integrated PET-CT
system, whereas in figure 1.2, the example of a fusion image from integrated
3
Figure 1.1: The example of whole-body 18-fluoride-fluorodeoxyglucose (18F-FDG) PET-CT scan fusion image to study primary pleural synovial sarcoma. Image retrieved from (Natrajan, Harisankar, John, & Gangadharan, 2015)
Figure 1.2: The example of an image from integrated SPECT-CT. This image is the transverse and coronal images of a patient's SPECT-CT fused data sets including the three lower lumbar vertebrae. Image is retrieved from (Cachovan, Vija, Healthineers, Hornegger, & Kuwert, 2013)
Each imaging modality not only offers complimentary advantages and not only
has unique asset but also has a problem of insufficient sensitivity or spatial resolution,
which limit its ability to obtain reliable and accurate information at a disease site.
Therefore, merging one modality from anatomic imaging and another from functional
imaging is not always required, then the multimodal imaging is usually designed to fuse
anatomical information with better spatial resolution and biological information at the
4 combination of the images can lead to additional information that does not appear in a
single image.
1.2 Methods of medical image registration
Most of the existed integrated system such as PET-CT and PET-MRI do not need image
registration as they acquired the image simultaneously and those images share the same
coordinate. However, this integrated system has disadvantages such as their cost
installation is high and some other hardware restriction. For separate modalities, image
fusion can be done by register the images together. There are two methods of image
registrations; software-based registration and hardware-based registration. The
software-based is the registration using computer software to register the image even
though the image is from different imaging modalities such as SPM (statistical
parametric mapping) and FSL which is developed in Oxford UK. The other method is
hardware-based registration use an external device to determine the transformation
function. The popular method is software-based registration because only need a
computer, but the result is highly depending on the image quality, and the chosen
algorithm. The hardware-based registration is fast and accurate, but it needs special
hardware and the internal structure may not be correctly registered due to motion and
non-rigid deformation.
1.3 Objective
This PhD project is aimed to register the two imaging modalities that are very powerful
for neuroimaging, functional near-infrared spectroscopy (fNIRS) and PET. fNIRS is the
5 brain activities. fNIRS is very advantageous to measure the cerebral hemodynamics
during brain activation and it has a good temporal resolution, but it only measures the
oxygen changes in the cortex region. Therefore, many researchers combined or
compared the fNIRS result with information from other modalities. The fNIRS result
frequently compares with blood-oxygen-level-dependent (BOLD) fMRI as the BOLD
response in fMRI is related to deoxyhemoglobin (Gervain, 2015)(Cui, Bray, Bryant,
Glover, & Reiss, 2011; Duan, Zhang, & Zhu, 2012; Heinzel et al., 2013; Kleinschmidt
et al., 1996; Magnotta, Buss, Huppert, Spencer, & Wijeakumar, 2016; Sato et al., 2013).
Other than that, fNIRS monitoring also measured along with the PET scan to study the
cerebral oxygen and cerebral blood flow during brain activation (Polinder-Bos et al.,
2018; Rostrup, Law, Pott, Ide, & Knudsen, 2002). Therefore, it would be very beneficial
if fNIRS signals can be view on another medical image. To do that, the registration of
fNIRS with other modalities must be established.
PET is a nuclear imaging technique that used radioactive to image the functional
state inside the human body. Both techniques fNIRS and PET, have their advantages
and disadvantages. fNIRS has high temporal resolution while the PET image has a
better spatial resolution (Chou & Lan, 2013). fNIRS also is a relatively non-invasive
technique, inexpensive compared to other modalities, safe in term of radioactive usage
and portable. fNIRS is completely silent, providing a non-intrusive environment and
allowing for an easy presentation of auditory stimuli (Gervain, 2015). However, the
depth penetration of light in fNIRS is very low, therefore fNIRS only measures
haemoglobin concentration on the cortex region rather than in deeper brain structures
(Gervain, 2015) (Huppert, Diamond, Franceschini, & Boas, 2009). Thus, brain
structures that lie deeper in the cortex or below it are not visible using fNIRS techniques
6 Therefore, by registering the fNIRS data on PET image, it can optimize the
advantages of fNIRS and PET and improvise the specificity of the information given
by both methods. Thus, this thesis describes how the process of registration of fNIRS
on PET image using hardware base registration.
1.4 Structure of the thesis
Chapter 1 introduces the medical image registration in general, the aim of this PhD project and the structure of the thesis.
Chapter 2 provides the background of the study including the basic principle of fNIRS and PET, the literature review of fNIRS and PET from previous study and an overview of multimodal fNIRS with fMRI and EEG.
Chapter 3 and chapter 4 discussed the imaging modalities and optical tracking system used in this study and explain the theory of the proposed registration method.
Chapter 5 describe the validation experiment using a special phantom to validate the transformation and registration methods from fNIRS to PET.
Chapter 6 describe the registration method to perform on a human volunteer.
7
Chapter 2
Study background
2.1 Introduction
fNIRS is one of the recent developments in neuroimaging technologies and widely used
to visualize brain activity (Villringer, Planck, Hock, Schleinkofer, & Dirnagl, 1993). It
uses near infra-red light for measuring changes in blood oxygenation during cerebral
activity. Since the discovery fNIRS by Jöbsis in 1977 (Ferrari & Quaresima, 2012),
standalone fNIRS has been used in many brain studies to understand in detail the
changes of oxygen based on brain activities under different state either clinical or
non-clinical condition. The fNIRS result often compared to functional magnetic resonance
imaging (fMRI) as fMRI also measure the changes in blood oxygen. Many studies also
combined fNIRS and electroencephalography (EEG) since both are scalp-imaging
technique and normally the comparison is in term of oxygen changes and electrical
signal in the brain during activities. In addition to fMRI and EEG, the combination of
fNIRS-PET also used to get a better understanding of brain physiology.
PET is a nuclear imaging technique that uses injected radioisotope to visualize
the functional state of the human body. PET is always been known for imaging the
physiology of glucose consumption of the human body using FDG-18, but nowadays
PET plays an important role in neuroimaging such as in neurodegenerative disorders,
movement disorders, and neuropsychiatric conditions (Slough, Masters, Hurley, &
Taber, 2016). PET is very useful in clinical since it can contribute to differential
diagnosis, early diagnosis, monitor the efficacy of therapeutic and alter clinical
management (Slough et al., 2016). As PET image is a functional image, it usually
8 in order to get a better understanding of the physiological state along with the
anatomical part. Besides that, in the most clinical and non-clinical study, PET is often
combined with fMRI which also give a functional image in order to obtain more info
on the physiological state of the human body.
Recently combination fNIRS-PET is getting attention, and both have their
strength and limitation. Hence, this chapter is to discuss the background study, describe
the basic principles of the fNIRS and PET. this chapter also includes the literature
review regarding fNIRS-PET from previous study and the end part of this chapter is a
mini-review on the fNIRS combination with other modalities.
2.2 Functional Near-Infrared Spectroscopy (fNIRS)
fNIRS is one of the neuroimaging techniques used to understand brain function in
psychiatric and neurological disorder. fNIRS is the optical imaging technique that used
near infra-red light to measure the changes of oxygen in blood flow. The functional
state of tissue can influence its optical properties. As the human brain responds to
environmental stimuli, it undergoes several physiological changes; these changes in
blood levels and electrochemical activity also affect its optical properties. Functional
optical imaging capitalizes on the changing optical properties of these tissues by using
light in the near-infrared range to measure physiological changes (Huppert et al., 2009)
(Irani, Platek, Bunce, Ruocco, & Chute, 2007). fNIRS can detect changes in the
concentration of oxygenated and deoxygenated haemoglobin in the blood (León-carrión
& León-domínguez, 2012). The change in hemodynamic response is a good marker for
assessing neural activity since the oxygenated level is dependent on brain activities and
9 Tamura, 1993). fNIRS measured the oxygenated level of blood, which similar to the
blood-oxygen-level-dependent (BOLD) technique in fMRI. Nevertheless, the beauty of
fNIRS is it can detect the oxygenated changes while the subject is doing an activity. In
view of the fact that fNIRS is task-related, there are many studies done involves fNIRS
measurement while doing a specific task such as an exercise using muscle (Nielsen,
Boesen, & Secher, 2001) (Perrey, 2008), playing a video game system (Karim, Schmidt,
Dart, Beluk, & Huppert, 2012), cycling (Piper et al., 2014), and verbal fluency task
(Takahashi et al., 2011), (Arai. H et al., 2006).
fNIRS consist of two probes: emitting and receiving probe (figure 2.1). The
emitting probe emits the infrared light while the receiving probe act as a detector to
detect the reflecting light from the oxygenated blood. Most biological tissues are
relatively transparent to the near-infrared range between 700–1000 nm, largely because
haemoglobin absorption and water absorption are relatively small at these wavelengths.
This spectral band is often referred to as the ‘‘optical window’’ for the non-invasive
assessment of brain activation. Photons introduced at the scalp pass through most of the
tissue, and are either absorbed, scattered, or reflected from oxy-Hb and deoxy-Hb.
Changes in the chromophore concentrations cause changes in the reflected light
intensity and are quantified using a modified Beer-Lambert law. By measuring
absorbance reflectance changes at two (or more) wavelengths, one of which is more
sensitive to oxy-Hb, the other to deoxy-Hb, changes in the relative concentration of
10
Figure 2.1: The illustration of the emitting and receiving probe of fNIRS. The light travels in banana shape through the cortex region and detected by the receiving probe.
2.3 Positron Emission Tomography (PET)
PET is the imaging of radioactive that injected into the human body to view the
metabolic processes inside the human body. PET is based on the detection on pairs of
the coincidence gamma-ray that coming out from the human body. The injected
radioactive is a positron emitter where it will produce positron as it interacts with tissue.
This positron will then interact with electron over annihilation process and produce two
annihilation gamma rays. These annihilation photons carry the same energy 511 keV
and travel in the opposite direction. They strike opposite detectors nearly
simultaneously and the detection of these two photons will count as a true coincidence
event. The scintillator detector converts the 511 keV photon to light, which is detected
by the attached photomultiplier tubes. The path between the two detectors hit in
coincidence is termed the line of response (LOR). This is critical for the accuracy of the
PET scan because the LOR provides additional information regarding the position of
the coincidence event compared with single-photon imaging. An image reconstruction
11 radiotracer reflects the functional process (Slough et al., 2016). Spatial resolution is
typically 5 to 10 mm.
The radioactive use in PET imaging is tagging with a biological compound
known as a tracer. The tracer labelled with a positron emitter isotope either 11-C, 18-F
or 15-O (Tai & Piccini, 2004). These tracer compounds can then be used to track
biochemical and physiological processes in vivo for example, 18F-2-deoxyglucose
(18-FDG) is used to investigate cerebral glucose metabolism, whereas H2O15 is used to
examine cerebral blood flow (Tai & Piccini, 2004). One of the main reasons for the
importance of PET is the existence of positron-emitting isotopes of elements such as
carbon, nitrogen, oxygen and fluorine, which may be processed to create a range of
tracer compounds, which similar to naturally occurring substances in the body. The
example of radionuclide that undergoes decay via positron emission is shown in table
2.1. (“Introduction to PET Physics: The physical principles of PET,” n.d.)
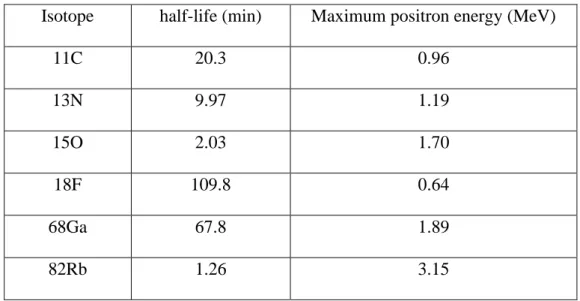
Table 2.1: The positron emission radionuclide that commonly used in PET
Isotope half-life (min) Maximum positron energy (MeV)
11C 20.3 0.96 13N 9.97 1.19 15O 2.03 1.70 18F 109.8 0.64 68Ga 67.8 1.89 82Rb 1.26 3.15
After the injection of a radiotracer, the radionuclide in radiotracer decays and
12 rays. The gamma-ray energy is 511 keV travelling in the opposite direction and these
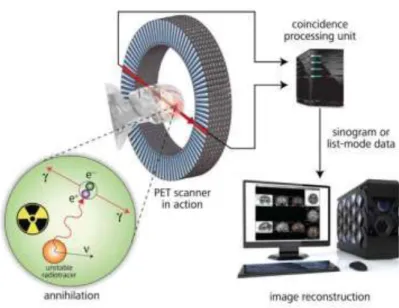
photons may be detected by detectors as a coincidence event. The idea of how PET
works are shown in figure 2.2.
Figure 2.2: The illustration of the principle of a PET imaging system. The annihilation photon will be detected the detector as a coincidence event and used to reconstruct PET image.
2.4 Literature review on the combination of fNIRS and PET
The combination of fNIRS-PET is getting attention, and both have their strength and
limitation. The combination of fNIRS and PET is relatively new and not so many
articles are published. However, these combinations have been extensively studied to
investigate deeper about blood haemodynamic in the brain. In brain imaging, fNIRS
and PET are both promising tools to study the oxygenation in the blood. Total
oxygenation haemoglobin (t-Hb) reflects the blood volume within the optical field,
where oxygen increases with an increase in cerebral blood flow (Yoko Hoshi & Tamura,
13 brain (Yoko Hoshi & Tamura, 1993)(Mintun et al., 2001). Mintun et al., performed O15
-PET study during visual activation and hypoxia to examine the relationship between
CBF and oxygen delivery. The finding shows that increase in CBF associated with
physiological activation is regulated by factors other than local requirements in oxygen
(Mintun et al., 2001) whereas Hoshi et al., 1993, demonstrated the used tissue
transparent near-infrared light to detect the specific region changes in haemoglobin
oxygenation state and blood volume during a mental task (Yoko Hoshi & Tamura,
1993). Hence, fNIRS and PET are a good possibility to localize and quantitation of
cerebral changes and brain activities based on CBF. Thus, the combination of fNIRS
and PET is used to compare both findings in order to study the cerebral blood flow. To
compare the blood oxygen level, H2O15-PET is suitable to be used. Rostrup et al.,
performed fNIRS study to quantify CBV changes measured by PET where the CBV
was measured simultaneously fNIRS-PET during the respiratory condition in
hypercapnia and hyperventilation and found the difference between the CBV obtained
by PET and fNIRS where PET CBV-changes was 3.5 larger than calculated by fNIRS
data. There is also a low correlation of the changes CBV-PET and CBV-fNIRS.
However, a combination of these two techniques in the neurophysiological events can
provide cover for the technique that suffers from specific limitation. For example,
fNIRS technique measuring cerebral blood volume (CBV) reported showing a lower
value than PET measurement. Since the CBV is also used in BOLD determination, there
is caution in using fNIRS values for its quantitative analysis across different modalities.
Cerebral hemodynamic measured by fNIRS-PET also become a parameter to
study other clinical condition. As in H. Polinder-Bos et al., fNIRS is used to monitor
cerebral tissue oxygenation and compare to CBF measured by 15O-H2O PET changes
14 changes in frontal cerebral oxygenation can identify changes in frontal CBF during
haemodialysis. fNIRS could be another option other than PET to detect intradialytic
CBF changes, but a correction factor may be needed to correct for the underestimation
of CBF changes by fNIRS (Polinder-Bos et al., 2018). fNIRS and PET both are
promising imaging tools for studying Alzheimer's disease. The earliest study on the
combination of fNIRS and PET was to study the cerebral haemoglobin and rCBF in AD
patient. Hock et al., demonstrated the used of simultaneous fNIRS-PET to study the
parietal cerebral haemoglobin oxygenation and regional cerebral blood flow (rCBF) in
AD patients and the result shows that AD marked a reduction of regional cerebral blood
flow and cerebral haemoglobin oxygenation during activation of brain function(Hock
et al., 1997).
fNIRS-PET also has been used to study the side effects of drugs. As in Kikuchi
et al., fNIRS-PET used to study the antihistamine side effect. The FDG-PET in the
relation of the blood glucose consumption was the first study to demonstrate the
sedative effect of antihistamine and compared to the haemodynamic response measured
by fNIRS. This study involves a double injection of FDG-18, where the first PET scan
is to obtain the baseline while the second PET scan is done after the drug administration
as well as the fNIRS measurement. The fNIRS and PET was separately done, fNIRS
cognitive activation task was performed after the drug administration and during the
second FDG-uptake duration. However, this fNIRS-PET finding is not compatible as
expected; the energy consumption in prefrontal regions measured by FDG-PET was
significantly increased after the antihistamine administration while the haemodynamic
response measured by fNIRS were significantly lower due to the pharmacological
15
2.5 An overview of multimodal fNIRS with other imaging modalities
Apart from PET, in order to compensate the strength and limitation of fNIRS, many
studies done to combine fNIRS with other imaging modalities such as functional
magnetic resonance imaging (fMRI), and electroencephalography (EEG). The
comprehensive information obtained from multimodal technique and the ease of using
the equipment are also the main factors for employing fNIRS with other modalities
(Hartwig et al., 2017; Wallois, Mahmoudzadeh, Patil, & Grebe, 2012). Hence, the
following discussion is the review on the study related to the multimodal fNIRS-EEG
and fNIRS-fMRI
2.5.1 fNIRS-fMRI
fMRI is the most common modalities combined with fNIRS. In brain imaging,
fMRI is used to visualise the active brain region. It is based on blood oxygen
level-dependent (BOLD) effect where it detects the blood oxygen level changes due to the
changes in neuronal activities. Whenever there is a high demand for oxygen to an area,
so the concentration of deoxy-Hb within tissue decreases. This decrease has a direct
effect on the signals used to produce magnetic resonance images since blood that
contains oxy-Hb is not very different, in terms of its magnetic susceptibility while
deoxy-Hb is significantly paramagnetic(Gore, 2003)(Gore, 2003). Thus, the fMRI only
related to the changes in concentration of deoxygenated haemoglobin (Gervain, 2015).
While fMRI signal is high due to the decrease of deoxy Hb and provides information
on oxygen in the blood, as deHb reduction is associated with the increase of
oxy-Hb. Therefore, fMRI detects the BOLD changes in MRI signal, which is high when the
brain is activated by stimulus or task because there are regional increases in CBF, and
16 non-invasive technique and produce high-resolution activation maps, make it as a
preferable choice to be used in brain study. However, fMRI also has a limitation, in
term of practical constraint and cost effectiveness. Due to the requirement of compatible
equipment and the restriction on movement in a typical supine position, limit the task
to be performed in the MRI scanner. The BOLD effect in fMRI is similar as in fNIRS
that measures the changes of oxy-Hb, deoxy-Hb and total Haemoglobin (total-Hb) in
blood. In comparison to fNIRS, fMRI would have a lower temporal resolution and
produce a large noise, which makes it uncomfortable for the patient doing the task.
Therefore, due to this limitation, many studies that combined fMRI with fNIRS to
improve the finding and get a better understanding of brain studies. The fNIRS signal
is said to be compatible with fMRI measurement parameter to study the CBF although
lack of deoxy-Hb response by fNIRS, still the signal physiology for the functional brain
could be mapping by fMRI and allow assessment of both constraints and practicability
of functional studies by fNIRS(Kleinschmidt et al., 1996). Other visual stimulation in
the healthy subject study by fNIRS, the haemodynamic respond measured by fNIRS
were consistent with fMRI(Maggioni et al., 2015). Another combination of fNIRS and
fMRI studies has been reviewed in Scarapicchia et al., 2017 and there are over 100
published articles using combined fMRI-fNIRS in brain function studies (Scarapicchia,
Brown, Mayo, & Gawryluk, 2017).
2.5.2 fNIRS-EEG
Another multimodal technique combined with fNIRS is electroencephalography (EEG).
fNIRS and EEG both are optical imaging technique based on scalp measurement
procedure. fNIRS measure hemodynamic changes during brain activation while EEG
17 multimodal approach has already been used to observe brain physiology during
language development, behaviour interaction, stimulus and auditory sensory
studies(Chiarelli, Zappasodi, Di Pompeo, & Merla, 2017; Ehlis et al., 2009; Merzagora
et al., 2009; Shin et al., 2018; Wallois et al., 2012). In EEG, an electrical readout during
neuron activation through voltage potential can be measured on the scalp(Wallois et al.,
2012). Since activation of neuron networks are well defined and can be traced to specific
stimuli, it gives rise to event-related potential (ERP) technique, where specific events
are related to brain EEG and used in studying brain activity phenomenon (Ehlis et al.,
2009). A multimodal approach using fNIRS and EEG allows the high spatial resolution
of fNIRS to be combined with good EEG temporal resolution while covering for EEG
low spatial resolution.
Although EEG is detecting the electrical signal from the neuron activation, the
slow voltage shifts recorded in the brain is said to correlate strikingly well with changes
in cerebral CBF (Vanhatalo et al., 2003). In the study done to prove this statement, the
direct current (DC) EEG was recorded from 12 subjects during 5 non-invasive
manipulations that affect intracranial hemodynamic and the DC shifted were compare
to changes in the CBV measured by fNIRS (Vanhatalo et al., 2003). The result shows
that the hemodynamic changes in the human brain are associated with marked DC shifts
that cannot be accounted for by intracortical neuronal or glial currents. Therefore, there
are some combine fNIRS-EEG studies are to compare the electrical response from EEG
and oxygenation in blood from fNIRS. A study done by Lin C. et al., they explore
multimodal physiological phenomena in response to driving fatigue through
simultaneous fNIRS and EEG recordings and the result reveal relationships between the
EEG power spectrum and the concentration levels of oxy-HB in the occipital region of
18 application of fNIRS-EEG already been seen in the area assessing of performance level
of the brain during a task with high working memory load and increasing being studied
for the usage of neurorehabilitation and proper pharmacy intervention plans during
brain injury rehabilitation(Chiarelli et al., 2017; Merzagora et al., 2009; Wallois et al.,
2012).
Although EEG has excellent capabilities of capturing action potential from
neuron cells at millisecond timeframe, the location of the activated cortical neurons are
unable to accurately point (Merzagora et al., 2009). This can be solved by having the
fNIRS optodes sensor targeting the same area as the EEG electrodes (Vanhatalo et al.,
2003; Wallois et al., 2012). The fNIRS detected changes to cerebral blood volume and
flow (CBV/F) in the brain already have shown to affect direct current shift and electrical
potential changes which can be detected by EEG (Vanhatalo et al., 2003). This allowed
metabolic active neuron cell, to be located. It also allows for neuron-related cells that
are invisible to EEG due to its closed field structure (e.g. basket cell, cortical stellate
cell, astrocytes etc.) to be arbitrarily detected and studies. These cells have local
vasodilation and vasoconstriction activities and are known to activate certain neuron
networks as they both have glutamate and GABA transporters which is important for
synapse activation (Wallois et al., 2012). Furthermore, by having co-registration of
hemodynamic and electrical activities of the neural networks, investigation of the brain
cognitive function from the ERP can be better understand with the physiological
metabolic data from the fNIRS (Chiarelli et al., 2017). Clinical application of
fNIRS-EEG already been seen in the area assessing of performance level of the brain during a
task with high working memory load and increasing being studied for the usage of
neurorehabilitation and proper pharmacy intervention plans during brain injury
19 Apart from the co-registration functionalities, there are other reasons for the
fNIRS and EEG multimodal usage. One of it is its advantageous aspect in clinical
application. Both fNIRS and EEG are non-invasive (e.g. no radioactive agent injection)
as it only required the sensor to be attached to the scalp of the patient. This is useful for
studies in neo-natal and young children because of their vulnerability to the chemical
agent and soft scalp tissues. The equipment is also mobile as it only requires a
multisensory helmet and it detectors for setup which allows for bed-side application and
does not require for patient immobilisation (Chiarelli et al., 2017; Wallois et al., 2012).
However, there are a few difficulties in this multimodal. Since signal acquisition needs
to be collected simultaneously, electrical noise artefact and movement from both
sensors may pollute the measurement readings (Wallois et al., 2012). There is also no
standard helmet mounted to accommodate two different types of sensors, it resulted in
different research groups employing their head-mounted model (Shin et al., 2018). This
cause reading to varies between each studies group. Moreover, the dataset from
NIRS-EEG is rarely open accessed thus hampered for any data comparison for validation or
benchmarking (Shin et al., 2018). Despite these, the advancement of technology has
produced various miniaturisation of sensors, robust helmet model and specific
mathematical algorithm that allows for filtering of artefact data (Wallois et al., 2012).
Furthermore, there is an increasing number of research group that willingly sharing their
20
Chapter 3
Imaging modalities and optical tracking system
3.1 Introduction
This study involves the registration image between two imaging modalities: PET and
fNIRS. Besides that, the registration also involves the uses of a hardware tracking
system, Polaris. Thus, this chapter will discuss the imaging modalities includes PET
and fNIRS in detail and the optical tracking system that has been used in this study.
3.2 Positron Emission Tomography (PET)
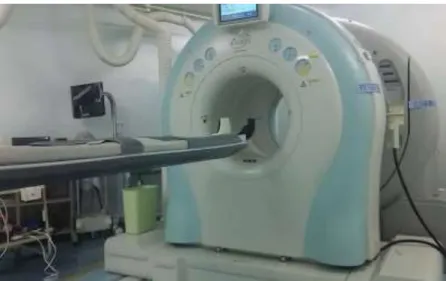
The PET scanner used in this study was Eminence STARGATE PET-CT scanner
(Shimadzu Inc., Kyoto, Japan) as shown in figure 3.1. This study only focuses on PET,
therefore only PET scanner was used instead of CT function. The scanning covered
only the brain part, which is about 5 minutes transmission scan for tissue attenuation
correction and 20 minutes emission scan.
Figure 3.1: The PET machine used in this study; Eminence STARGATE PET-CT scanner. This study only involves using a PET scan instead of CT-scan.
21
3.3 Functional near-infrared spectroscopy (fNIRS)
The fNIRS system used was FOREI 3000 system (Shimadzu Inc., Kyoto Japan). Figure
3.2 shows the fNIRS system that has been used in this study. This fNIRS system consists
of a console unit as shown in figure 3.2a, the transmitting probe that emits infrared light
at three different wavelengths (780, 805 and 830 nm) and the receiving probe which
records the reflected infrared light as in figure 3.2b. The probes are mounted on the
special fNIRS cap as in figure 3.2c. On the fNIRS cap, the probe is separated 3 cm apart.
Before fixing the probes in the corresponding holes, the 3D location of each hole will
be determined using Fastrack 3D magnetizer as in figure3.2d. Figure 3.3 shows the
fixed fNIRS probe on the fNIRS cap on the subject head. The probe must be fixed in
the right corresponding hole as determined by the system.
Figure 3.2: a) fNIRS system, which consists of a monitor and operating console b) fNIRS probes; emitting and receiving probe c) fNIRS cap with the hole to fix the corresponding probes and d) the Fastrak 3D magnetizer, which used to determine the probe location.
22
Figure 3.3: The example of fNIRS probe fixed on the cap and fitted on the subject head. The probe must be fixed in the corresponding hole so that the signal record as mapped in the system.
3.3 Optical tracking system; Polaris
The optical system used in this study was Polaris Vicra NDI as shown in figure 3.4.
Polaris is an optical tracking device used to track the orientation and location of the
Polaris markers. Polaris has two digital cameras that can emit infrared light and act as
a system sensor to receive the reflected light. The system sensor tracks the marker by
reflecting infrared light that reflected from the Polaris markers. The Polaris marker is
made of the material that can reflect the infrared light. The marker affixed to a tool or
object and based on the information received from the markers, the sensor Polaris is
able to calculate the 3D position and orientation of tools within a specific measurement
volume. Polaris provides precise, real-time spatial measurements of the location of the
marker within a defined coordinate system. The Polaris system can track multiple
markers simultaneously and the sampling rate is 20Hz. The system can be used in many
surgical applications, delivering accurate, flexible and reliable measurement solutions.
Two types of markers can be used in optical tracking: active markers and passive
23 electrical signal whereas passive marker is a retro-reflective marker that reflects the
infrared light from the Polaris. In this study, only passive markers were used. Two types
of passive Polaris markers used in this study, 1) ball type Polaris marker (figure 3.5)
which placed on the PET gantry and used as the references marker, and 2) sticker type
Polaris marker (fig 3.6). In this study, the sticker type markers were attached on the
fNIRS-PET phantom and the fNIRS cap and this type of marker ensured the position of
the markers is fixed during the transition from fNIRS room to the PET room.
Figure 3.4: The Polaris used in this study to track the 3D position of the Polaris markers within a defined coordinate system by emitting infrared light and detect the reflected infrared light from the Polaris marker.
24
Figure 3.5: The ball type, passive Polaris markers. The material of these markers can reflect the infrared light coming from the Polaris system.
Figure 3.6: The sticker type Polaris markers shown by red arrows. It is easier to stick on the curve surface, for example, in the picture; three sticker markers are attached on the fNIRS cap to determine the 3D position of the fNIRS channel on the cap.
25
Chapter 4
Theory of registration method
4.1 Introduction
fNIRS is the imaging technique that use near-infrared light to measure the changes of
oxygen in haemoglobin in the blood. fNIRS is the measurement using a probe that fixed
on the special cap. The changes in oxygen concentration measured by fNIRS are
presented in 2D signals and interpretation of oxygen level is according to the area of
the measurement channel. To register the fNIRS signals on the PET image, the probe
position must be transformed into the PET coordinate. Several criteria must be
considered for the transformation such as the fNIRS probe position, the measurement
channel, the gantry markers and the coordinate system. All the fNIRS properties that
must be considered is explained in this chapter. Other than that, the main focused of this
chapter is the theory of the proposed registration methods in term of the transformation
26
4.2 Consideration criteria for the transformation
4.2.1 The fNIRS measurement channel on the cap
The fNIRS probe is one of the basic parts of the fNIRS system. There are two types of
the fNIRS probe, emitting and receiving probe. As explained in the previous chapter,
both probes are mounted on the fNIRS cap and the probes must be fixed according to
the measurement plan that already mapping in the fNIRS system.
The emitting probe emits the infrared light and the reflecting light is detected by
the receiving probe which is located next to the emitting probe. The transmission signal
is propagated in the banana shape form explained in chapter 2. Therefore, the fNIRS
signal measured the area in between the emitting and receiving probe. In this study,
there are 14 emitting probes, 14 receiving probe and 43 measurement channels. The
illustration of the emitting and receiving probe is shown in figure 4.1. In the figure, the
red colour is the transmission probe while the blue colour is the emitting probe and the
yellow colour is the measurement signal channel.
Figure 4.1: The illustration of the emitting, receiving and the measurement signal channels. The red colour blocks indicate the transmitting probe and the blue colours blocks are the receiving probes while the numbers in the yellow colour blocks are the channel number.
27
4.2.2 The Polaris marker
In order to register the probe position on the PET image, the Polaris markers are used
as the reference points between fNIRS and PET, during both examinations. These
markers will be tracked by Polaris to determine the 3D position of the markers. To get
the position of the markers in both fNIRS and PET coordinate, the subject must wear
the fNIRS cap that already attached with the Polaris marker during both fNIRS and PET
measurement. Thus, the coordinate of these markers will be determined by Polaris
during both fNIRS examination and PET scanning. Therefore, the position of these
Polaris markers will be as references as they share the same coordinate. The idea of the
Polaris markers be as the references point to transform the fNIRS probe to the PET
coordinate is illustrated in figure 4.2. The minimum amount of Polaris markers should
be three since the transformation is done using 4x4 affine transformation. In the
validation study, four Polaris markers were used just to test the stability of the Polaris
reading.
Figure 4.2: The illustration of Polaris markers that used as the reference marker in both fNIRS and PET scan. Since the subject wears the same cap, the markers share the same coordinate in both fNIRS and PET measurements.
28
4.2.3 Gantry markers
During PET scanning, the Polaris is placed behind the gantry to track the Polaris marker
on the cap. At the same time, the Polaris also track the Polaris markers on the PET
gantry. The position of the gantry marker is illustrated in figure 4.3. Three Polaris
markers attached on the PET gantry which are used to calibrate the Polaris position
against PET gantry, so that the Polaris position does not have to be in the fix position
for each PET scanning.
Figure 4.3: The illustration of the Polaris markers on the PET gantry that used as the reference of the Polaris position so that the Polaris do not have to be in the fix position during each time measurement.
4.3 The coordinate system
This registration method involves three coordinates system. The first coordinate system
is the fNIRS coordinate (CfNIRS). All the measured probe position by Fastrack 3D
magnetizer is said to be in CfNIRS. The second coordinate system is Polaris coordinate
(CPOL) such the position of Polaris marker tracked by Polaris either during fNIRS or
PET scan is said to be in CPOL. The third coordinate system is PET coordinate (CPET).
In CPET, the PET image itself is said to be in CPET. To register the fNIRS probe on the
29
4.4 Proposed registration methods
To obtain the signal channels on the PET image, the position of the channel must be
transformed into the PET coordinate. The following is the theory of the transformation
and the registration method and the calibration experiment.
4.4.1 The transformation and registration
The main objective is to view the fNIRS signals on the PET image, so the main target
is to register the fNIRS probe on the PET image. Therefore, the fNIRS probe must be
determined in the PET coordinate (CPET) as shown in figure 4.4 below.
Figure 4.4: The illustration of the transformation of the fNIRS probe to the CPET. The coordinate
of the probe on the cap must be transformed into the PET coordinate in order to register the probe on the PET image.
The coordinate of the probe will be determined using the 3D magnetizer before
the fNIRS examination. The Polaris marker is attached in between the probe, therefore
by using the coordinate given by the 3D magnetizer, the coordinate of Polaris marker
can be calculated and get the position in fNIRS coordinate (CfNIRS). During PET
30 coordinate (CPOL). Therefore, by transforming the position of the markers from CfNIRS
to CPOL, we can get a transformation matrix fNIRS to Polaris, T1. Then, the probe
coordinate must be transformed to the to CPET by using transformation matrix T2 and
thereafter we get the position of the probe in PET coordinate. The transformation matrix
T2 from CPOL to CPET is obtained through the calibration experiment. The flow of
transformation is shown in figure 4.5. After getting all position in CPET, then the probe
can be registered on the PET image. The registration is done using in-house software
where the programming is build-up based on python.
Figure 4.5: The illustration of the transformation flow and registration. The probe coordinate must be transformed from fNIRS coordinate to Polaris coordinate and PET coordinate and then register on the PET image.
4.4.2 The calibration experiment
As mention in section 4.2.3, there are three Polaris markers on the PET gantry used to
calibrate the position of Polaris. These markers are used to determine the transformation
matrix from CPOL to CPET, T2. The calibration experiment will be performed for each
validation study and the human study to get the T2. The methods of calibration
31
Chapter 5
Validation study
5.1 Introduction
The propose registration method involves several transformations from CfNIRS to CPET.
The previous chapter explained the theory on how to get the fNIRS signals on the PET
image. In order to validate the registration methods, the same registration method was
performed on a phantom. Therefore, this chapter described the procedure of the
validation experiment which is done on a special phantom design for PET and fNIRS.
5.2 Objectives
The objective of the validation experiment is to validate the proposed registration
method. This validation of the registration method was performed on phantom that is
specially designed to be measured by fNIRS and PET. Therefore, the specific objectives
of this validation study are:
1) To determine the position of the fNIRS probe in the PET coordinate, CPET and
register on the PET image
2) To test the accuracy and precision of the transformation of the phantom from
32
5.3 Phantom set-up
This validation of the registration method was performed on phantom that is specially
designed to be measured by fNIRS and PET as shown in figure 5.1a. The phantom was
set up as in figure 5.2 to acquire fNIRS signal. The phantom was filled up with aqueous
lipid solution (figure 5.1b), the fNIRS probe was fixed from the bottom of the phantom
tank and the source holder hold the black ink or radioactive source throughout the
aqueous lipid solution filled in the phantom tank. The black ink such in figure 5.1c was
used in the fNIRS measurement while Na-22-point source was used for PET scanning.
(a) (b) (c)
Figure 5.1: (a) the fNIRS-PET phantom, which is special design phantom that can be used for both fNIRS and PET measurement (b) Aqueous lipid solution which uses as the medium for the fNIRS measurement and (c) the black ink which used to get the continuous signal during the fNIRS record.
Figure 5.2: The set-up of the fNIRS-PET phantom. The aqueous lipid solution was filled in the tank, and the black ink in the container was held by the source holder and the fNIRS probe was fixed from the bottom side of the phantom.
33 Four Polaris markers were placed on the phantom that will be detected by Polaris
detected during the fNIRS examination and PET scan. Because the fNIRS probes were
fixed from the bottom of the phantom, one sheet that exactly same to the probe position
was made and placed on the side of the phantom which facing the Polaris as in figure
5.3. Four Polaris markers were places in between the probe position randomly. Before
the fNIRS measurement, the coordinate of the fNIRS probe was determined using
Polaris pencil tracking.
Figure 5.3: The illustration of the sheet that similar to the probe position. The red colours are the transmitting probe while the blue colours are the receiving probe. The ‘x’ marks are the Polaris marker position that placed randomly in between of the probe. These markers are used as the reference markers to transform into PET coordinate.
5.4 Methods
The measurement was divided into three parts.
1. fNIRS and Polaris measurement
2. PET and Polaris measurement.
34
5.4.1 fNIRS and Polaris measurement
Figure 5.4 below shows the position of Polaris and fNIRS-PET phantom position during
the fNIRS measurement. The fNIRS measurement was made where the black in was
positioned on channel 6. The fNIRS signal was recorded as the container holder is
moved towards the bottom on channel 6. In the same time, Polaris measured the position
of the Polaris markers on the side of the phantom. In order to test the precision of the
transformation at different phantom positions, this measurement was repeated for
another two positions of the phantom where; first, the phantom was moved 5 cm to the
right and second, 5 cm towards the Polaris.
Figure 5.4: The position of the Polaris and fNIRS-PET phantom during the fNIRS measurement. The sheet consist of Polaris markers was placed facing the Polaris.
35
5.4.2 PET and Polaris measurement
After the fNIRS measurement, the phantom was brought to the PET room and
positioned on the PET bed and Polaris markers facing the Polaris. Figure 5.5 shows the
position of Polaris and fNIRS-PET phantom position during the PET scanning. The
black ink container was replaced with the Na-22-point source and positioned the holder
on top of channel 6. In the same time, Polaris read the position of the markers during
PET scan. Three PET scans were made where each scan corresponds to the position of
the phantom during fNIRS. In the same time, Polaris read the position of the markers
during PET scan.
Figure 5.5: The position of the Polaris and fNIRS-PET phantom during the PET scan. The phantom was placed on the PET bed and the Polaris read the Polaris marker position in the phantom.