Export-Led Growth and Geographic Distribution
of the Poultry Meat Industry in Brazil
著者
Ueki Yasushi
権利
Copyrights 日本貿易振興機構(ジェトロ)アジア
経済研究所 / Institute of Developing
Economies, Japan External Trade Organization
(IDE-JETRO) http://www.ide.go.jp
journal or
publication title
IDE Discussion Paper
volume
67
year
2006-08-01
INSTITUTE OF DEVELOPING ECONOMIES
Discussion Papers are preliminary materials circulated to stimulate discussions and critical comments
Keywords: Brazil, poultry meat, regional development, clusters JEL classification: C19, N56, O13, R12
* Research Fellow, International Economics Studies Group, Development Studies Center, IDE ([email protected])
DISCUSSION PAPER No. 67
Export-Led Growth and Geographic
Distribution of the Poultry Meat
Industry in Brazil
Yasushi UEKI*
August 2006
AbstractThis paper includes an examination of the sustainability of recent high growth in the poultry meat industry in Brazil. In addition, an assessment is made of the impact of increased production of poultry meat products on the development of local industries. Comparative studies of leading companies in the United States, Mexico, and Brazil reveal competitive advantages in the low costs of feedstuff and labor as well as disadvantages in the scale of business and management efficiency in the Brazilian poultry sector. Increases in domestic and foreign demand for Brazilian poultry meat have promoted development of the Brazilian poultry sector in local areas. The formation of industrial clusters is observed using regional data related to the location of slaughterhouses and the number of chickens farmed. Statistical analyses support observations made in this paper.
The Institute of Developing Economies (IDE) is a semigovernmental, nonpartisan, nonprofit research institute, founded in 1958. The Institute merged with the Japan External Trade Organization (JETRO) on July 1, 1998.
The Institute conducts basic and comprehensive studies on economic and related affairs in all developing countries and regions, including Asia, Middle East, Africa, Latin America, Oceania, and Eastern Europe.
The views expressed in this publication are those of the author(s). Publication does not imply endorsement by the Institute of Developing Economies of any of the views expressed.
INSTITUTE OF DEVELOPING ECONOMIES (IDE), JETRO
3-2-2, WAKABA,MIHAMA-KU,CHIBA-SHI
CHIBA 261-8545, JAPAN
1. Introduction
Traditionally for developing countries, natural resource-based products are one of the major export items and sources of foreign exchange. However, unexpected fluctuations or long-lasting slumps in market prices often damage developing economies that chiefly depend on revenues from a limited number of primary commodities. In order to cope with these problems, developing countries often introduce various policies to develop the manufacturing sector and promote exports of processed products derived from primary commodities.
Even though developing countries make progress in the growth of export-oriented manufacturing industries (including high-tech sectors), there are often serious gaps between large cities and outlying regions. Large cities experience growth driven by the process of industrialization and export promotion, while outlying regions are supported by natural-based sectors and local-based small businesses. At present, closing these gaps has become an urgent political matter, and development of local industries is given high priority in the agenda of many developing countries.
Developing countries have instituted a number of industrial policies for promoting high-tech industries. However, recent increased demand for and consequent price increases in natural resources have benefited developing countries, especially in South America (ECLAC 2004, 2005). In countries where the economy has depended heavily on primary resources, expansions in exports of natural resources have contributed to the growth of their national economies.
Under these conditions, the question arises as to whether or not the growth in exports of natural resource-based products will be sustainable, and whether or not increases in production of such export items will promote development of local industries. Even if there is a potentially large market, small businesses may have difficulty participating successfully. For example, small companies may not have the capability to meet hygiene control standards required by developed countries.
The above issues are examined in this paper through study of the Brazilian poultry meat industry. Section 2 concerns the world position of the Brazilian poultry meat industry and associated companies. Section 3 includes assessment of the structure of the poultry meat industry in Brazil, and a view of the geographic expansion of poultry production in Brazil is presented in Section 4. The final section includes a summary and conclusions.
2. Production of and Demand for Brazilian Poultry Meat
2.1 Increasing World Demand for Brazilian-Grown ChickenAccording to FAOSTAT, in 2004, Brazil was the third largest chicken meat producer in the world. It produced 12.7 percent of the world’s chicken meat. This followed the world production shares of the United Sates (22.7 percent) and China (14.5 percent). Table 1 shows a large gap between production in Brazil and in Mexico, the fourth largest producing country.
Larger concentrations may be observed in the export of chicken meat. For the first time in 2004, Brazil became the leading exporter and accounted for 33.2 percent of world chicken exports. The United States accounted for 32.1 percent. In total, these countries were responsible for 65 percent of world exports. On the other hand, exports from China accounted for only 1.4 percent (3.2 if exports from Hong Kong are included).
Rankings of chicken meat producing and exporting countries have gradually changed from around the year 2000 when Brazil stared increasing its exports (Figures 1 and 2). A part of this rapid growth may be due to depreciation of the national currency in the early 2000’s.1 Nevertheless, radical change followed the outbreak and spread of avian influenza that originated in East and Southeast Asia at the end of 2003.
An obvious impact of avian influenza was observed in chicken meat imports of Japan. Until 2003, Thailand and China were respectively the first and third largest chicken meat suppliers to Japanese consumers. In 2004, imports from these countries decreased sharply. Resulting shortages in the chicken supply were filled primarily by Brazil. The quantity of Brazilian meat exports to Japan doubled between 2003 and 2005. As a result, Brazilian products comprised 90 percent of chicken meat imports into Japan in 2005. Chile, the Philippines, Argentina, and Poland also increased exports to Japan (Table 2).
The Middle East, Asia, and the European Union are the major foreign markets for the Brazilian chicken meat industry. About 30 percent of Brazilian chicken meat exports (on a weight basis) were shipped to the Middle East. This was followed by 26.6 percent to Asia and 13.6 percent to the European Union (UBA 2005).
1
Annual average exchange rates [Brazilian real (R$) / US dollar (US$) – selling] were 1.8302 (2000), 2.3504 (2001), 2.9212 (2002), 3.0783 (2003), 2.9259 (2004), and 2.4352 (2005) (Source: IPEA, Banco Central do Brasil).
2.2 Production and Market Trends in Brazil
Views of the Brazilian poultry industry different from the above may be obtained if historical data is used and comparisons with other meat producing industries in Brazil are made. It appears that growth in chicken production was based on stable domestic demand and rapidly increased with external demand.
Production, Domestic Demand, and Export
Growth in chicken meat production in Brazil had been based on the rapid expansion of domestic demand in the 1990’s. Production, consumption, and export all grew at an annual rate of 9.9 percent between 1986 and 1999. During the same period, production rose by 241.7 percent; 208.0 percent was due to domestic demand and 33.8 percent to increase in exports (Figure 3).
From 2000 to 2005, production grew at an annual rate of 9.2 percent. Domestic consumption rose by 5.2 percent annually, and the annual average rate for exports was 25.7 percent. During these years, production increased 55.5 percent; 24.5 percent of this was due to consumption and 32.4 percent to exports (Figure 3).
Changes in the role of exports can also be seen in the percentage of exports relative to production. This ratio had ranged from 10 to 15 percent between 1986 and 1999. The export ratio passed 15 percent in 2000 for the first time and reached 30 percent in 2005.
Comparisons among Chicken, Beef, and Pork
During the past 20 years, the per capita consumption of chicken meat has grown at a higher rate than that of other meats. In 1986, the average Brazilian consumed 30 kilograms of beef, 10 kilograms of chicken, and 7 kilograms of pork. In 2005, the per capita consumption of chicken reached 35.4 kilograms, nearing the rate of 36.3 kilograms of beef consumption. The increase in pork consumption was more moderate than that of chicken (Figure 4).
During the last 10 years, chicken meat has been the most important export among meat products in both weight and value. The export value of chicken remained unchanged in the latter half of the 1990’s. It was 881 million US dollars in 1996 and 921 million in 1999. The figure reached 3,496 million US dollars in 2005. Exports of other meats also jumped, especially in the early 2000’s. As a result, the percentage of exports of chicken meat relative to total meat exports dropped from 73.6 percent in 1996 to 49.7 percent in 2005 (Figure 5).
3. Structure of the Poultry Meat Industry
In order to respond to increasing demands for the Brazilian poultry meat, it is necessary to establish the capability to have a sufficient supply. An efficient production system is also required for the Brazilian poultry meat industry to be competitive in the international market. This section examines production scale, supply chains, and comparative advantages of Brazilian companies.2
3.1 Characteristics of Major Brazilian Poultry Slaughterers
Brazilian Poultry Slaughterers in the Americas
Rapid expansion of poultry meat production enabled Brazilian companies to boost production capacities. As seen in Table 3, local companies in Brazil established a large production scale compared to companies in Latin America. Three leading Mexican companies also produced a comparably high number of broilers relative to Brazilian producers. However, two of the Mexican companies (Pilgrim’s Pride, Tyson) are actually from the United States. If the fact that the quantity of chicken meat production in Brazil was four times as large as Mexico is taken into account, the scale of Brazilian companies is not necessarily large.
The above is supported by a comparison of the poultry slaughter capacity of Perdigão, the second largest Brazilian company, and Tyson Foods, the top U.S. firm. Perdigão had a slaughter capacity of 10.2 million heads per week, while Tyson Foods could slaughter approximately 50 million per week in 2005. It is difficult to make direct comparisons of production capabilities of top companies in Brazil and the United States. However, it is possible to assume a difference in production scale between Sadia, the leading Brazilian company, and Tyson Foods. Sadia slaughtered 650.1 million heads of poultries in 2005 compared to Perdigão with 487.1 million during the same year.
In the following subsection, characteristics of the large Brazilian companies are examined in more detail. Specifically, Sadia and Perdigão are compared to leading United States and Mexican companies.
Major Brazilian Poultry Slaughterers in the Local Market
In contrast to situations in both Mexico and the United States, competition in the
2
Hamaguchi (1988) examined factors that determined development of the broiler industry from the perspectives of geographic environment and conditions of supply and demand.
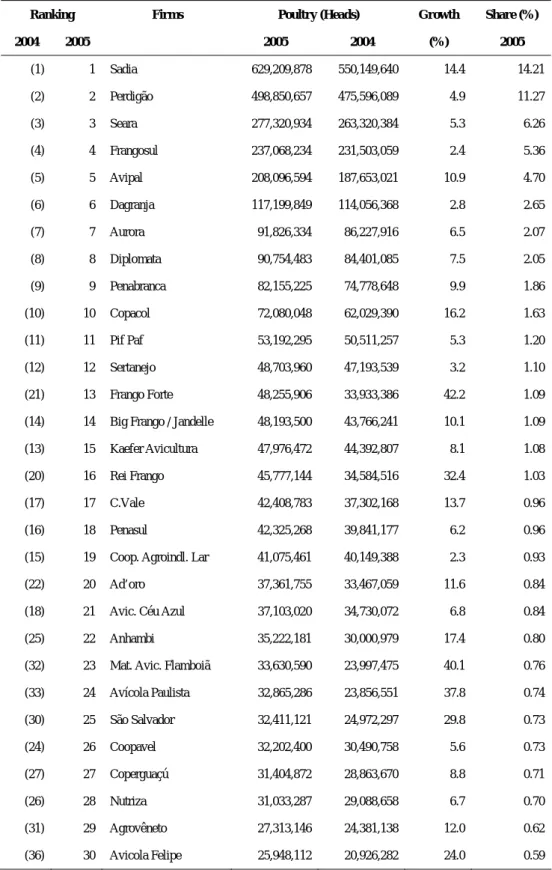
Brazilian poultry industry is strong. Only two Brazilian firms with poultry slaughterhouses had market shares of two-digits in 2005: Sadia with 14.2 percent and Perdigão with 11.3. Twenty major firms maintained more than one percentage each of the market share. However, the total shares of 50 companies did not reach 80 percent (Table 4).
Exporting companies are limited, and leading exporters take a larger share of total exports. Sadia exported 25.8 percent of total exports in 2005, followed by Perdigão (17.4 percent), Seara (12.4 percent), and Doux Frangosul (10.1 percent). The total share of these four companies accounted for 65.7 percent of total exports. Unlike production activity, 25 major exporting companies accounted for almost all exports (Table 5).
3.2 Integrated Supply Chain of the Poultry Business
The production of poultry products in Brazil is based on vertically integrated production systems. Sadia, founded as a wheat milling and hog-slaughtering firm in 1944 in the State of Santa Catarina, introduced such integrated production systems into Brazil. It did this when the company started poultry production and slaughter in 1961 (Tamai and Asaki, 2000).
In an integrated production system, large producers of poultry products own animal feed plants, hatcheries to produce one-day chicks, slaughterhouses, and distribution centers. They negotiate contracts with growers to raise commercial poultry. These large firms provide the integrated poultry farmers with one-day chicks and feedstuff as well as veterinary and technical support. This enables the poultry products industry to supervise poultry breeding. Growers that have been contracted are paid fees based on performance indicators such as bird mortality, feed to meat conversion ratios, and average weight. Fees paid to integrated farmers cover their production costs and net profits.
According to Sadia (2004 Annual Report), the company’s production process for poultry consists of four stages: The first two are for producing grandparent and parent stock that entail direct investment by Sadia. The third is related to the commercial stock of birds and involves integrated farmers. The last is the slaughtering process. Sadia imports eggs of grandparent stock from the United States to hatch in its hatcheries and raise newborn birds on its own farms. Perdigão purchases breeder chicks and eggs from Cobb do Brazil, an affiliate of Cobb-Vantress. This is a subsidiary of Tyson Foods (Perdigão Form 20-F for 2005). These birds produce parent-breeding stock raised on farms owned by Sadia. One-day chicks produced by the parent stock are supplied to
out-growers. The company has contracts with approximately 6,600 out-growers with no employment agreements. Most farm on a small scale and raise six flocks per year (each flock consists of approximately 14,000 chickens). It normally takes 36 days for out-growers to deliver grown chickens at a weight of 2.0 kilograms to Sadia’s slaughterhouses. The slaughtered birds are distributed to the consumer market as fresh meat or are used as raw material for processed products (Figure 6).
A similar integrated production system can be introduced by the production of eggs as well as turkey and pork meats. In practice, there are poultry slaughterers who also produce eggs, turkey, pork, beef, milk, and processed products. In the case of pork meat, major poultry meat exporting companies are also listed as important pork exporters. In 2004, Sadia exported 19.3 percent of the total volume of Brazilian pork. Figures for Perdigão and Seara were 17.4 and 17.2 percent respectively (Perdigão SEC Filing Form 20-F for 2004).
3.3 Comparative Advantages of the Brazilian Poultry Industry
Cost and Efficiency of Poultry Production
High growth in the Brazilian poultry industry in the 1990’s was supported by productivity improvements achieved by the introduction of foreign technology, low production costs, and increases in domestic and foreign demand (Tamai and Asaki, 2000).
Horne (2002) estimated total production costs, primary production costs, and processing costs of broiler meat for 1999. He did this in order to compare costs in France, the United Kingdom, Germany, the Netherlands, the United States, and Brazil. There were clear differences in production costs between the European and the two Non-European countries. Production costs in the United States and in Brazil were respectively 30 and more than 40 percent lower than those in Europe. Low costs in the United Sates and Brazil were attributed to low feed prices with local access to feed ingredients such as corn and soybeans as well as to low chick costs due to efficient integrated production. Labor cost is a major part of the meat processing stage, and Brazil had a strong advantage on a global basis. The favorable climate in Brazil helped to reduce housing costs.
There is also evidence regarding improvement in the production efficiency of Brazilian companies for the last 30 years. In the case of Sadia, during the period between 1975 and 2004, the market age (production cycle days) was shortened from 59.3 to 35.8 days, the slaughter weight of poultry was increased from 1.7 to 2.0
kilograms, and the feed conversion ratio (quantity of feedstuff required to produce one unit of meat) improved from 2.4 to 1.8 (Sadia 2004 Annual Report). Copacol, between 1983 and 2005, succeeded in improving the market age from 52 to 45 days, the average weight from 1,770 to 2,526 grams, and the feed conversion ratio from 2.260 to 1.852 (website of Copacol). The market age in the United States was 56 days in 1975, 53 days in 1980, and 44 days in 2005. The U.S. market weight increased to 1,705.5 grams in 1975, 1,782.6 grams in 1980, and to 2,381.4 grams in 2005. During the same years, the feed conversion ratio in the United States improved to 2.10, 2.05, and to 1.90 (Website of National Chicken Council). The mortality rate of chickens is necessary to evaluate production efficiency correctly. Though this was not taken into account, Brazilian companies seem clearly to have caught up with the United States broiler industry.
Performance at the Level of Firms
Financial data for 2004 (Table 6) is useful for comparing performance in the meat product businesses of Sadia and Perdigão to Tyson Foods and Bachoco, the leading meat product companies in the United States and Mexico respectively.
A marked difference in scale of business can be identified from sales volume. The operating revenue of Sadia was less than one tenth that of Tyson Foods. However, revenues of Sadia and Perdigão exceeded that of Bachoco. Total assets of Sadia are one fifth those of Tyson Foods. Indicators related to income, profit, and number of employees, also show how much smaller the scale of business of Brazilian meat products is compared with the top U.S. Company.
Lower production costs for the Brazilian meat industry may be implicitly observed from the ratio of cost of goods sold to operating revenue. Ratios for the two Brazilian firms were around 70 percent, while indicators for Tyson Foods and Bachoco were higher than 80 percent. Nevertheless, Brazil’s advantages seem to be eroded by inefficiency in management. The ratio of total operating expense to operating revenue in Brazil was close to 20 percent, and this was much higher than the 3.7 percent for Tyson Foods and 12.5 percent for Bachoco.
Fewer assets and less property coupled with smaller plants and less equipment per employee in Brazilian firms reflect the labor intensiveness of the Brazilian meat industry. In addition, they reveal the industry’s dependency on lower material costs to compete in the world market.
Some information based on segments is available to compare the poultry businesses of Sadia and Tyson Foods. Sales and operating revenue from poultry meat for 2005 were respectively 1,367 million and 115 million US dollars for Sadia. They
were 8,295 million and 582 million US dollars for Tyson Foods. The ratios of operating income to revenue were respectively 8.4 percent for Sadia and 7.0 percent for Tyson. Although the absolute value of profit performance for Sadia was smaller than that of Tyson Foods, it was not inferior (Table 7).
4. Geographic Expansion of Poultry Production
Some attention must be given to regional economic development. This is examined here with focus primarily on spatial distributions of poultry slaughterhouses and the number of farm-raised chickens. Indirect impact of growth in the chicken meat industry on the regional economy must be carefully investigated.
4.1 Location of Poultry Slaughterhouses
Historically, according to Tamai and Asaki (2000), the integrated production system was developed in the Southern Region and diffused nationwide. The two major meat producers, Sadia and Perdigão, were founded within this region in Santa Catarina. Similar to Sadia, Perdigão was founded in 1934 and started hog slaughtering in 1939. It began poultry slaughtering in 1955. These companies in the Southern Region set up operations and introduced the integrated production system to the Southeast where large cities such as São Paulo (SP) and Rio de Janeiro (RJ) were located. Historically, this was another center of chicken meat production. In the 1990’s, these slaughterers then expanded their operations into the Midwest Region in areas such as Mato Grosso (MT) and Mato Grosso do Sul (MS). This expansion was bolstered by the following factors: (1) availability of grains such as soybeans and corn, (2) low costs of land, labor, and feedstuff, (3) great potential for local demand, and (4) local governmental incentives for industrial promotion.
In order to show progress in the geographic expansion of slaughterhouses, the locations of 84 slaughterhouses owned by the 50 majorpoultry producers for 2004/2005 and listed in Table 4 (with years of their establishment), are illustrated in Figure 7 and mapped in Figure 8.3 Viewing Figure 7, it can be seen that early established
3
Data on the year of establishment was obtained from the SIGSIF (Sistema de Informações Gerencias do Serviço de Inspeção Federal) database of the Ministry of Agriculture (Ministério da Agricultura, Pecuária e Abastecimento) of the Government of Brazil. The database provides two types of yearly information related to slaughterhouses: (1) the date of reserve (Data de Reserva) and (2) the date of register (Data de Registro). An earlier date was used as a rough measure for the year of establishment. Data on slaughterhouses used for analysis in this paper are related to slaughterhouses owned by the 50 major producers. Data does not include all poultry slaughterhouses in Brazil or other meat processing plants. Thus, the production facility in the Federal District (DF) leased by Perdigão for poultry processing is not included. The national map can be divided into 5,560 administrative municipal areas.
slaughterhouses were located in the States of Paraná (PR), Rio Grande do Sul (RS) and Santa Catarina (SC) in the South. In addition, two waves of establishments appeared. During the first wave in the 1970’s, more slaughterhouses were established in the three states in the South and Southeast such as Minas Gerais (MG) and São Paulo (SP). Locations of these establishments were dispersed into the Midwest during the second wave in the 1990’s. Although states in the South and the Southeast remained important areas for chicken meat production, new slaughterhouses were opened in the Midwest such as in Goiás (GO), Mato Grosso (MT) and Mato Grosso do Sul (MS).
Figure 8 includes a map of these processes. The 84 slaughterhouses in this figure are located in 80 different municipalities. There are two concentrations of the slaughterhouses: (1) the area in the South between the northeastern part of Rio Grande do Sul and the southwestern part of Paraná, and (2) the area in the State of São Paulo. Figure 8 indicates that older slaughterhouses were established in these two areas, and newer slaughterhouses were built in the Midwest (GO, MT, and MS) after the 1990’s.
In 1997, Perdigão launched an investment plan called the “Expansion 2003 Plan”. During the period from 1997 to 2003, the company invested 399 million Brazilian real to construct “the Rio Verde Agroindustrial Complex” in Rio Verde in the State of Goiás. This complex is composed of feed mills and facilities for poultry and hog slaughtering and processing. Following the “Expansion 2003 Plan”, the company further expanded the Rio Verde Agroindustrial Complex in the period from 2004 through 2006.
Perdigão has also announced the construction of the new Agroindustrial Complex of Mineiros in the State of Goiás for poultry slaughtering and processing. This complex is expected to reach full capacity by December 2008. In the State of Mato Grosso, this company acquired Abatedouro Mary Loize in the municipality of Nova Mutum in June 2005 to meet the demand for chicken meat exports (Perdigão SEC Filings Form 20-F 2004, 2005).
In 2005, Sadia merged with Só Frango, a company based in Brasilia. Through this acquisition, Sadia strengthened its presence in the central area of Brazil, an area closer to raw material producers and to Brazil’s main centers of consumption. With its out-growers, Sadia also has a plan to invest in the State of Mato Grosso in the period from 2006 to 2009. The plan is to construct two poultry slaughterhouses, one in the city of Lucas do Rio Verde and the other in the city of Campo Verde (Sadia SEC Filings Form 20-F 2004, 2005).
4.2 Spatial Pattern of the Number of Raised Chickens
Production capacity of poultry meat was observed in the above subsection. Changes in the slaughter capacity have an impact on chicken meat production and the number of chickens grown in farms.
Change in the Chicken Meat Production by Federal Units
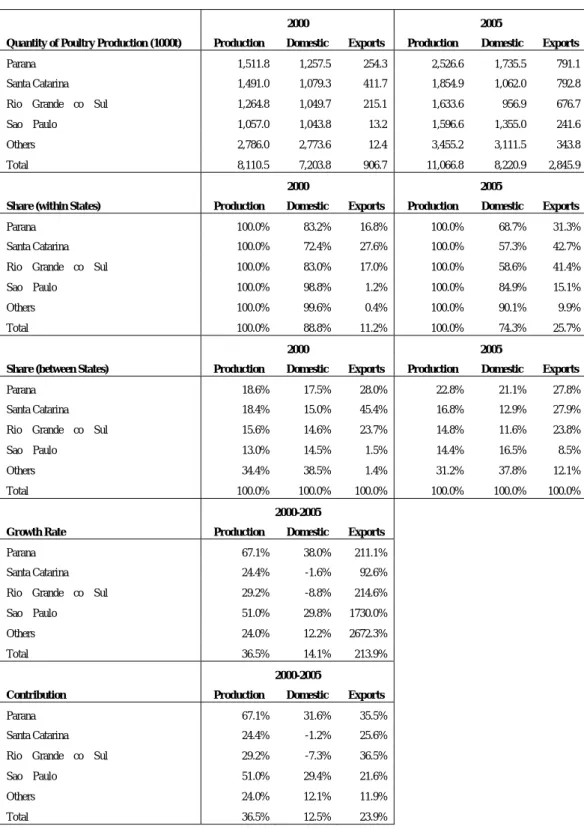
Regional distributions of poultry exports have changed in the last few years. As shown in Table 8, the States of Paraná, Rio Grande do Sul, and Santa Catarina were responsible for about 50 percent of the total production, and they accounted for 97 percent of the total exports from Brazil in 2000. Although national share of the production of these three states in the South remained at about 50 percent, Santa Catarina’s share in exports dropped dramatically from 45.4 percent in 2000 to 27.9 percent in 2005. However, during the same period, regional shares in total export increased from 1.5 to 8.5 percent for São Paulo and 1.4 to 12.1 percent for the rest of the states.
Facing increases in demand from home and abroad, the Southern States pursued export-led growth and took advantage of their ample experience in transactions with the market abroad. Between 2000 and 2005, Santa Catarina achieved a growth rate in production of 24.4 percent.4 Of this, domestic shipments contributed -1.2 percentage points; shipments abroad accounted for 25.6 percentage points. Rio Grande do Sul depended more on exports. While the state achieved a 29.2 percent increase in production, domestic shipments made a negative contribution of 7.3 percent points. The positive contribution of exports (36.5 percentage points) counteracted the negative impact of domestic shipping. In other states, contributions of domestic and foreign shipments were more balanced. As a result, although 83 percent of total production in Rio Grande do Sul was shipped to domestic markets, the percentage dropped to 58.6. São Paulo’s high ratio of 84.9 percent of production was distributed within Brazil.
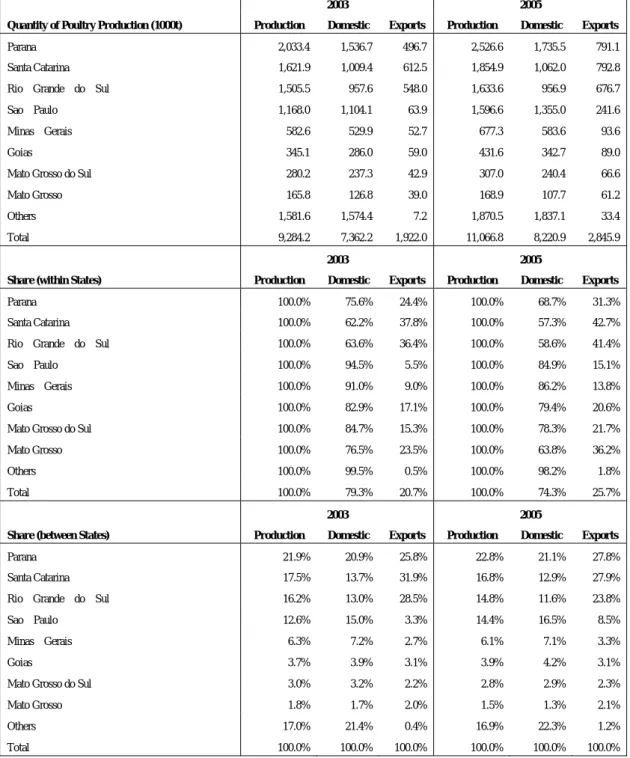
Similar to Table 8, Table 9 provides information for the years 2003 and 2005; national production is further classified into states of the Midwest. Table 9 shows that domestic shipments contributed to growth in production in São Paulo and its neighbor states (GO, MG). The contribution of exports was more important in states of the South and in newly developing grain-growing regions (MS, MT). For example, in the State of Goiás, 25.1 percent growth in production was realized; the contribution of domestic shipments was 16.4 percent and that of exports was 8.7 percent.
4
Per-head weight of chicken was assumed to be 2.5 kilograms in order to convert the number of heads into the weight of production.
Data shown above indicates that the Southern Region still maintains a comparative advantage as a base of operations for export. This region seems to have a better logistic infrastructure and appears to be an important route for shipping meats produced in inland areas abroad. In practice, top exporting companies still invest in facilities within this region. Perdigão shipped 45 percent of its exports through the port of Paranaguá in the State of Paraná (where the firm owns refrigerated warehouses) and 35 percent through the ports of São Francisco do Sul and Itajaí in the State of Santa Catarina (Perdigão SEC Filing Form 20-F 2004).
Geographic Distribution of the Farm-fed Chickens
Again similar to Figure 8, data on the number and the increase in number of cocks, young chickens, and chicks (hereafter chickens in this subsection) for 2002 and 2004, are mapped in Figure 9. A layer of slaughterhouse locations, as drawn in Figure 8, is added. The geographic scope of the data includes 11 states in the Southern, Southeastern, and Midwestern Regions that are divided into 3,319 municipalities. Data related to the number of chickens is based on Produção da Pecuária Municipal (PPM) for 2002 and 2004.
Figure 9 shows that chicken farming is concentrated around the slaughterhouses of the 50 major slaughterers. Larger increases in the number of chickens are also distributed around these facilities. Although dimensions of the municipalities in the Midwest tend to be larger than those in the South and Southeast, there are fewer municipalities that breed larger numbers of chickens in comparison with regions in the South and Southeast. For this reason, in the following analysis, data on the number of chickens were not normalized (by dimension or population of municipality, for example).
In order to confirm geographic patterns in the distribution of number of chickens and their increase between 2002 and 2004, Moran’s I and local Moran’s I were calculated using GeoDa (Anselin et al, 2004). The spatial weight matrix used for these calculations is contiguity-based. For a specific municipality, its neighboring municipalities have a value of 1 or 0. Moran’s I assumes values between -1 and 1. If this measure is near 0, the data analyzed is randomly distributed. If values are near 1, similar values of the data, either high or low, are found together. If the value of Moran’s I is near -1, high and low values are interspersed. A large positive value for local Moran’s I for a specific municipality indicates that the municipality is surrounded by municipalities with similar values (Mitchell 2005, pp.121-4, 167).
for the increase between 2002 and 2004 were 0.28 and 0.07 respectively. This indicates that clustering of chicken breeding made some progress. The increase in farmed chickens appears randomly distributed. The LISA maps in Figures 10, 11, and 12 depict locations with significant local Moran statistics at the 5 percent level and provide a classification of those locations by type of association.
Maps for the number of chickens in Figures 10, 11, and 12 show that there are areas classified as “high-high” (municipalities with higher values are surrounded by others with higher values) in and around municipalities where slaughterhouses are located. Large clusters are especially found in the Eastern Rio Grande do Sul, the Western Santa Catarina and Paraná, the Southern Mato Grosso do Sul, and the State of São Paulo.
However, locations of high-high areas that are areas with larger increases in the number of chickens, do not necessarily coincide with the location of slaughterhouses or the spatial clusters of the number of raised chickens seen in Figures 10, 11, and 12. The high-high locations, or spatial clusters, revealed by the LISA map form the core of the clusters. Thus, if “high-high” areas in terms of increase in the chickens are located around spatial clusters of chicken breading, chicken farming clusters may be expanding spatially. Such distributions can be found, for example, in Eastern São Paulo depicted in Figure 12.
5. Concluding Remarks
Recently, the Brazilian poultry meat industry has benefited from increased demand for reliable meat supplies from the Northern Hemisphere as well as a preference of the Brazilian people for poultry meat. High growth in this sector has had a positive impact on the development of local industries.
As shown by LISA and other maps, there are industrial clusters formed by poultry meat producers in the South and in the Midwest (one of the most important grain-growing regions in the world), as well as in São Paulo (a major domestic market). Using their comparative advantages, the first two regions concentrate their production capacities on serving foreign consumers. Producers in São Paulo and neighboring states pay more attention to the local market in addition to overseas markets.
Rapid growth in production and export of poultry meat products indicates a bright future for the Brazilian poultry meat sector. However, some doubt still remains about the sustainability of such rapid growth. A key issue may be the cost competitiveness of Brazilian companies. Accounting data shows that the
competitiveness of Brazilian companies may come from the low price of homegrown grains and lower labor costs. Brazil does not have a strong comparative advantage in labor cost if its legal minimum wage is compared with its competitors (in 2005, 300 Brazilian real [about 130 US dollars] per month in Brazil as compared with 180 Baht [4.4 US dollars] per day in Thailand for example). Costs related to transportation and fluctuations in foreign exchange rates are also important in evaluating the competitiveness of Brazilian products against rivals from Asia.
Brazilian companies also have disadvantages in both scale of business and in efficiency at the management level. In comparison with leading companies in the United States and Mexico, the local market in Brazil is shared by a greater number of smaller indigenous producers. In addition, Brazilian firms must meet the strict quarantine regulations of developed countries and establish production facilities flexible enough to satisfy rapid growing demands. These, of course, require a larger scale of production and more fund-raising ability. These issues pose threats of market reorganization to Brazilian slaughterers. It is difficult to forecast whether these possible threats will be turned into reality by top Brazilian firms or by multinational corporations. It is difficult to forecast if such reorganization would be encouraged by top Brazilian firms or by multinational corporations. Evidence may be found supporting both, and it is interesting to note specifically the mergers and acquisitions (M&A’s) of Seara by Cargill, of Só Frango by Sadia, and of Abatedouro Mary Loize by Perdigão.5
Consumers will no doubt avoid the risk of depending on a sole supplier of poultry meat products. Further, the possibility that avian influenza may spread in Brazil cannot be denied. Such can certainly provide business opportunities for other developing countries, including those in Latin America.
5
References
Anselin, Luc, Ibnu Syabri and Youngihn Kho (2004) “GeoDa: An Introduction to Spatial Data Analysis”, May.
Associação Brasileira dos Produtores e Exportadores de Frangos (ABEF) (2004) Annual
Report 2004.
Economic Commission for Latin America and the Caribbean (ECLAC) (2004) Latin
America and the Caribbean in the World Economy 2002-2003, May 2004.
__(2005) Latin America and the Caribbean in the World Economy 2004 Trends 2005, September 2005.
Hamaguchi, Nobuaki (1988) “The Broiler Industry in Brazil” (in Japanese), Ajia Keizai, Vol. 29, No. 9, September.
Horne, Peter van (2002) “ Europe to push for global standards for chicken production?”,
Business Focus, Cobb-Vantress, Inc.
Mitchell, Andy (2005) The ESRI Guide to GIS Analysis Volume 2: Spatial
Measurements & Statistics, ESRI Press, New York.
Tamai, Akio and Asaki Hitoshi (2000) “Brazil Keiniku Sangyo no Gaiyo (An Overview of the Brazilian Chicken Meat Industry)” (in Japanese), Agriculture & Livestock Industries Corporation (ALIC), August.
Table 1 Chicken Meat Production, Exports and Imports for 2004 in the World and Latin America (in 10,000 tons)
Production Export Import
Country (%) Country (%) Country (%)
World 6,844.9 100.0 World 730.8 100.0 World 655.2 100.0
United States 1,551.4 22.7 Brazil 242.5 33.2 Russia 99.9 15.3
China 989.5 14.5 United States 234.3 32.1 Hong Kong 50.2 7.7
Brazil 866.8 12.7 Netherlands 51.5 7.1 Saudi Arabia 42.7 6.5
Mexico 222.5 3.2 France 34.4 4.7 Japan 35.4 5.4
India 165.0 2.4 Belgium 33.8 4.6 United Kingdom 34.2 5.2
United Kingdom 128.8 1.9 United Kingdom 19.0 2.6 Mexico 31.1 4.7
Spain 126.8 1.9 Germany 16.3 2.2 Ukraine 27.6 4.2
Japan 124.2 1.8 Hong Kong 12.9 1.8 China 23.0 3.5
Indonesia 119.1 1.7 Denmark 12.2 1.7 Germany 22.6 3.5
Russia 115.2 1.7 China 9.9 1.4 Netherlands 22.3 3.4
Latin America 1,568.9 100.0 Latin America 254.4 100.0 Latin America 64.3 100.0
Brazil 866.8 55.2 Brazil 242.5 95.3 Mexico 31.1 48.4
Mexico 222.5 14.2 Argentina 6.5 2.5 Cuba 11.4 17.7
Argentina 78.5 5.0 Chile 4.2 1.7 Guatemala 5.3 8.2
Colombia 70.9 4.5 Dominican Rep. 0.5 0.2 Jamaica 3.1 4.9
Venezuela 68.6 4.4 Mexico 0.3 0.1 Venezuela 2.4 3.7
Peru 64.3 4.1 Costa Rica 0.2 0.1 Haiti 1.7 2.7
Chile 44.6 2.8 Paraguay 0.1 0.0 Surinam 1.3 2.1
Ecuador 20.8 1.3 Honduras 0.1 0.0 Antilles 1.2 1.8
Dominican Republic
18.3 1.2 El Salvador 0.0 0.0 Bahama 0.9 1.5
Guatemala 15.5 1.0 Nicaragua 0.0 0.0 Chile 0.9 1.4
Latin America/World 22.9 Latin America/World 34.8 Latin America/World 9.8
Table 2 Chicken Meat Imports in Japan by Origin (in tons) 1990 1995 2000 2001 2002 2003 2004 2005 1990-2005 Total 291,226 535,955 568,273 523,089 524,449 466,111 353,796 419,120 7,349,039 Brazil 40,579 94,439 112,933 109,217 168,158 174,942 296,053 378,466 2,011,280 United States 100,004 125,250 87,324 75,991 49,646 47,186 29,587 28,923 1,448,642 Chile 2,371 386 15 91 3,869 5,950 23,992 The Philippines 34 16 54 44 1,017 1,644 2,820 Argentina 50 291 1,134 1,640 Poland 0 309 1,020 1,329 China 34,914 196,951 238,216 188,801 118,998 62,928 8,420 976 1,977,914 Korea 5 167 116 195 359 52 289 1,552 Denmark 655 296 405 404 476 176 489 276 6,591 France 2,363 1,841 69 80 107 106 132 126 21,760 Taiwan 317 395 228 302 300 357 164 79 4,329 Hungary 346 46 71 108 175 104 101 64 1,585 Thailand 104,737 114,871 127,941 146,542 183,305 175,172 12,249 61 1,808,123 Dominica Rep. 21 42 63 Belize 41 25 93 Peru 1,766 23 3,306 Spain 22 9 3 6 6 16 18 21 136 Costa Rica 1 31 Indonesia 179 300 521 1,444 2,442 3,788 35 14,822 Mexico 2,533 164 25 261 11,877 Malaysia 131 368 645 651 2,599 Others 440 871 346 21 219 122 77 0 4,555
Source: Author’s production based on statistics of the Ministry of Finance (MOF) (website of the MOF accessed on April 25, 2006).
Table 3 Leading Broiler Producers in Latin America
Company Country No. Broilers (1,000)
Sadia Brazil 618,000
Perdigão Brazil 546,000
Bachoco Mexico 404,000
Frangosul (Doux) Brazil 286,000
Seara (Cargill) Brazil 273,000
Avipal Brazil 225,000
Pilgrim's Pride de Mexico Mexico 155,000
Tyson/Trasgo Mexico 125,000
Dagranja Brazil 105,000
Grupo San Fernando Peru 102,000
Protinal/Proagro C.A. Venezuela 98,000
Aurora Brazil 95,000
Agrosuper Chile 92,000
Corporación Avícola Jarabacoa (Pollo Cibao) Dominican Rep. 80,000
Copacol Brazil 75,000
Pena Branca Brazil 75,000
Granja Tres Arroyos Argentina 68,000
Ariztía Chile 68,000
Grupo Monterrey Mexico 68,000
Pronaca Ecuador 60,000
Granja La Caridad Venezuela 60,000
Rasic Hnos Argentina 59,000
Avidesa Colombia 52,000
Big Frango Brazil 50,000
Sertanejo Brazil 50,000
Grupo Pecuario San Antonio Mexico 45,000
Lar Brazil 44,000
Avícola Villalobos Guatemala 42,200
Penasul Alimentos (OSI) Brazil 42,000
PATSA Mexico 40,000
Table 4 The 50 Major Poultry Producers in Brazil for 2004 and 2005
Ranking Firms Poultry (Heads) Growth Share (%)
2004 2005 2005 2004 (%) 2005 (1) 1 Sadia 629,209,878 550,149,640 14.4 14.21 (2) 2 Perdigão 498,850,657 475,596,089 4.9 11.27 (3) 3 Seara 277,320,934 263,320,384 5.3 6.26 (4) 4 Frangosul 237,068,234 231,503,059 2.4 5.36 (5) 5 Avipal 208,096,594 187,653,021 10.9 4.70 (6) 6 Dagranja 117,199,849 114,056,368 2.8 2.65 (7) 7 Aurora 91,826,334 86,227,916 6.5 2.07 (8) 8 Diplomata 90,754,483 84,401,085 7.5 2.05 (9) 9 Penabranca 82,155,225 74,778,648 9.9 1.86 (10) 10 Copacol 72,080,048 62,029,390 16.2 1.63 (11) 11 Pif Paf 53,192,295 50,511,257 5.3 1.20 (12) 12 Sertanejo 48,703,960 47,193,539 3.2 1.10 (21) 13 Frango Forte 48,255,906 33,933,386 42.2 1.09
(14) 14 Big Frango / Jandelle 48,193,500 43,766,241 10.1 1.09
(13) 15 Kaefer Avicultura 47,976,472 44,392,807 8.1 1.08
(20) 16 Rei Frango 45,777,144 34,584,516 32.4 1.03
(17) 17 C.Vale 42,408,783 37,302,168 13.7 0.96
(16) 18 Penasul 42,325,268 39,841,177 6.2 0.96
(15) 19 Coop. Agroindl. Lar 41,075,461 40,149,388 2.3 0.93
(22) 20 Ad’oro 37,361,755 33,467,059 11.6 0.84
(18) 21 Avic. Céu Azul 37,103,020 34,730,072 6.8 0.84
(25) 22 Anhambi 35,222,181 30,000,979 17.4 0.80
(32) 23 Mat. Avic. Flamboiã 33,630,590 23,997,475 40.1 0.76
(33) 24 Avícola Paulista 32,865,286 23,856,551 37.8 0.74 (30) 25 São Salvador 32,411,121 24,972,297 29.8 0.73 (24) 26 Coopavel 32,202,400 30,490,758 5.6 0.73 (27) 27 Coperguaçú 31,404,872 28,863,670 8.8 0.71 (26) 28 Nutriza 31,033,287 29,088,658 6.7 0.70 (31) 29 Agrovêneto 27,313,146 24,381,138 12.0 0.62 (36) 30 Avicola Felipe 25,948,112 20,926,282 24.0 0.59
Table 4 (continued)
(29) 31 Macedo, Koerich 25,732,727 25,061,471 2.7 0.58
(28) 32 Comaves 25,371,320 26,419,987 (4.0) 0.57
(34) 33 Coop. R. A Languirú 24,053,657 22,405,371 7.4 0.54
(42) 34 Gonçalves & Tortola 22,491,460 17,904,060 25.6 0.51
(38) 35 Coroaves 21,872,592 20,019,340 9.3 0.49 (23) 36 Cotrel 21,636,506 30,726,919 (29.6) 0.49 (35) 37 Francap 21,115,438 21,042,228 0.3 0.48 (37) 38 Frangoeste 19,875,689 20,234,992 (1.8) 0.45 (39) 39 Coop. Holambra 19,847,930 19,746,255 0.5 0.45 (47) 40 Jaguafrangos 19,079,358 13,780,071 38.5 0.43 (44) 41 Nogueira Rivelli 18,745,645 15,866,008 18.1 0.42
(48) 42 Abat. Aves Ideal 18,612,494 13,489,094 38.0 0.42
(40) 43 Polifrigor 18,233,778 18,837,327 (3.2) 0.41 (41) 44 Frinal 18,172,072 18,125,677 0.3 0.41 (45) 45 Agrofrango 15,776,702 15,112,104 4.4 0.36 (46) 46 Notaro Alimentos 14,156,698 13,937,111 1.6 0.32 (49) 47 Votuporanga 13,746,750 13,067,272 5.2 0.31 NR 48 Palmali 13,603,752 11,146,442 22.0 0.31 (50) 49 Cossissa Agroindl. 12,938,041 12,717,121 1.7 0.29 50 Real Alimentos 12,731,183 11,049,021 15.2 0.29 Sub total 3,456,760,587 78.09 Others 969,973,407 Total 4,426,733,994
Source: UBA (União Brasileira de Avicultura) / ABEF (Associação Brasileira dos Produtores e Exportadores de Frangos) (UBA Relatório Anual 2005/2006).
Table 5 The 25 Major Brazilian Exporters of Poultry Products in 2005
No. Firm Export volume (ton) Share in exports (%)
1 SADIA S/A 733,784 25.78
2 PERDIGÃO Agroindustrial S/A 495,146 17.40
3 SEARA Alimentos S/A 353,269 12.41
4 DOUX FRANGOSUL S/A Agroavícola Industrial 286,805 10.08
5 AVIPAL S/A Avicultura e Agropecuária 215,813 7.58
6 DIPLOMATA Industrial e Comercial Ltda. 75,225 2.64
7 Moinhos Cruzeiro do Sul S/A – PENABRANCA 65,514 2.30
8 Cooperativa Central Oeste Catarinense – AURORA 49,446 1.74
9 Avicultura Granja CÉU AZUL Ltda. 46,837 1.65
10 Cooperativa Agroindustrial LAR 45,750 1.61
11 PENASUL Alimentos Ltda. 44,462 1.56
12 DAGRANJA Agroindustrial Ltda. 42,792 1.50
13 C. VALE Cooperativa Agroindustrial 42,381 1.49
14 Cooperativa Agricola Consolata Ltda. – COPACOL 36,914 1.30
15 Agroavícola Vêneto Ltda. – AGROVENETO 33,994 1.19
16 Frango SERTANEJO Ltda. 26,694 0.94
17 BIG FRANGO – Indústria e Comércio de Alimentos Ltda. 24,834 0.87
18 MACEDO KOERICH S/A 23,401 0.82
19 Cooperativa LANGUIRU Ltda. 21,972 0.77
20 Cooperativa Agropecuária Cascavel Ltda. – COOPAVEL 18,760 0.66
21 PALMALI Industrial de Alimentos Ltda. 14,232 0.50
22 Nogueira Rivelli Irmãos Ltda – FRANGOBOM 13,478 0.47
23 Rio Branco Alimentos S/A – PIF PAF 10,008 0.35
24 COSSISA Agroindustrial S/A 9,183 0.32
25 VOSSKO do Brasil Alimentos Congelados Ltda. 7,469 0.26
Subtotal 2,738,163 96.21
Others 107,783 3.79
Ground total 2,845,946 100.00
Table 6 Financial Data of Leading Meat Products Companies in the Americas for 2004 (in million US Dollars)
Sadia Perdigão Tyson Foods Bachoco
Operating Revenue/Sales 2,302 1,840 26,441 1,193
Cost of goods sold (1,617) (1,331) (24,550) (967)
Gross Profit 684 509 1,891 225
Selling, General and administrative expenses (451) (321) (880) (149)
Other operating expense, net 6 (3) (86)
Total operating expenses (445) (324) (966) (149)
Operating Income 239 140 925 77
Net Income 184 111 403 63
Total Current Assets 1,527 478 3,532 410
Property, plant and equipment, net 357 346 3,964 738
Total Assets 2,197 951 10,464 1,205
Number of Employees 40,600 31,406 114,000 18,896
Poultry sales/Total sales (%) 40.8 37.5 31.6 78.5
Growth in Operating Revenue for 2000-2004 (2000=1) 2.1 2.8 3.6 1.2
Growth in Operating Income for 2000-2004 (2000=1) 7.0 7.2 2.7 0.5
Cost of goods sold/Operating Revenue (%) 70.3 72.3 92.8 81.1
Total operating expenses/Operating Revenue (%) 19.3 17.6 3.7 12.5
Operating Income/Operating Revenue (%) 10.4 7.6 3.5 6.4
Property, plant and equipment, net/Employees (US$1,000) 8.8 11.0 34.8 39.1
Total Assets/Employees (US$1,000) 54.1 30.3 91.8 63.8
Operating Income/Total Assets (%) 10.6 14.0 8.8 6.4
Operating Income/Operating Revenue (%) 10.4 7.6 3.5 6.4
Operating Revenue/Total Assets 1.0 1.8 2.5 1.0
Notes: 1) Local currency-denominated figures were converted. Exchange Rates (end of 2004) were as follows: R$2.6544/US$, Ps.$11.15/US$.
2) Perdigão values are in accordance with the Brazilian generally accepted accounting principles (GAAP). Bachoco values are in accordance with the Mexican GAAP. Tyson data ended October 1, 2004.
3) Poultry sales for Sadia, Perdigão, and Tyson Foods do not include processed products. Bachoco’s classification is unclear, but the portion does not seem to be significant.
4) With the acquisition of beef and pork powerhouse, IBP, Inc., Tyson becomes the world’s largest processor and marketer not only of chicken, but also red meat.
Table 7 Segment Information for Leading Meat Products Companies in the Americas for 2005
Poultry Beef Pork
Processed Products
Others Total
Sadia Net Operating Revenue 1,366.8 313.0 1,344.6 102.2 3,126.6
Operating income 115.3 40.4 116.9 1.2 273.8
Operating income/Revenue (%) 8.4 12.9 8.7 8.8
Tyson Sales 8,295 11,618 3,247 2,801 53 26,014
Operating income 582 (12) 47 78 70 765
Operating income/Sales (%) 7.0 1.4 2.8 2.9
Bachoco Net revenues 1,208.9 152.3 1,361.1
Gross profit 359.9 22.1 382.0
Gross profit/Revenue 29.8 14.5 28.1
Notes: 1) Bachoco’s poultry segment is composed of chickens and eggs. “Others” basically refers to swine and feed.
2) Values for Sadia and Bachoco are as of and for the year ending December 31, 2005. 3) Sadia values are in accordance with the Brazilian GAAP.
Table 8 Production and Export of Poultry Meat by States in 2000 and 2005
2000 2005
Quantity of Poultry Production (1000t) Production Domestic Exports Production Domestic Exports
Parana 1,511.8 1,257.5 254.3 2,526.6 1,735.5 791.1 Santa Catarina 1,491.0 1,079.3 411.7 1,854.9 1,062.0 792.8
Rio Grande co Sul 1,264.8 1,049.7 215.1 1,633.6 956.9 676.7 Sao Paulo 1,057.0 1,043.8 13.2 1,596.6 1,355.0 241.6
Others 2,786.0 2,773.6 12.4 3,455.2 3,111.5 343.8 Total 8,110.5 7,203.8 906.7 11,066.8 8,220.9 2,845.9
2000 2005
Share (within States) Production Domestic Exports Production Domestic Exports
Parana 100.0% 83.2% 16.8% 100.0% 68.7% 31.3% Santa Catarina 100.0% 72.4% 27.6% 100.0% 57.3% 42.7%
Rio Grande co Sul 100.0% 83.0% 17.0% 100.0% 58.6% 41.4% Sao Paulo 100.0% 98.8% 1.2% 100.0% 84.9% 15.1%
Others 100.0% 99.6% 0.4% 100.0% 90.1% 9.9% Total 100.0% 88.8% 11.2% 100.0% 74.3% 25.7%
2000 2005
Share (between States) Production Domestic Exports Production Domestic Exports
Parana 18.6% 17.5% 28.0% 22.8% 21.1% 27.8% Santa Catarina 18.4% 15.0% 45.4% 16.8% 12.9% 27.9%
Rio Grande co Sul 15.6% 14.6% 23.7% 14.8% 11.6% 23.8% Sao Paulo 13.0% 14.5% 1.5% 14.4% 16.5% 8.5%
Others 34.4% 38.5% 1.4% 31.2% 37.8% 12.1% Total 100.0% 100.0% 100.0% 100.0% 100.0% 100.0% 2000-2005
Growth Rate Production Domestic Exports
Parana 67.1% 38.0% 211.1% Santa Catarina 24.4% -1.6% 92.6% Rio Grande co Sul 29.2% -8.8% 214.6% Sao Paulo 51.0% 29.8% 1730.0% Others 24.0% 12.2% 2672.3% Total 36.5% 14.1% 213.9% 2000-2005
Contribution Production Domestic Exports
Parana 67.1% 31.6% 35.5% Santa Catarina 24.4% -1.2% 25.6% Rio Grande co Sul 29.2% -7.3% 36.5% Sao Paulo 51.0% 29.4% 21.6% Others 24.0% 12.1% 11.9% Total 36.5% 12.5% 23.9%
Note: The weight of production was calculated assuming 2.5 kilograms per head. Source: Author’s calculation based on the ABEF data.
Table 9 Production and Export of Poultry Meat by States in 2003 and 2005
2003 2005
Quantity of Poultry Production (1000t) Production Domestic Exports Production Domestic Exports
Parana 2,033.4 1,536.7 496.7 2,526.6 1,735.5 791.1 Santa Catarina 1,621.9 1,009.4 612.5 1,854.9 1,062.0 792.8
Rio Grande do Sul 1,505.5 957.6 548.0 1,633.6 956.9 676.7 Sao Paulo 1,168.0 1,104.1 63.9 1,596.6 1,355.0 241.6 Minas Gerais 582.6 529.9 52.7 677.3 583.6 93.6
Goias 345.1 286.0 59.0 431.6 342.7 89.0
Mato Grosso do Sul 280.2 237.3 42.9 307.0 240.4 66.6 Mato Grosso 165.8 126.8 39.0 168.9 107.7 61.2
Others 1,581.6 1,574.4 7.2 1,870.5 1,837.1 33.4 Total 9,284.2 7,362.2 1,922.0 11,066.8 8,220.9 2,845.9
2003 2005
Share (within States) Production Domestic Exports Production Domestic Exports
Parana 100.0% 75.6% 24.4% 100.0% 68.7% 31.3% Santa Catarina 100.0% 62.2% 37.8% 100.0% 57.3% 42.7%
Rio Grande do Sul 100.0% 63.6% 36.4% 100.0% 58.6% 41.4% Sao Paulo 100.0% 94.5% 5.5% 100.0% 84.9% 15.1% Minas Gerais 100.0% 91.0% 9.0% 100.0% 86.2% 13.8%
Goias 100.0% 82.9% 17.1% 100.0% 79.4% 20.6% Mato Grosso do Sul 100.0% 84.7% 15.3% 100.0% 78.3% 21.7%
Mato Grosso 100.0% 76.5% 23.5% 100.0% 63.8% 36.2%
Others 100.0% 99.5% 0.5% 100.0% 98.2% 1.8% Total 100.0% 79.3% 20.7% 100.0% 74.3% 25.7%
2003 2005
Share (between States) Production Domestic Exports Production Domestic Exports
Parana 21.9% 20.9% 25.8% 22.8% 21.1% 27.8% Santa Catarina 17.5% 13.7% 31.9% 16.8% 12.9% 27.9%
Rio Grande do Sul 16.2% 13.0% 28.5% 14.8% 11.6% 23.8% Sao Paulo 12.6% 15.0% 3.3% 14.4% 16.5% 8.5% Minas Gerais 6.3% 7.2% 2.7% 6.1% 7.1% 3.3%
Goias 3.7% 3.9% 3.1% 3.9% 4.2% 3.1%
Mato Grosso do Sul 3.0% 3.2% 2.2% 2.8% 2.9% 2.3% Mato Grosso 1.8% 1.7% 2.0% 1.5% 1.3% 2.1%
Others 17.0% 21.4% 0.4% 16.9% 22.3% 1.2%
Table 9 (continued)
2003-2005
Growth Rate Production Domestic Exports
Parana 24.3% 12.9% 59.3% Santa Catarina 14.4% 5.2% 29.4% Rio Grande do Sul 8.5% -0.1% 23.5% Sao Paulo 36.7% 22.7% 277.9% Minas Gerais 16.2% 10.1% 77.7% Goias 25.1% 19.8% 50.7% Mato Grosso do Sul 9.5% 1.3% 55.0% Mato Grosso 1.8% -15.1% 56.8% Others 18.3% 16.7% 363.3% Total 19.2% 11.7% 48.1%
2003-2005
Contribution Production Domestic Exports
Parana 24.3% 9.8% 14.5% Santa Catarina 14.4% 3.2% 11.1% Rio Grande do Sul 8.5% 0.0% 8.5% Sao Paulo 36.7% 21.5% 15.2% Minas Gerais 16.2% 9.2% 7.0%
Goias 25.1% 16.4% 8.7%
Mato Grosso do Sul 9.5% 1.1% 8.4% Mato Grosso 1.8% -11.5% 13.4% Others 18.3% 16.6% 1.7%
Total 19.2% 9.2% 10.0%
Note: The weight of production was calculated assuming 2.5 kilograms per head. Source: Author’s calculation based on ABEF data.
Figure 1 Chicken Meat Production (in tons) 0 10,000,000 20,000,000 30,000,000 40,000,000 50,000,000 60,000,000 70,000,000 80,000,000 196 1 196 3 196 5 196 7 196 9 197 1 197 3 197 5 1977 1979 1981 1983 1985 1987 1989 1991 1993 1995 1997 1999 200 1 200 3 200 5 World Brazil USA China
Source: Author’s production based on data of FAOSTAT (Website of FAO accessed on April 25, 2006)
Figure 2 Chicken Meat Exports (in tons)
0 1,000,000 2,000,000 3,000,000 4,000,000 5,000,000 6,000,000 7,000,000 8,000,000 9,000,000 1990 1991 1992 1993 1994 1995 1996 1997 1998 1999 2000 2001 2002 2003 2004 World Brazil USA China+Hong Kong
Figure 3 Production, Consumption, and Export of Chicken Meat in Brazil (in 1,000 tons) 0 1,000 2,000 3,000 4,000 5,000 6,000 7,000 8,000 9,000 10,000 1986 1987 1988 1989 1990 1991 1992 1993 1994 1995 1996 1997 1998 1999 2000 2001 2002 2003 2004 2005 Production Consumption Export
Source: Author’s production based on UBA (Relatório Anual 2005/2006).
Figure 4 Per Capita Meat Consumption in Brazil (in kilograms)
0 5 10 15 20 25 30 35 40 45 1 9 8 6 19 8 7 19 8 8 1 98 9 1 9 90 1 9 9 1 1 9 9 2 1 9 9 3 1 99 4 1 99 5 1 9 96 1 9 97 1 9 9 8 1 9 9 9 20 0 0 2 00 1 2 00 2 2 0 03 2 0 04 2 0 0 5 Chicken Beef Pork
Figure 5 Meat Exports (in Million US dollars, FOB) -500 1,000 1,500 2,000 2,500 3,000 3,500 4,000 1996 1997 1998 1999 2000 2001 2002 2003 2004 2005 Beef Pork Chicken
Source: Author’s production based on data downloaded from Ministry of Agriculture (accessed on May 23, 2006).
Figure 6 Sadia’s Integrated Supply Chain in 2004
Sadia Sadia
12,500 10,000 Brazil Consumers
Corn and Soy Integrated Slaughterhouses
Producers Farmers 8 poultry 1.6 million tons 5 hogs 15
■6,600 poultry farmers
distribution
centers 42%: processed
Sadia 450 million chickens Sadia products Grand- 19 million turkeys Exports 50%: Poultry parents Genetic ■3,400 pork farmers 9 industrial 8%: Pork (Poultry) Production 4 million hogs units 100 countries
Figure 7 Establishment of Poultry Slaughterhouses by States BA DF GO GO MG MGMG MG MG MS MSMG MG MS MT MT MT PE PR PR PR PR PR PR PR PR PR PR PR PR PR PR RJ RO RS RS RS RS RS RS RS RS SC SC SC SC SC SC SC SC SC SC SC SC SC SP SP SP SP SP SP SP SP SP SP SP SP SP SP 0 1 2 3 4 5 6 7 8 1940 1958 1961 1964 1965 1967 1969 1971 1972 1973 1974 1975 1976 1978 1979 1980 1981 1982 1985 1987 1988 1989 1990 1992 1993 1994 1995 1996 1997 1998 1999 2000 2001 2002 2005
Note abbreviations as follows: BA (Bahia), DF (Distrito Federal), GO (Goiás), MG (Minas Gerais), MS (Mato Grosso do Sul), MT (Mato Grosso), PE (Pernambuco), PR (Paraná), RJ (Rio de Janeiro), RS (Rio Grande do Sul), SC (Santa Catarina), SP (São Paulo).
Source: Author’s production based on SIGSIF (Sistema de Informações Gerencias do Serviço de Inspeção Federal) (accessed on June 21-23, 2006).
Figure 8 The Number (upper) and Year (lower) of Establishment Slaughterhouses of the 50 Major Poultry Producers
Note: The colored States are located in the Southern, Southeastern, and Midwestern Regions. Source: Author.
Figure 9 TheNumber of Chickens for 2002 (upper left) and 2004 (upper right), and their Increase between 2002 and 2004 (lower right) in the Southern, Southeastern,
and Midwestern Regions
Figure 10 LISA Cluster Maps for the Number of Chickens for 2002 (upper left), 2004 (upper right), and their Increase between 2002 and 2004 (lower right)
Figure 11 LISA Cluster Maps for Paraná and Santa Catarina: the Number of Chickens for 2002 (left), 2004 (center), and the Increase in Number between 2002 and 2004 (right)
Figure 12 LISA Cluster Maps for São Paulo: the Number of Chickens for 2002 (upper), 2004 (middle), and the Increase in Number between 2002 and 2004 (lower)
Annex Map of Brazil
Region States Abbreviation Region States Abbreviation
North Rondônia RO Southeast Minas Gerais MG
Acre AC Espírito Santo ES
Amazonas AM Rio de Janeiro RJ
Roraima RR São Paulo SP
Pará PA South Paraná PR
Amapá AP Santa Catarina SC
Tocantins TO Rio Grande do Sul RS
Northeast Maranhão MA Midwest Mato Grosso do Sul MS
Piauí PI Mato Grosso MT
Ceará CE Goiás GO
Rio Grande do
Norte RN Distrito Federal DF
Paraíba PB Pernambuco PE Alagoas AL Sergipe SE Bahia BA Source: Author.