EVALUATING ROLE OF RAINWATER HARVESTING
IN WATER INSECURE AREAS:
A CASE OF KATHMANDU VALLEY, NEPAL
(ネパール、カトマンズをケースとした
水資源不安定地域における雨水貯留の有効性評価法の検討)
山梨大学大学院
医学工学総合教育部
論文博士学位論文
2013 年 9 月
SUJAN SHRESTHA
Evaluating role of rainwater harvesting in water insecure areas: a
case of Kathmandu Valley, Nepal
A dissertation submitted in partial fulfillment of the requirements for the degree of Doctor of Philosophy in Engineering
Special Doctoral Course on Integrated River Basin Management
Interdisciplinary Graduate School of Medicine and Engineering
University of Yamanashi, Japan
September 2013
Sujan Shrestha
i
Abstract
In many parts of the world water insecurity is becoming a major problem and it is expected to expand in coming years. Rainwater harvesting, the immediate collection of rainwater running off roof surfaces, would be a better alternative in those water insecure regions. There are many studies on rainwater harvesting potential on different geographical locations around the world. The Kathmandu Valley, capital of Nepal is also facing water shortage. Supply of water from water authorities is not enough to meet the current demand. The government and non-government sectors are advocating for and promoting of rainwater harvesting at different scales. Few studies have been carried out for rainwater harvesting estimation however; such studies are more concentrated on annual rainfall value and assuming a whole watershed. These studies may not provide actual information while considering the spatial rainwater harvesting potential. In addition, quality of rainwater should also be assessed before harvesting as it is affected by several sources such as marine, inland and anthropogenic activities and keeping of stored water for long time will deteriorate its quality. Combination of both quantity and quality of rainwater study has not been carried out before in the Kathmandu valley. So this research will attempt to address the finding through a case study of the Kathmandu Valley, Nepal for suitable rainwater harvesting.
The rainwater harvesting potential in spatial and temporal scale was assessed through various determinants like long-term rainfall data of 10 years, existence of number of houses in municipalities and village development committee (VDC) and their roof area. All together there are 0.6 million houses and this comprises of 39.7 Km2. A total of 47 million cubic meters (MCM) of rainwater could be harvested annually in spatial scale. A total of 19.8 MCM of rainwater could be harvested annually from Kathmandu Metropolitan city that reflect the existence of high number of houses i.e., high catchment area. On temporal basis, the rainwater harvesting potential varies in different months. The highest potential of capturing rainwater from June to September showed that in monsoon there is plenty of rainfall. The rainwater harvesting potential of the Kathmandu valley compared to previous study is comparatively low as this study considers rainfall in spatial scale and only groundwater basin.
To know whether harvested rainwater could meet the demand of the single household in study site, different analyses were performed. Daily demand and supply as well as designing of storage tanks were analyzed with a simple spreadsheet-based daily water balance model that uses daily rainfall data, contributing roof area, loss factors, available storage volume, tank overflow and rainwater demand. Two demand scenarios were assessed (1) sanitation i.e., 40 liter per capita per day (lpcd) and (2) sanitation and bathing (55 lpcd) with a household size of 4 people and with the roof area of 80 m2 of a measured unit. Analysis was performed for a 2 year (2004-05). After obtaining the results from daily water balance model it was used to design a suitable size of
ii
storage tank that can be used for a single household. Various tank size ranged from 1m3 to 15 m3 were assessed. The reliability analysis, which is the percentage of the total days in a year the storage tank can fulfill the intended demand was also assessed. The analysis showed that a reliability of 65.1 % can be achieved with a storage tank size of 15m3 when it is used for sanitation purpose only. With the same storage tank size a reliability of only 55 % can be achieved for both sanitation and bathing purpose. However, high reliability can be achieved when the storage tank size is increased but it primarily depends on the available space and affordability of the users.
Beside the potentiality of rainwater harvesting, this study further investigate the quality of rainwater and identification of contaminant sources. Rainwater samples were collected from different station for more than one and half year (2010-2011) on fortnightly basis. In addition a daily rainwater samples were also collected during monsoon season of 2011 from one station. All together 148 samples were acquired. These samples were analyzed for physicochemical and isotopic composition. Spatially, the chemical composition of rainwater does not vary. However, majority of rainwater samples possess higher concentration of calcium and bicarbonate. This is more visible during the dry season in majority of station. It indicates soil dust as a likely source of the ions. Comparison of the rainwater chemistry with Acid Deposition Monitoring Network in East Asia (EANET) sites suggests insignificant impacts of anthropogenic sources on rainwater quality of the valley. The quality of rainwater compared to the standard guidelines (national and international) was relatively low. However, the concentrations of nitrate among different season were observed to be high. As nitrate is one of the major parameters in the quality assessment of water, it is necessary to identify the sources of contamination. If people of valley relay on harvested rainwater with high concentration of nitrate, in the long term it may affect the health of people. Therefore, it is necessary to identify nitrate sources in rainwater so that in future water quality improvement management strategies could be adopted. That is why to get better results stable isotope of nitrogen (δ15N-NO3-) and oxygen (δ18O-NO3-) were used to identify the sources of nitrate in rainwater. On spatial scale, δ15N-NO3- and δ18O-NO3- value in rainwater does not show significant different. However, temporal variations of δ15N-NO3- value were high during winter and the pre-monsoon season and low in the monsoon and post-monsoon seasons. These have been attributed due the different meteorological factors such as low air temperature, calm winds and less rainfall which ultimately increases the concentrations of PM10, NOx and Sox in the atmosphere. In addition, δ18O-NO3- in rainwater were relatively low. The observed value of δ18
O-NO3- in rainwater (mean ± SD) was +34.7 ± 9.72‰ which is relatively low compared to most values reported globally of atmospheric NO3-. Most of stable isotope values of rainwater were fitted well within the range for nitrate fertilizers. This show in the valley periphery agriculture practices occur whole year and farmers use nitrate fertilizers to fertile the land. The rain samples were also distributed between that of atmospheric nitrate and all species of nitrified nitrate which showed the mixture of soil dust containing nitrate and its mixture with secondary particles.
iii
Spatial as well as temporal assessment of rainwater harvesting showed that there is huge potential of harvesting rainwater. A daily water balance model suggests that increasing the tank size could fulfill the water demand for more than a half year. One and half year long rainwater quality data showed that it is relatively good in the study area. Therefore, in the context of a promotion of rainwater harvesting to curb the water scarcity in the valley, this study confirms suitability of rainwater harvesting and domestic uses. However, this study did not cover other aspect of rainwater harvesting such as economic analysis and its quality, which should be assessed in the future.
iv
Acknowledgements
I wish to express my sincere gratitude to supervisor Prof. Futaba Kazama for her guidance, constant encouragement and constructive criticism which helped me to successfully complete my study. I also would like to thank Prof. Kei Nishida and Prof. Hiroshi Ishidaira for their constant support and constructive comments.
I am very grateful to Global Center of Excellence (GCOE) Program of the University of Yamanashi (UY), and the Japan Society for the Promotion of Science (JSPS) for awarding me a fellowship and making my way to University of Yamanashi, Japan. I would like to extend my sincere thanks to Ms. Yuki Yoneyama for her kind assistance in major laboratory work, Dr. Sangam Shrestha for giving me wonderful opportunities in doing research work at Asian Institute of Technology, Thailand, Dr. Vishnu Prasad Pandey for his valuable guidance in this entire research work and thesis preparation and Dr. Takashi Nakamura for his guidance, critical comments, and cooperation in every step to accomplish this study.
My sincere appreciation further goes to leader, sub-leaders, members, staffs, colleagues, seniors and juniors of UY-GCOE program for their academic and other necessary supports to complete my study, and make my life in Japan comfortable and enjoyable. I am thankful to Dr. Saroj Kumar Chapagain, Dr. Rabin Malla, for their support and encouragement during the study period. I also would like to thank Ms. Sujata Manadhanar, Ms. Salina Shrestha and all other colleagues in Kazama Laboratory for their help, suggestions and support during my stay in Kofu, Yamanashi. Also I would like to thank Manisha Shakya and Binod Shrestha of CREEW who did carried out rainwater sampling on time. I would also like to thank friends from AIT especially Mr. Proloy while doing some model work.
I further would also like to extend my thanks to various organizations in Nepal especially Center of Research for Environment Energy and Water (CREEW), Central Bureau of Statistics (CBS); Department of Hydrology and Meteorology; for providing necessary data and information to conduct this study.
v
List of Acronyms and Abbreviations
CBS Central Bureau of Statistics
ml Milliliter
m Meter
L Liter
µeq L-1 Microequivalent per liter
mg L-1 Milligram per liter
18
O Oxygen isotope
% Percentage
‰ Per mil
JICA Japan international cooperation agency
HMG/N His majesty government, Nepal
conc. Concentrated
IRMS Isotope ratio mass spectrometer
cm Centimeter
DHM Department of Hydrology and Meteorology
GIS Geographic Information System
Ha Hectare
ICIMOD International Centre for Integrated Mountain Development
km2 Square Kilometers
masl Meters above mean sea level
mm Millimeter
UNEP United Nations Environment Programme
VDC Village Development Committee
vi
Contents
Abstract ... i
Acknowledgements ... iv
List of Acronyms and Abbreviations ...v
List of figures ... viii
List of tables ...x
1. Introduction 1.1 Background ...1
1.2 Research motivation ...2
1.2.1 Limited research on spatial and seasonal variation of rainwater harvesting ...2
1.2.2 Quality of rainwater is primarily focused with environmental problems ...2
1.3 Objectives ...3
1.4 Research framework ...3
1.5 Dissertation outline ...4
2. Study area overview 2.1 Physical setting and climate ...5
2.2 Population and Land use Change...6
2.3 Current water supply situation in Kathmandu Valley ...7
3. Rainwater harvesting potential 3.1 Brief Introduction ...8
3.2 Methodology ...9
3.2.1 Calculation of determinants of rainwater harvesting potential ...9
3.3 Estimation of rainwater tank size ... 11
3.3.1 Development of rainwater tank model ... 11
3.4 Variation of rainfall ... 12
3.5 Variation of rainfall in units ... 13
3.6 Variation of roof area in units ... 14
3.7 Spatial variation of rainwater harvesting potential ... 15
3.8 Investigation of a rainwater harvesting potential to meet water demand ... 16
3.8.1 Monthly rainwater harvesting potential to water demand ... 16
3.8.2 Estimation of tank using daily water balance model ... 17
3.9 Summary ... 19
4. Evaluation of rainwater chemistry 4.1 Brief Introduction ... 21
4.2. Methodology ... 22
4.4.1 Characteristics of sampling area ... 22
4.4.2 Physicochemical analysis ... 23
4.4.3 Statistical analysis ... 25
4.3 Chemical Composition of Rainwater ... 25
vii
4.5 Comparison with EANET Dataset... 27 4.6 Source contribution in rainwater: an application of stable isotope ... 30 4.7 Isotopic composition in NO3- ... 33
4.7.1 Distribution of δ15
N-NO3- in rainwater ... 34 4.7.2 Distribution of δ18
O -NO3- in rainwater... 36 4.8 Evaluation with Existing Guidelines (WHO and NDWQ) and Groundwater Quality ... 39 4.9 Summary ... 40
5. Conclusions and recommendations
5.1 Summary of contributions ... 41 5.2 Suggestions for future studies ... 42
viii
List of figures
Fig. 1.1Research framework ...3
Fig. 2.1Location map of study area, the Kathmandu valley, Nepal...5
Fig. 2.2Monthly variations of rainfall and temperature in the Kathmandu Valley, Nepal ...6
Fig. 3.1Control of rainfall gauge-Thiessen polygon ...9
Fig. 3.2Annual and seasonal variation of rainfall (1999-2008) in the Kathmandu Valley, Nepal. ... 12
Fig. 3.3Spatial variation of annual average rainfall (mm) in the Kathmandu Valley watershed… ... 13
Fig. 3.4Annual average rainfall of different units of the groundwater basin in the Kathmandu Valley ... 14
Fig. 3.5Percentage of houses and total roof area of each unit in the groundwater basin in the Kathmandu Valley ... 14
Fig. 3.6Estimated roof area (m2) of 200 samples from (a) VDC and (b) municipalities ... 15
Fig. 3.7Spatial variation of rainwater harvesting potential in the groundwater basin in the Kathmandu Valley ... 15
Fig. 3.8Daily water balance model for various tank sizes under different demand scenarios for year 2004-05 ... 18
Fig. 3.9Reliability curves under various demand scenarios ... 19
Fig. 4.1 Location of study area and the eight sampling locations. The abbreviations of the sites’ names are listed as follows: GO-Gokarna, MU-Mulpani, CH-Changunarayan, GD-Godavari, SU-Syuchatar, KU-Kuleshwor, GG-Gongabu and TT-Tinthana ... 23
Fig. 4.2 Relationship between concentrations (µeq L-1), Enrichment Factors (EF) of selected ions in the rainwater of the Kathmandu Valley and the EANET sites. Bar represents minimum and maximum EF and concentration values of the eight locations in the Kathmandu Valley. Data for the EANET sites were taken from EANET (2010) ... 29
Fig. 4.3 A Plot of scores of the first and second principal components for the volume of rainfall ... 32
Fig. 4.4 δ15 N-NO3- and δ18O-NO3- in rainwater of Kathmandu Valley during monsoon 2011. Areas show the range of δ15 N-NO3 -and δ18O-NO3- values in Kendall et al. (2007) ... 33
Fig. 4.5 Seasonal variations in δ15N-NO3- in the Kathmandu Valley in 2010–2011. The line within the box represents the median. Significant differences were observed between the winter season and the pre-monsoon (p = 0.04) and monsoon (p = 0.00) seasons and between the post-monsoon season and the pre-monsoon (p = 0.01) and monsoon (p = 0.00) seasons. ... 35
Fig. 4.6 Relationship between δ15 N-NO3- and rainfall amount by season ... 35
ix
Fig. 4.7 Seasonal variation in δ18O-NO3- in the Kathmandu Valley in 2010–2011. The line within the box represents the median. Significant differences were observed between the winter season and the monsoon (p = 0.00) and post-monsoon (p = 0.00) seasons, between the pre-monsoon season and the pre-monsoon (p = 0.00) and post-pre-monsoon (p = 0.01) seasons ... 36 Fig. 4.8 Cross-plot of δ15N-NO3- vs. δ18O-NO3- in rainwater samples from 8 sampling locations
in the Kathmandu Valley. Boxes show ranges of δ15
N-NO3 -and δ18O-NO3- values for various sources. Adapted from Kendall et al. (2007) ... 37 Fig. 4.9 Relationship between δ18
x
List of tables
Table 2.1 Distribution of Population in Kathmandu Valley 2011 ...6 Table 2.2 Land covers change in the Kathmandu Valley...7 Table 3.1 Household monthly harvested rainwater and monthly balance after sanitation ... 16 Table 3.2 Household monthly harvested rainwater and monthly balance after sanitation and
bathing ... 17 Table 4.1 Characteristics of the eight sampling locations in the Kathmandu Valley ... 24 Table 4.2 Volume-weighted mean (VWM), Mean, Minimum (Min) and Maximum (Max) values, in bulk precipitation samples at the Kathmandu Valley (July 2010-June 2011) for major ion concentration (in µeq L-1) ... 26 Table 4.3 A correlation matrix of ions in the rainwater of the Kathmandu Valley during July
2010-Jun 2011 ... 28 Table 4.4 Comparison of pH and ion concentration in rainwater of the Kathmandu Valley and
selected EANET sites ... 30 Table 4.5 Correlation between different ions in rainwater of monsoon season 2011 ... 31 Table 4.6 Principal components analysis of ionic species at Kathmandu during the monsoon of
2011 ... 31 Table 4.7 Distributions of δ15N and δ18O in NO3- (‰) in rainwater (mean ± SD) at 8 locations in
the Kathmandu Valley, Nepal ... 34 Table 4.8 Evaluation of the rainwater quality with NDWQ and WHO guidelines for drinking and
Chapter
1. Introduction
1 1.1 Background
The Earth has an abundant water resource, however its uneven distribution is resulting water insecurity in different parts of the world. It is estimated that more than 2 billion people would live under water insecure condition (UNEP). Water security i.e., defined by WaterAid (2012) ‘people access to safe and affordable water to satisfy their needs for household use, food production and livelihoods (in terms of quantity and quality)’. Physical conditions like geographical or climatic factor, unsustainable consumption or overexploitation, economic factor having poor infrastructure or capacity that prevents accesses to the safe water or either pollution or natural contamination are the main driving forces of water insecurity ( Aladenola, 2008). Water insecurity has been a key issue as the global water demand has increased a six fold during past century in developing world. It has been estimated that approximately 40% of the global population lives in areas where demand exceeds supply (Molden et al., 2007).
To cope with ever increasing water demand several alternative solutions has been introduced such as sustainable rainwater harvesting for non potable or irrigation uses as well as recharging of groundwater (Herrmann and Hasse, 1997; Herrmann and Schmida, 2000; Panigrahi et al., 2007). Rainwater harvesting is simply “immediate collection of rainwater running off surfaces upon which it has fallen directly” (WaterAid, 2012). It is not a new concept, but it has been practiced since longtime before the advancement of large scale water supply system. Several countries around the world has encouraged and promoted this technology like in India, Australia, China, Japan and becoming popular in other parts of the world. Rainwater harvesting has been popular to the household water demand in different region of the world. Studies on rainwater harvesting have demonstrated its potential to save and provide significant amount of potable water and benefit in daily activities. For example, rainwater harvested in private houses in Australia (Coombes et al., 1999), residential building in Germany (Herrmann et al., 1999), schools in Taiwan (Cheng et al., 2003; 2004) and hotels in China (Deng et al., 2003) have saved ample amount of potable water. Findings from those studies have shown that promoting rainwater harvesting at various levels could save 30 to 60% of potable water depending on demand, area of roof and its characteristics. A study from Brazil (Ghisi et al., 2006) has showed a significant saving of 69% potable water when rainwater is used in 62 cities in Southern part of the country. Due to its popularity the government authorities in Australia and India is offering incentives and grants those who install new rainwater tanks on their properties.
Kathmandu Valley, the capital city of Nepal is also facing water scarcity regularly. Kathmandu valley water supply system has gradually developed with its modernization. In ancient time traditional water system (ponds, tanks, stone spouts, dug wells) which mainly focuses on household and community level has already been dried up and in threat due to building construction and pollution. Water service in the valley is inadequate as well as unreliable. Due to this people are forced to hire the tankers, the dried up traditional sources and constantly tapping surface and groundwater from borings and wells. Though various forms of water supply system including modern municipal piped supply system have been included but none of it has ever met the current water demand of the Kathamanduties. To fulfill such demand government has implemented Melamchi drinking water project. Technically this project aims to bring 170 Million-liters-a-day (MLD) of water combing it with current supply of 140 MLD, it will be 310 MLD. However, current report from Kathmandu Upatyaka Khanepani Limited (KUKL, 2010)
2
showed that the current demand is 320 MLD (105 and 65.7 during wet and dry seasons respectively) and definitely it will rise further during the course of years. Though this project is expected to complete by 2015 but due to political instability it is not sure when will it get completed. Therefore, alternative solution should be identified and promoted. Hence, Rainwater Harvesting could be the best alternative solution for both drinking and domestic water supply. Kathmandu valley receives plenty of rainwater averaging 1610 mm per annum nearly double the world’s average rainfall (ICIMOD, 2007). That means if little effort is done for rainwater harvesting it can easily address the current water demand of the valley. It is in this context, that rainwater harvesting gain importance.
1.2 Research motivation
Several reasons have motivated me to conduct this research in the proposed case study site. They are detailed as follows.
1.2.1 Limited research on spatial and seasonal variation of rainwater harvesting
The amount of rainfall is the major factor that determines in saving of potable water and designing of rainwater harvesting components. Annual rainfall value recorded over a longtime has been used to determine total amount of harvested rainwater in several studies and based on it designing of rainwater harvesting components is recommended. However, annual rainfall and monthly average rainfall over estimate the designing of rainwater storage tanks (Imteaz et al., 2012). While considering the spatial scale of rainwater harvesting it is important to acquire sufficient information of rainfall amount of particular place, building structure and the demand of water. Few studies have emphasized that it is necessary to measure the rainfall as close as possible to the building where such system will be installed (Cheng et al., 2009) as it is also influenced by the various landforms (Wung et al., 2006). In Kathmandu Valley, a very scant number of research has been done in the potential of rainwater harvesting (Dixit and Upadhya 2005, Shrestha et al. 2009, Thanju et al. 2010). This all research has been based on theoretical assumption and could not give the actual rainwater harvesting potential in spatial scale for the valley. In addition, the supply of water also depends on temporal basis for many cities in different parts of the world where the pipe water is solely controlled by the groundwater. Many urbanized cites suffer less supply during drier period when many factors affect the water supply system. In such case it is also necessary to recommend appropriate tank size for storing rainwater which can be used in dry period. In Kathmandu valley, the rainfall is more concentrated during monsoon season (June to September) so it also necessary to recommend proper tank size using a different methods that it could be wise in estimation.
1.2.2 Quality of rainwater is an issue
Rainwater harvesting has been a popular alternative to combat water scarcity in different regions of the world either it be in remote or well developed region because of lack of piped water or pollution. However, it is not always advisable to accept the quality of rainwater when considering it for drinking purposes. The quality of rainwater before it strikes to the surface for collection is strongly influenced by the weather, atmospheric transport and deposition, and proximity to pollution sources as reviewed by Abbasi (2011). There is also high chance of water becoming contaminated if the water is stored for long time in the storage tank. Both chemical and microbiological parameters affect the quality of rainwater where most visible is from chemical parameters. Chemical contamination of rainwater is mainly due to industrial pollution
3
and traffic emissions in urbanizing area while in rural area mostly from agriculture activities.
Zunckel (2003) showed the quality of rainwater is highly influenced by crustal sources, marine sources and agricultural sources as well as the transboundary effect over northeast Uruguay. Several studies on quality of rainwater have been of major interest in acid rain where anthropogenic activities strongly affect the pH values which ultimately worsen the ecosystem. However, such study is primarily focused on environmental issues and has been given a less priority for its application. Furthermore, the establishment of rainwater quality data set is important while implementing the rainwater harvesting in such area where there is no availability of fundamental dataset. So, chapter 5 presents detailed investigation of the quality of rainwater and the sources of contamination (s) and its future use.
1.3 Objectives
The broad objective of this study is evaluating the role of rainwater harvesting in the Kathmandu Valley, Nepal with following specific objectives are presented as below.
Estimation of optimum rainwater harvesting potential for storage on an average household
Evaluation of rainwater quality
Evaluation of rainwater quality for daily uses
Identification of sources of contamination(s) in rainwater
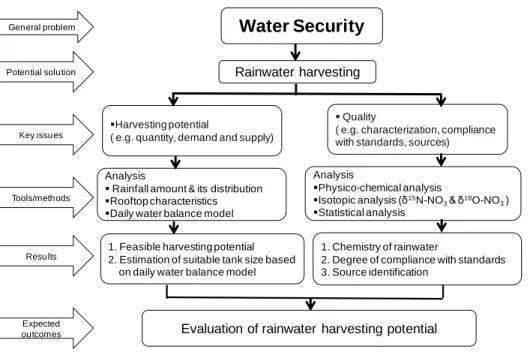
1.4 Research framework
Fig. 1.1Research framework
The research framework (Fig. 1.1) involves data collection from various sources, rainwater samplings from different places, long term rainfall data analysis, rooftop characterization, daily water balance model analysis, physicochemical and isotopic analysis of rainwater sample, and
Evaluation of rainwater harvesting potential
Water Security
1. Chemistry of rainwater
2. Degree of compliance with standards 3. Source identification
Analysis
Physico-chemical analysis Isotopic analysis (δ15N-NO
3& δ18O-NO3)
Statistical analysis 1. Feasible harvesting potential
2. Estimation of suitable tank size based on daily water balance model Analysis
Rainfall amount & its distribution Rooftop characteristics Daily water balance model
Harvesting potential
( e.g. quantity, demand and supply)
Quality
( e.g. characterization, compliance with standards, sources)
Rainwater harvesting General problem Potential solution Key issues Tools/methods Results Expected outcomes
4
interpretations of the results. The detail of each analyzed component is described in the subsequent sections and its result is present in chapter 3 and chapter 4.
1.5 Dissertation outline
This dissertation includes altogether 5 chapters. The brief outline of each chapter is presented below:
Chapter 1: Introduction
This chapter begins with the general introduction of the global water security; effects of water insecurity and alternative methods to overcome water insecurity; ongoing research and frameworks used to assess water insecurity, possible methods that can help in securing water in the insecure regions and important issues to be considered in its development. It also details the motivation to this research in the proposed case study site, objectives of this research, research framework to achieve the objectives and the outline of the subsequent chapters at the end.
Chapter 2: Study area overview
This chapter explains the physical environment, demography and gives brief overview of water supply situation in the study area.
Chapter 3: Rainwater harvesting potential
This chapter focuses on the quantification of rainwater harvesting both in terms of spatial and temporal scale. It documents and evaluates spatial and temporal scale of rainwater harvesting and presents the daily water balance model for the appropriate tank size estimation.
Chapter 4: Evaluation of rainwater chemistry
This chapter discusses understanding of rainwater quality in spatial scale. In addition, this chapter also focuses on the identification of contaminant source in the rainwater. This chapter presents temporal variation of nitrate sources both daily and biweekly results. Available results are integrated both as chemical and dual isotopic compositions of nitrate and interpreted is done. Additionally, the rainwater quality is evaluated with Acid Deposition Monitoring Network in East Asia (EANET) and with existing guidelines for drinking water quality (i.e., World Health Organization (WHO) and National Drinking Water Quality Guidelines of Nepal (NDQG)). Chapter 5: Conclusions and recommendations
This chapter summarizes findings and contributions made through this study. It further adds suggestions for the future research.
Chapter
5
This chapter includes description of the study area and current water supply situation.
2.1 Physical setting and climate
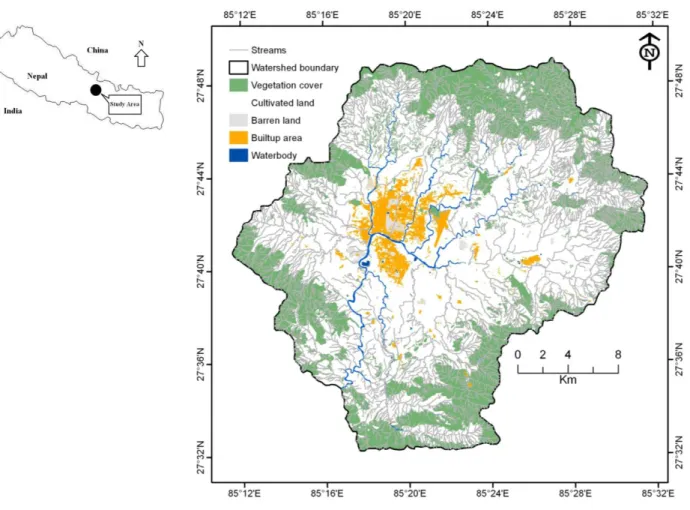
The Kathmandu Valley is located in the central part of Nepal in between 27°32’ to 27°49’ N latitudes and 85°11’ to 85°31’ E longitudes (Fig 2.1). The topography is relatively flat in the central part, with elevations of 1300-1400 meters above mean sea level (masl), and surrounded by hills with elevations above 2000 masl. The valley has total area of 665 km2; and encloses the entire area of Bhaktapur district, 85% of Kathmandu and 50% of Lalitpur districts of Nepal (ICIMOD, 2007).
Fig. 2.1Location map of study area, the Kathmandu valley, Nepal
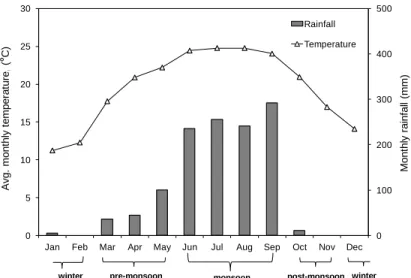
The climate of the valley is subtropical, temperate, and cool-temperate with four seasons based on the frequency and amount of rainfall: winter (December–February), pre-monsoon (March– May), summer monsoon (June–September), and post-monsoon (October–November). The average annual rainfall is 1610 mm, where 80% contributes in the monsoon period (Fig 2.2) due to the influence of the South Asian summer monsoon (JICA, 1990). The annual maximum and minimum temperature of the valley is 29°C in summer and drops below 1°C during winter.
Legend Watershed boundary ! ( Sampling location parameters Cl Na K NO3N Land cover Name_landc Baren Land Builtup Area Cultivated Land Vegetation Cover Waterbody Legend Watershed boundary ! ( Sampling location parameters Cl Na K NO3N Land cover Name_landc Baren Land Builtup Area Cultivated Land Vegetation Cover Waterbody N Greenland Panipokhari Legend Ktm_vdcmun_clip hdyroline_2 Ktmwatershed_bd dem_g_surfac Value High : 2778.48 Low : 1195.02 Legend Ktm_vdcmun_clip hdyroline_2 Ktmwatershed_bd dem_g_surfac Value High : 2778.48 Low : 1195.02 Watershed Boundary Hydroline Legend Ktm_vdcmun_clip hdyroline_2 Ktmwatershed_bd dem_g_surfac Value High : 2778.48 Low : 1195.02 High : 2778 Low: 1195 DEM
Soil water station Legend
6
Fig. 2.2Monthly variations of rainfall and temperature in the Kathmandu Valley, Nepal
2.2 Population and Land use Change
Kathmandu Valley has been the center of attraction since a long time due to concentrate administration, economy and educational opportunities which made most populous region in the country. A decade-long civil war caused the rapid migration of people from rural area for security and job and has never been back.
Table 2.1 Distribution of Population in Kathmandu Valley 2011
Area Population Number of Household
Nepal 26494504 5427302
Kathmandu valley 2,517,023 614782
Kathmandu Metropolitan city 975,453 254292
Kirtipur Municipality 65,602 19441
Lalitpur Sub-metropolitan city 220,802 54581
Bhaktapur Municipality 81,748 17639
Madhyapur Thimi Municipality 83,036 20302
VDC 1090382 359644
Source: CBS 2011
According to the census of 2011, the total population of Kathmandu Valley was 2,517,023 (CBS, 2011). Table 2.1 shows the distribution of population in Kathmandu valley based on the Census of 2011. The population of Kathmandu valley increased from 1,645,091 in 2001 to 2,517,023 in 2011 with an average annual growth rate of 3.65%. Kathmandu district has the highest population density of 2,550 persons per sq. km followed by Bhaktapur (2,167 persons per sq.
0 100 200 300 400 500 0 5 10 15 20 25 30
Jan Feb Mar Apr May Jun Jul Aug Sep Oct Nov Dec
Mo n th ly ra in fa ll (mm) Avg . mo n th ly te mp e ra tu re , ( C) Rainfall Temperature
7
km.) and Lalitpur (997 persons per sq. km.). At many locations in Kathmandu and Patan, the population density exceeds 40,000 to 45,000 persons per sq. km. which also reaches to as high population density as 80,000 per sq. km. in the core urban areas (ADB, 2010a).
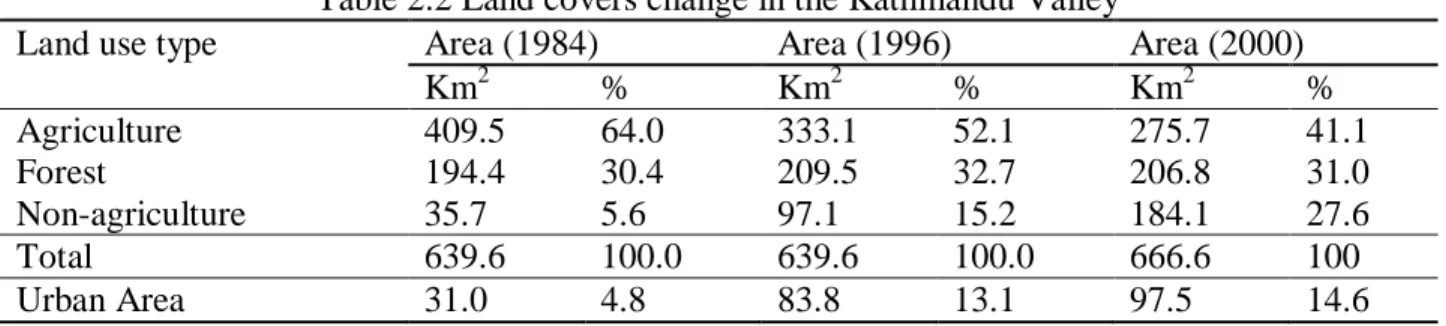
Table 2.2 Land covers change in the Kathmandu Valley
Land use type Area (1984) Area (1996) Area (2000)
Km2 % Km2 % Km2 % Agriculture 409.5 64.0 333.1 52.1 275.7 41.1 Forest 194.4 30.4 209.5 32.7 206.8 31.0 Non-agriculture 35.7 5.6 97.1 15.2 184.1 27.6 Total 639.6 100.0 639.6 100.0 666.6 100 Urban Area 31.0 4.8 83.8 13.1 97.5 14.6
Source: Acres international, 2004
Table 2.2 shows the land cover changes for the Kathmandu Valley. Majority of the land i.e., agriculture land is transforming into built up urban area. Between 1984 and 1994, the valley’s urban area increased from 3000 to 8378 ha and 5,282 ha of fertile agricultural land were lost to urbanization. For instance in the case of Kathmandu metropolitan city, it has mixed type land use which is mostly residential and commercial. It occupies 2592.7 hector or 48.88% of the total area.
2.3 Current water supply situation in Kathmandu Valley
Kathmandu valley water supply system has gradually developed with its modernization. In ancient time traditional water system (ponds, tanks, stone spouts, dug wells) which mainly focuses on household and community level has already been dried up and in threat due to building construction and pollution. Water service in the valley is inadequate and unreliable. Due to this people are searching water from the tankers, the dried up traditional sources and even tapping surface and groundwater from borings and wells. Though various forms of water supply system including modern municipal piped supply system have been included but none of it has ever met the current water demand of the Kathamanduties. To fulfill such demand government has implemented Melamchi drinking water project. Technically this project aims to bring 170MLD of water combing it with current supply of 140MLD, it will be 310MLD. However, current report from Kathmandu Upatyaka Khanepani Limited (KUKL, 2010) showed that the current demand is 320MLD and obviously it will rise further during the course of years. Though this project is expected to complete by 2015 but due to political instability it is not sure when will it get completed. Therefore, alternative solution should be identified and promoted. For this Rainwater Harvesting could be the best alternative solution for both drinking and domestic water supply. Kathmandu valley receives plenty of rainwater averaging 1610 mm per annum nearly double the world’s average rainfall (ICIMOD, 2007). That means if little effort is done for rainwater harvesting it can easily address the current water demand of the valley. It is in this context, that rainwater harvesting gain importance
Chapter
8 3.1 Brief Introduction
Supply of water for various household uses is of great concern in different parts of the world due to its limited availability and ever increasing demands. Dramatic increase in water demands in urban areas due to population growth, consumption habits, and other activities (e.g., industrial, tourism, etc.) has created immense pressure on the existing water resources (e.g., groundwater, surface water, etc.). These factors have resulted in several negative impacts on surface and groundwater resources. Surface and groundwater pollution in urban area is mainly due to leaching of pollutants from storm water, wastewaters, septic waste and industrial activities (Robertson et al., 1991; Dechesne et al., 2004). Over exploitation of groundwater has created several problems such as land subsidence (Hu et al., 2004; IGES 2007), arsenic and fluoride contamination in major Asian countries such as Bangladesh, India and Thailand etc. (IGES 2007). In order to cope with such situation alternative solution has been implemented such as sustainable rainwater harvesting (Herrmann and Hasse, 1997; Herrmann and Schmida, 2000; Panigrahi et al., 2007). Studies on rainwater harvesting have demonstrated its potential to save and provide significant amount of potable water and benefit in daily activities. For example, rainwater harvested in private houses in Australia (Coombes et al., 1999), residential building in Germany (Herrmann et al., 1999), schools in Taiwan (Cheng et al., 2003; 2004) and hotels in China (Deng et al., 2003) have saved plenty of potable water. Finding from those studies have shown that promoting rainwater harvesting at various levels could save 30 to 60% of potable water depending on demand, area of roof and its characteristics. Study from Brazil (Ghisi et al., 2006) has even showed potential to save 69% of potable water when rainwater is used in 62 cities in Southern part of the country.
If rainwater could be utilized properly, it can supplement short-supply of water and/or save potable waters in many urban areas of developed and developing countries. Kathmandu Valley, that nests capital city of Nepal, is a place with acute water scarcity. Studies have reported water supply of only 105 and 75.7 Million-liters-a-day (MLD) during wet and dry seasons, respectively, in the Kathmandu Valley while water demand is 320 MLD (KUKL, 2010). Such a huge deficit in water supply will further widen as population increases. To maintain and balance this gap lot of water is being abstracted from shallow and deep aquifers; accounting to above 50% of the water use in the valley. However, it is proven to be inadequate. So in the context of increasing water scarcity, with little attention of rainwater harvesting, this paper aims on the evaluation of rainwater harvesting potential. Given various advantages of rainwater harvesting, especially in terms of dealing with water scarcity and subsequent short-supply, some attempts are going on to promote rainwater harvesting in the area. For example, metropolitan authorities are encouraging public to harvest rainwater for household use as well as for recharging shallow groundwater. Some initiatives has been done by UN-Habitat on rainwater harvesting such as diverting the harvested rainwater in the Ranipokhari, reviving the stone spout making ponds and recharging the shallow aquifers in the Patan area of the Kathmandu Valley ( Joshi et al., 2008; WaterAid 2011). Few study documented that if the area of roof is 100 m2 with high runoff coefficient (0.8-0.9), it can collect 200m3 of rainwater per year (Shrestha, 2009). Some other reported based on the rainfall amount and different roof size, annually 15 m3 to 569 m3 of rainwater could be harvested (Dixit and Upadhya, 2005). However, such estimation could not address based on the temporal and spatial scale. Such as in the case of the Kathmandu Municipalities the demand of water is very high in different seasons compared to other
9
municipalities. The catchment is also different when considering the number of houses in the valley. Despite of these documentation and activities provided by researchers and citizens’ of valley trying to save portable water, government has not taken this positively either due to political instability or weak governance and has put this sustainable program in shadow. The main objectives of this section are to investigate the potentiality of rainwater harvesting in different seasons with an emphasis on different units (VDC and Municipalities). This chapter also tries to present analysis of household rainwater harvesting potential using a daily water balance model. The problems addressed in this study will be of great importance since rainwater quantity in Kathmandu Valley has never been fully investigated. The results of this study will provide useful information for further development of the rainwater harvesting programs at the Kathmandu Valley, Nepal, as well as for other similar areas of the world.
3.2 Methodology
3.2.1 Calculation of determinants of rainwater harvesting potential 3.2.1.1 Rainfall data
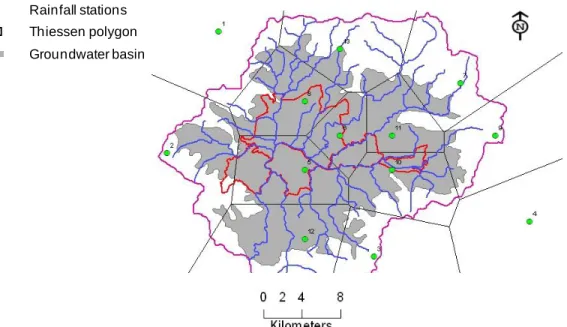
Precipitation data from 13 rain gauge stations were acquired from Department of Hydrology and Meteorology, Kathmandu Valley, Nepal.. Yearly, monthly and daily rainfall data were used in this study. Though it was suggested that at least 50 years of rainfall data is appropriate for display of long-term trend (Liaw and Tsai, 2004) due to unavailability of long-term data here 10 years (1999-2008) daily rainfall data were used. Thiessen polygons are constructed for all the gauge stations with record length longer than 10 years as shown in Fig. 3.1. To get better results inside different units (VDC or a municipality), using Thiessen polygon method a monthly rainfall is estimated.
Fig. 3.1Control of rainfall gauge-Thiessen polygon
Rainfall stations Thiessen polygon Groundwater basin
10 3.2.1.2 Number of houses in an unit
Considering a VDC or a municipality as a spatial unit, household size becomes an important variable in estimating rainwater harvesting potential in the unit under consideration. Total roof area in that particular unit is calculated as a multiple of number of houses and roof area of a house. It is related to the total water demand, storage volume and catchment. According to the Central Bureau of Statistics, Nepal (2011), the average size of household is 3.78 persons and 60% population having household size 4 to 7. The average household sizes were taken based on the total number of population and house number for each unit in the groundwater basin. To estimate the roof area in each unit, the number of house in each unit was collected from CBS 2011.
3.2.1.3 Calculation of total roof area
It is definite that every house varies in terms of its structure, floor and roof areas, roofing materials etc. The best way could be using information of roof area of individual house. However, due to lack of that kind of data, we tried to calculate percentage of houses under five arbitrarily selected range of roof area and then split total houses in that spatial unit into five groups and use average roof area of each group for the houses in particular group. Whole units were divided into two distinct zones; VDC and municipality. Distribution of roof area in a distinct zone is assumed to be uniform. Google pro software, which can calculate area of a selected polygon, was used for the purpose. A total of 100 houses were randomly selected from VDC areas and 100 others from municipal areas.
An average roof area in each unit (VDC and Municipalities) for house was then determined using Equation -1;
uRA is the average roof area of individual house in each unit (m2) H is the number of houses in each unit (VDC and municipalities) eRA is the estimated roof area taken from Fig 3.4
So the total roof area (TRA) (m2) is the sum of uRA in each unit. TRA = uRA1+ uRA2+ uRA3 + uRAn………….. (2)
Where n is the total area of roof in each unit
3.2.1.4 Runoff coefficient (Rc)
The amount of available rainwater depends on run-off coefficient a dimensionless value and by account any losses due to evaporation, leakage, overflow and transportation (Singh 1992). As water shortage is an emerging problem and many cities are facing water restrictions due to an increasing pressure on water resources (Fletcher et al., 2008) it is necessary to consider the Rc in the selection of roofs so that the potentiality of rainwater harvesting could be maximized. Estimates so far consider that roof Rc are within the range of 0.7 - 0.95. This broad range is the result of the interaction of many factors, both climatic (size and intensity of the rain event, antecedent moisture, prevailing winds) and architectural (slope, roof material, surface depressions, leaks/ infiltration, roughness). For a well-constructed roof catchment system it is 0.9.Different types of roofing materials are used in the Kathmandu Valley. Recent study conducted by CBS (2010) shows majority of the houses that are built now a days are either
11
concentrate or from galvanized sheets, that have better roof off coefficient. So for the current study Rc of 0.8 was taken considering 0.2 or 20% is lost by evaporation and for washing the catchment area using first rain that produces inferior quality (Ahmed and Rahman 2000).
3.2.1.5 Calculation of rainwater harvesting potential
Total rainwater harvesting potential for each spatial unit (either VDC or municipality) is calculated using Equation -3;
where VR is volume of rainwater that could be harvested in the groundwater basin in a month (m3/month), R is monthly rainfall (mm/month), TRA is the total roof area in the unit under consideration (m2) from equation 2, and Rc is the runoff coefficient and 1000 is the conversion factor from liters to m3.
3.3 Estimation of rainwater tank size
Before the estimation of rainwater tank size, two typical demand scenarios (a) sanitation which is 40 lpcd (liters per capita per day) and (b) sanitation and bathing which is 55 lpcd were assumed. The average household size is considered to be 4, the runoff coefficient as 0.80 with the roof area of 80 m2.
Calculation of monthly rainwater harvesting potential was chosen base on the lowest total annual rainfall. This monthly harvested rainwater is compared with the monthly water demand. So the basic monthly balance is estimated by subtracting monthly water demand from collected monthly rainwater which is expressed as:
Monthly water balance (m3) = monthly harvested rainwater (m3) - monthly demand (m3) ….. (4) Here monthly demand means the two typical demand scenarios (a) sanitation which is 40 lpcd and (b) sanitation and bathing which is 55 lpcd respectively. This monthly water balance will give tentative idea on when there will be the shortfall of water and whether it can be compensated by other months.
3.3.1 Development of rainwater tank model
A daily water balance is the most appropriate temporal scale to use to analyze rainwater harvesting system performance. A spreadsheet based on a daily water balance model was developed considering daily rainfall, roof area (catchment) and losses due to evaporation, leakage, overflow and transportation. The daily runoff volume is calculated from daily rainfall amount by multiplying the rainfall amount with the roof area and deducting the losses. As mentioned in previous section, 20% deduction from the produced runoff was applied to account for losses for this study.
A generated runoff is diverted to the connected available storage tank. Available storage capacity is compared with the accumulated daily runoff. If the accumulated runoff is higher than available storage volume, excess water (overflow) is deducted from the accumulated runoff. Then, the amount of water use is deducted from the daily accumulated/ stored runoff amount (if sufficient water is available in the storage). When sufficient water is not available in the storage, the model
12
assumes that the storage tank is empty. Hence, the model calculates daily storm water use, daily water storage in the tank, daily overflow and period when the tank becomes empty. Mathematical description is show as follows:
Cumulate water storage equation, St = Vt+St-1-D………….. (5) St=0, for St<0………….. (6) St=C, for S>C………….. (7)
Where St is the cumulative water stored in the rainwater tank (m3) after the end of tth day, Vt is the harvested rainwater (m3) on the tth day, St-1 is the storage in the tank (m3) at the beginning of tth day, D is the daily rainwater demand (m3), and C, is the capacity of rainwater tank (m3). Similarly, reliability of the storage tank in terms of supply is calculated as it determines whether the tank will provide sufficient water for intended use. Here reliability is defined as percentage of days in a year when storage tank is able to supply the intended demand (Imteaz et al., 2012). It is calculated as follows,
Where Re is the reliability of storage tank to be able to supply intended demand (%), U is the number of days in a year the storage tank was unable to meet the demand, and N is the number of days in a particular year.
3.4 Variation of rainfall at Kathmandu
Fig. 3.2Annual and seasonal variation of rainfall (1999-2008) in the Kathmandu Valley, Nepal
The annual and seasonal variation in rainfall pattern of 10 years is shown in Fig.3.2. The 10 years rainfall pattern shows that the maximum rainfall was 2173 mm in 2002 while the lowest
0 500 1000 1500 2000 2500 An n u a l ra in fa ll (m m) Year 0 100 200 300 400 500 Mo n th ly ra in fa ll (mm) Month
13
was 1429 mm during 2005 (Fig 3.2) with a annual average rainfall of 1758 mm. There exists a rather non-uniform temporal distribution (monthly), about 80% of rainfall concentrated from June to September (Fig 3.2).
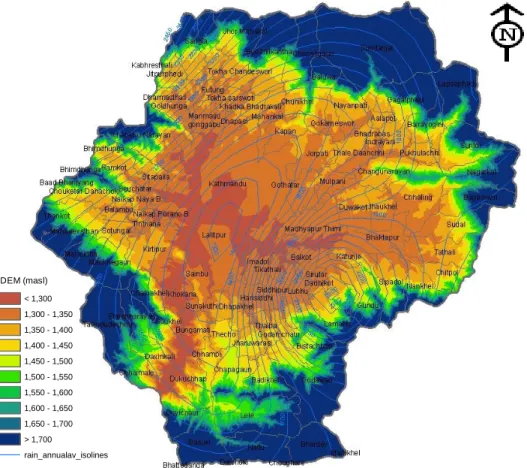
Fig 3.3 shows the spatial variation of annual average rainfall. Maximum annual average rainfall (2450 mm) is more concentration in the northern part of the valley. The lowest annual average rainfall is in the central part 1350 mm.
Fig. 3.3Spatial variation of annual average rainfall (mm) in the Kathmandu Valley watershed
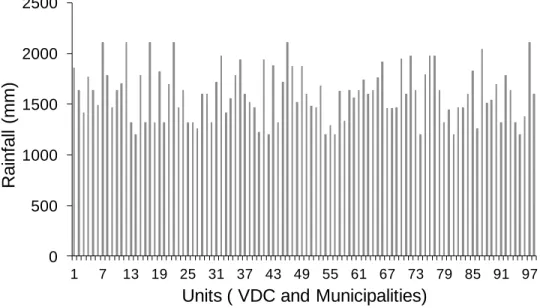
3.5 Variation of rainfall in units
Non-uniform spatial distribution of rainfall is observed based on the analysis of the average annual rainfall for 10 years (Fig 3.4). The lowest rainfall is 1202 mm in the central part and highest of 2109 mm in the northern part. On an average 1605 mm of rainfall occur in the ground water basin. Legend pop_density_map Ktmwatershed_bd DEM_g_surfac <VALUE> < 1,300 1,300 - 1,350 1,350 - 1,400 1,400 - 1,450 1,450 - 1,500 1,500 - 1,550 1,550 - 1,600 1,600 - 1,650 1,650 - 1,700 > 1,700 rain_annualav_isolines DEM (masl)
14
Fig. 3.4Annual average rainfall of different units of the groundwater basin in the Kathmandu Valley
3.6 Variation of roof area in units
Currently there exist a total of 606597 number of house in the groundwater basin (CBS 2011). The percent of house range from 0.04 to 42.2.
Fig. 3.5Percentage of houses and total roof area of each unit in the groundwater basin in the Kathmandu Valley
A frequency distribution of a roof area is shown in Fig 3.6. The distribution shows the variability in the roof area. A percent distribution of roof area in both unit (VDC and Municipalities) is shown in Fig 3.5. 0 500 1000 1500 2000 2500 1 7 13 19 25 31 37 43 49 55 61 67 73 79 85 91 97 R a in fa ll (mm)
Units ( VDC and Municipalities)
0 10 20 30 40 50 60 70 80 90 100 0 10 20 30 40 50 60 70 80 90 100 1 7 13 19 25 31 37 43 49 55 61 67 73 79 85 91 97 R o o f a re a (Km 2) P e rce n ta g e o f H o u se s
Units ( VDC and Municipalities)
% of House Total roof area
15
Fig. 3.6Estimated roof area (m2) of 200 samples from (a) VDC and (b) municipalities A total roof area ranged from 0.02 to 16.7 Km2 in a unit with the total (both VDC and municipalities) of 39.7 Km2. Based on total roof area and rainfall of each unit, total rainwater harvesting potential on spatial scale is calculated (Fig. 3.7).
3.7 Spatial variation of rainwater harvesting potential
Fig. 3.7 shows the spatial variation of rainwater harvesting potential in the groundwater basin of the Kathmandu Valley. The RWHP varies spatially which is due to the non-uniform distribution of rainfall and the number of houses in each unit (VDC and Municipalities).
Fig. 3.7Spatial variation of rainwater harvesting potential in the groundwater basin in the Kathmandu Valley 0 10 20 30 40 50 25-40 40-60 60-80 80-100 100-160 % of hou s es Roof area (m2) VDCs Municipalities
16
The highest amount of rainwater (19.8 MCM) can be captured in the Kathmandu metropolitan city which is obviously due to more number of houses (approximately 0.25 million). Though the amount of rainfall in the VDC was same, RWHP was different which is due to the difference in the number of houses. However, some units (VDC) show same RWHP though the amount of rainfall is same.
Previous finding estimate that yearly more than 1000 MCM (Dixit and Upadhya 2005), 1200 MCM (Shrestha et al. 2009) and 996 MCM (Thanju et al. 2010) rainwater can be harvested. Compared to previous studies the rainwater harvesting potential of this study is very low because prior studies consider only the annual rainfall and calculation is focused on watershed scale. However, it is necessary to estimate the rainwater harvesting potential based on the proximity of the rainfall station, demand of water. So following section explains the rainwater harvesting potential on monthly basis, monthly balance of few units in the groundwater basin of the Kathmandu Valley.
3.8 Investigation of rainwater harvesting potential to meet water demand
For this purpose two typical demand scenarios (a) sanitation which is 40 lpcd (liters per capita per day) and (b) sanitation and bathing which is 55 lpcd were assumed. These two typical scenarios were taken from Gleick and Irwa 1996. All parameters are explained in the methodology section. The average household size is considered to be 4, the runoff coefficient as 0.80 with the roof area of 80 m2 that has been calculated from the roof area of the unit.
3.8.1 Monthly rainwater harvesting potential to water demand
Monthly rainwater harvesting potential and balance for different months is presented in Table 3.1 of a single house.
Table 3.1 Household monthly harvested rainwater and monthly balance after sanitation
Month Average monthly rainfall (mm) Harvesting potential (m3/month) Water demand (m3) Monthly balance, vol.-demand (m3) Jan 15.2 0.97 4.88 -3.91 Feb 0.00 0.00 4.88 -4.88 March 0.00 0.00 4.88 -4.88 April 123 7.85 4.88 2.97 May 186 11.9 4.88 7.03 June 66.8 4.28 4.88 -0.60 July 356 22.8 4.88 17.9 August 199 12.7 4.88 7.86 Sep 214 13.7 4.88 8.85 Oct 108 6.92 4.88 2.04 Nov 30.1 1.93 4.88 -2.95 Dec 0.00 0.00 4.88 -4.88 Total 1299 83.1 58.6 24.5 Average 108.2 6.93 4.88 2.05
17
The analysis is done for a particular year when the annual rainfall low i.e., 2004. This was analyzed to know whether low rainfall amount could fulfill the two demand scenarios. Table 3.1
shows the monthly rainwater harvesting potential, demand and monthly balance. Annual rainwater harvesting potential of a given household was 83.1 m3, with the largest volume (22.8 m3) during July and no collection for February, March and December respectively. With the assumption of annual water demand for sanitation and bathing were 58.6 m3 and 80.5 m3 respectively. A total shortfall of 22.1 m3 was observed for different months as shown in Table 3.1, when it was used for sanitation purpose. This can be met with excess from other months when the potentiality of harvesting is high i.e., monsoon season. The total shortfall of 33.0 m3 observed for half years (Table 3.2), where rainwater is used for both sanitation and bathing. As mentioned earlier this deficit can be fulfilled when the rainwater is stored during monsoon period.
Table 3.2 Household monthly harvested rainwater and monthly balance after sanitation and bathing
3.8.2 Estimation of tank using daily water balance model
Further analysis was done on the storage capacity of different sizes of tanks. Though both demand scenarios were calculated based on the monthly rainfall various report suggest (Imteaz et al., 2012) that estimation of rainwater tank with this method may over estimate the actual tank size.
The usual size of tanks that are commonly used in the household of valley varies and primarily depends on the economic status, the need of water. For this study different tank sizes were assumed to get better results and reliability analysis was also done for a continuous 2 year data set.
A daily water balance sheet (i.e., using daily rainfall and water uses data) was run to estimate tank size as well as the reliability. The daily rainfall data of 2004-05 was used for the calculation
Month Average monthly rainfall (mm) Harvesting potential (m3/month) Water demand (m3) Monthly balance, vol.-demand (m3) Jan 15.2 0.97 6.70 -5.73 Feb 0.00 0.00 6.70 -6.70 March 0.00 0.00 6.70 -6.70 April 123 7.85 6.70 1.15 May 186 11.9 6.70 5.21 June 66.8 4.28 6.70 -2.42 July 356 22.8 6.70 16.1 August 199 12.7 6.70 6.04 Sep 214 13.7 6.70 7.03 Oct 108 6.92 6.70 0.22 Nov 30.1 1.93 6.70 -4.77 Dec 0.00 0.00 6.70 -6.70 Total 1299 83.1 80.5 2.70 Average 108.2 6.93 6.70 0.23
18
the daily water balance model was simulated from the end of the previous year (i.e., 31st December) assuming the tank is empty in the initial stage.
Fig 3.8 shows the daily water balance model for 2 years. Here increasing the size of the tank final storage increases. It shows that in particular days of the year the final storage increases. For instance when the tank increases from 1 m3 to 15 m3 the storage increases significantly.
Fig. 3.8Daily water balance model for various tank sizes under different demand scenarios for year 2004-05
Fig. 3.9 shows the reliability curves varying with the tank size under different demand scenarios i.e., for sanitation and sanitation and bathing.
0 10 20 30 40 50 60 70 80 0 2 4 6 8 10 12 14 16 18 20 Ra in fa ll (m m ) F in a l st o ra g e ( m 3) Days Rainfall Final storage Demand-Sanitation Demand-Sanitation & bathing
0 10 20 30 40 50 60 70 80 0 2 4 6 8 10 12 14 16 18 20 Ra in fa ll (m m ) F in a l st o ra g e ( m 3) Days 0 10 20 30 40 50 60 70 80 0 2 4 6 8 10 12 14 16 18 20 Ra in fa ll (m m ) F in a l st o ra g e ( m 3) Days 0 10 20 30 40 50 60 70 80 0 2 4 6 8 10 12 14 16 18 20 Ra in fa ll (m m ) F in a l st o ra g e ( m 3) Days 1 m3 5 m3 10 m3 15 m3
19
Fig. 3.9Reliability curves under various demand scenarios
It is found that reliability increases when the storage size of tank is increased. In case of water used for sanitation, reliability ranged from 36.5 % to 65.1 % based on the different tank size. It indicates in a year at least 134-238 days a varying size tank can fulfill certain demand. For sanitation and bathing purpose reliability ranges from 28.9 % to 54.9 % for various sizes of tank. It shows that reliability also depends on the demand scenarios (i.e., purpose of water). However, for current demand scenarios a very large tank is necessary. If the demand scenarios are decreased, a smaller storage tank size can be considered.
3.9 Summary
The water supply of valley is intermittent and there is huge gap in demand and supply. Various sources are used by the water supply cooperation as well as by the people of valley to meet the daily demand but has never fulfilled. Little efforts have been done in the investigation for alternative sources such as rainwater harvesting. This study demonstrates that there is huge potentiality of rainwater harvesting considering only the house excluding institutional buildings. Ten years rainfall data showed that plenty of rainwater could be harvested in monsoon season. Spatially Kathmandu metropolitan city alone can tap more than 20 MCM of rainwater annually even considering low roof area. Similarly, in the periphery of the Kathmandu metropolitan city rainwater harvesting potential is low which could be due to low number of houses i.e., less roof area. Two demand scenarios were assumed (sanitation and bathing) considering the household size of 4, to estimate the tank size and its reliability. Analysis for a dry year considering worse condition eventually showed that these two demand scenarios could be met if excess amount of rainwater is harvested during monsoon season could be stored for longtime and be used for shortfall period.
However, a daily water balance model that takes the consideration of daily water demand was developed for 2 years to get the optimum size of tank showed that nearly 65.1 % reliability could be achieved when the tank size is 15 m3 for sanitation purpose. For both sanitation and bathing only 54.9 % reliability could be achieved for the tank size of 15 m3. It further demonstrates that though high reliability can be achieved with the increment of tank size. However, the rainwater tank of 15 m3 is very big and such design will depend on the available space and affordability by
0 20 40 60 80 100 1 2 3 4 5 6 7 8 9 10 12 15 R eliabilit y (%) Tank size (m3) Sanitation
20
individual households rather than roof area and demand by users. It clearly suggest that whenever there is long dry period additional water should be provided i.e., from water supply authorities.
Chapter
21 4.1 Brief Introduction
Rainwater is a major source of freshwater, especially for the areas facing scarcity of surface water and groundwater resources, either due to inadequate quantity or poor quality. In many parts of the world, rainwater is still considered as a safe and reliable source of potable water (Vikaskumar et al., 2007). However, as a result of rapid population growth, urbanization, industrialization and subsequent emission of chemical compounds like NOx, SO2 and acid precursors to atmosphere, rainwater quality is being affected (Das et al., 2005; Magliavacca et
al., 2005). Depending upon degree and type of atmospheric emissions and geographical location,
rainwater could be enriched with acidic components and ultimately may cause acid rain, a serious environmental problem in many industrialized nations like northeast of United States, Canada, Europe and East Asia (Adachi et al., 1990). Several studies show that chemical composition of rainwater is determined either from marine sources (Ozeki et al., 2006) or inland soil sources (Zhang et al., 2003). Rainwater quality may vary widely even in a small area depending upon density of emission sources (e.g., industrial, traffic junctions, etc), level of emission to the atmosphere and a long range transport of Ca2+ and SO42- (Budhavat et al., 2011). As the rainwater chemistry varies from site to site (Kulshrestha et al., 2003; Budhavat et al., 2011), a continental or regional scale rainwater chemistry may not truly reflect rainwater quality in a local area. In addition, little effort has been made to investigate the role of atmospheric and surface sources that may affect the quality of rainwater in the Kathmandu Valley. One primary factor that affects the quality of rainwater is NO3-, which has increased in the atmosphere due to human activities. The main forms of nitrogen from natural sources include ammonia emissions from the soil, oceans, and animal excreta and nitrogen fixation by biological processes and lightning. Anthropogenic sources include fossil fuel burning, vehicle emissions, and application of inorganic nitrogen fertilizers in agriculture (Russell et al., 1998; Xiao and Liu 2002). Once emitted into the atmosphere, various nitrogen compounds may be deposited in aquatic and terrestrial ecosystems. Some of these forms of nitrogen could adversely affect the local environment, where the land is surrounded by high hills and mountains (Xing et al., 2012). The topography of the Kathmandu Valley is bowl-shaped and frequent inversions prevent pollutants from easily escaping out of the valley (Panday et al., 2009). Nitrogen may reach land and water surfaces through rainfall via wet and dry deposition (Garban et al., 2004) and these compounds in rainfall may affect human health if residents rely on rainwater for various purposes. Therefore, in the context of growing emphasis on rainwater harvesting to cope with ever-increasing water scarcity at different scales, it is necessary to analyze and evaluate rainwater quality for its different uses in urbanized areas as well as in the identification of the sources of nitrate in rainwater. This is further helps to develop the regulatory management strategies to adopt for air and water quality improvement (Elliott et al., 2007, 2009). For the identification of nitrate in rainwater various methods has been proposed; however, traditional methods that use volume and concentration measurements in rainwater have limitations in distinguishing natural and anthropogenic sources of NO3- (Hastings et al., 2003).
Measurement of the stable isotopes of nitrogen (N) and oxygen (O) has been recognized as a novel method for investigating contributions from various sources to atmospheric nitrogen (Kendall et al., 2007). δ15N values of anthropogenic and natural NOx sources vary over a large range and differ among seasons, as reported in many previous studies (see Kendall et al., 2007). For example, in polluted areas, δ15