A Study of Basic 3D Visualization Architecture
for Network Operation and Management Tools
Nobuo Ogashiwa
Keywords
Computer Network, Management, Operation, Visualization, 3DCG
Abstract
Recently, network operation tools using 3D visualization technologies have become more and more important. Generally, 3D visualized network operation tools are useful for computer network management or operation. However, a development of 3D visualized network operation tools requires advanced technical skills and highly cost. On the other hand, 3D computer graphics technologies become more familiar in recent years because of that computer hardwares and softwares are rapidly growing and obtain high performance. In this research, we have developed basic architecture of 3D visualization system for network operation and management tools, by using an open source 3DCG software ``Blender'' and a programming language ``Python``. In this paper, we explain details, results of evaluation and efficiency of the proposed architecture.
1. Introduction
As the result of vast Internet growth and computer network growth, visualization of computer network management and operation tools have become more and more important. Especially, 3D visualization is useful for computer network operation. For instance, in the NICTER CUBE [1], Daedalus [2] or Flamingo [3], 3D visualization of network traffic behavior on computer networks can help computer network operation and management. However, development of 3D visualized network operation tools requires advanced technical skills and it causes high cost. On the other hand, 3DCG field is one of the most promising field in computer technologies. In our study, we have developed basic architecture of 3D visualization system for network operation and management tools, by using an open source 3DCG software ``Blender'' [4] and a programming language ``Python`` [5]. In this paper, we describe the background of
This section describes the background of our study.
2.1 3D visualized network operation tool
Recently, stable and reliable network operation and management becomes more and more important. 3D visualized network operation tools like NICTER CUBE [1], Daedalus [2] and Flamingo [3] are useful for stable network operation and security management on computer networks. In addition, some other 3D visualized network operation tools [6] [7] [8] have been proposed and used. Until now, various kinds of 3D visualized network operation tools have been used in actual network operation scenes. They are specially designed softwares using some graphic libraries such as the OpenGL [9] and are adapted to a specific network environment.
2.2 3DCG software: Blender
The Blender [4] is one of comprehensive software for 3DCG production, which is released under the GPL (GNU Public License) [10] as a completely open source software. Generally, workflow of creating 3DCG consists of several processes such as a modeling of objects, a texturing of surface of objects, rendering images, and a composite image frames. There are many softwares for specific process of creation of 3DCG products such as modeling specific softwares or rendering specific softwares. The Blender has all function for the whole processes of making 3DCG which the above shows, and attracts attention in 3DCG fields. The Blender support several OS which are Windows, MacOS and Linux. The one of major characteristics of the Blender is that the Blender can be completely controlled by a programming language ``Python''. The Blender is used as a tool for data visualization [11] in the field of science and technology. In this research, a basic 3DCG software should be open source software to add or check software functions. The most suitable software which meets such condition is the Blender.
In this study, we have developed a system which can visualize computer network information dynamically using the Blender and Python.
3. Design of the Proposed Architecture
This section describes the design policy of the proposed architecture.
3.1 Comparison with Previous Network Management Tools
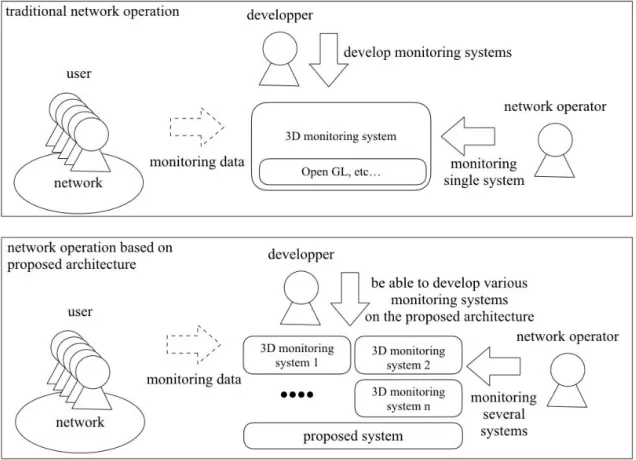
The Figure 1 shows comparison with previous network operation and management tools and the proposed architecture. In the usual method, network operation tools are developed using graphic libraries like OpenGL and require a lot of program code. Those codes of programs include not only a part of logic but also a part of design for user interfaces. When multiple network operation tools are required in network operation scene, several times of development with a lot of code must be required.
Figure 1: Comparison with Previous Network Management Tools and Proposed Architecture
proposed architecture, redevelopment of user interface becomes needless and only a program of logic part is required. This can decrease a developing costs and programmers can develop plural tiny network management tools easily.
The main purpose of our study is to achieve basic architecture which can be used in development of 3D visualized network management and operation tools. In the computer software field, it is a trade-off between flexibility and reusability in many cases. Therefore, the most flexible method is a method using OpenGL directly. In this study, we do not focus on flexibility but focus on reusability. To improve flexibility and to support interactive user interface in the proposed architecture will be future works.
3.2 Overview of the Proposed Architecture
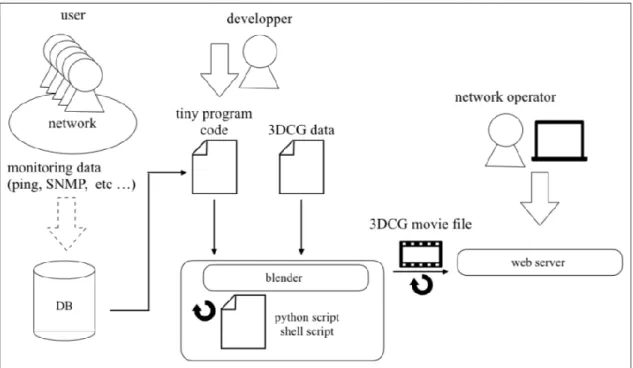
The Figure 2 shows an overview of the proposed architecture. In the proposed architecture, a system receives some input data from syslog, packet capture software, MRTG, etc. In the figure, the part of ``DB'' indicates a data input system.
The proposed architecture requires a several kinds of 3D data such as a shape of 3D object, axes information, light object, camera object. The part of ``3DCG data'' in the figure means such 3D object data.
Figure 2: Overview of the Proposed Architecture
Developers are able to achieve network operation tools by developing tiny codes which use those input data and 3DCG objects. Those are indicated as the ``developer'' and the ``tiny program code'' in the figure. In the figure, the ``blender'' is the core part of our proposed architecture and it execute the process of rendering. This automated rendering process handled by the ``blender'' and the ``python script/shell script'' generates 3DCG movie files, and copies those movie files to a web server periodically. Finally, network operators use those movie files for network operation and management.
In many cases, the process of rendering takes a lot of time so that the system has to decide the timing of data input and output based on the rendering time. It means that the system has inevitable time lag because of the image rendering process. This time lag should be as small as possible. However, erasing the time lag is impossible. This is an unavoidable precondition of the proposed architecture.
3.3 Details of the Proposed System
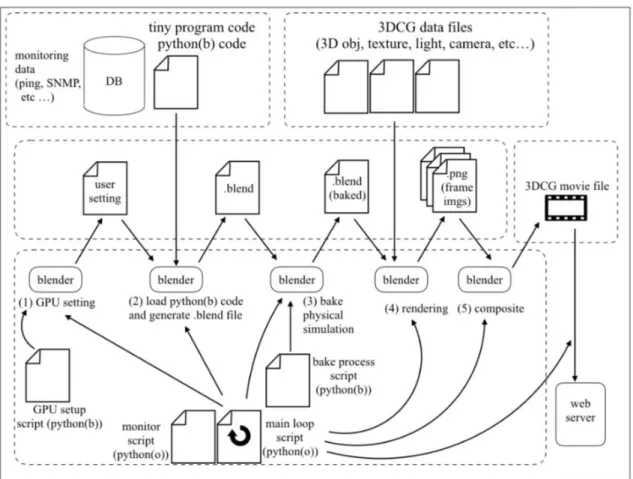
Figure 3: Details of the Proposed Architecture
In the figure, the upper left rectangle drawn by dotted line indicates input objects handled by a programmer. The ``DB'' in the rectangle means input data source and the ``tiny program'' indicate a program written in blender-python script. These elements are a data obtained from actual network and are also a program which process the data.
The upper right rectangle drawn by dotted line indicates a set of 3DCG data files handled by a UI designer. The 3DCG data files are 3D objects, textures, light source objects, camera objects, for instance.
The left rectangle in the middle drawn by dotted line indicates a set of intermediate files which are automatically generated in the proposed architecture. The ``user setting file'' is a configuration file for the blender and it includes the setting information for GPU rendering. The ``.blend file'' is the primary blender file which contains information of animation program and several 3DCG data. The ``.blend(baked) file'' is a file based on ``.blend file'' mentioned above and includes baked data of a physical simulation result. The ``Png files'' are generated by the blener and are static image files for each frames of
movie. The blender is able to generate movie file as .mov format or .mp4 format directly, however, this system generates the static image files as a failsafe for unexpected rendering troubles. If rendered images files have been saved, the rendering process is able to resume from the last rendered frame even if the rendering process is interrupted by unexpected rendering troubles. The right rectangle in the middle drawn by dotted line includes 3DCG movie file which are finally generated movie file. The lower rectangle with dotted line shows the core part of the proposed system, which consists of the blender software, GPU setting file, startup script, baking process script. In this paper, ``(o) `` means the original python environment, and ``(b)'' means python environment embedded in the Blender program.
4. Implementation
This section describes implementation of the proposed system.
4.1 Hardwares
Table 1: Detail of the Rendering Server
The Table 1 shows details of the rendering server. In our implementation, rendering server has multiple GPU. This indicates that the proposed system is able to extend to multiple GPU configuration easily. In the rendering process, the number of GPUs is an important factor for improvement of rendering speed.
Table 2: Detail of the Web Server
The Table 2 shows details of the web server.
4.2 Basic Scripts
The Table 3 shows a list of script programs in the proposed architecture.
Table 3: List of Python Scripts
In our architecture, two kinds of Python environments are used. One of the Python environments is a python environment embedded in the program of Blender in advance. This type of python script start with a line ``import bpy''.
The other Python environment is the original one. This does not depend on the Blender or other specific programs.
Scripts 1 to 4 in the table are components of the proposed architecture. The script 5 is a file developed by programmers for each network management tools based on our proposed architecture.
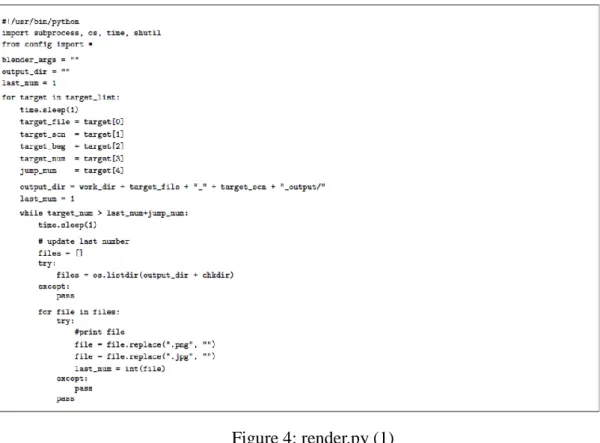
The Figure 4 and the Figure 5 show the render.py. Those figures are a single program but it is separated into two figures because of the length of the source file.
Figure 4: render.py (1)
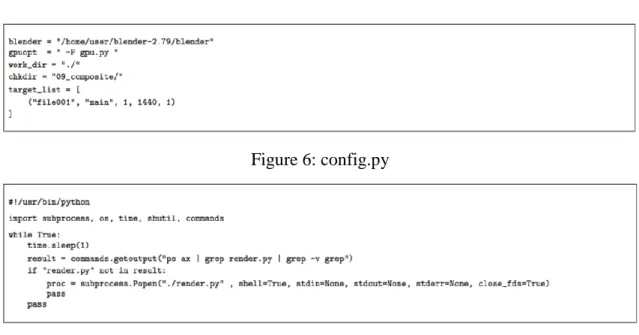
Figure 7: main.py
The ``render.py'' script executes 5 steps illustrated in the previous figure. The ``render.py'' acquire the current status from the status of other ``.blend'' files and ``.png'' files.
At the beginning of the process of the ``render.py'', the script executes the initial process of the GPU setting using ``gpu.py''. Then, the ``render.py'' generate ``.blend'' file using input data and prepared 3DCG object files. After that, the ``render.py'' executes physical simulations, bake the simulation result into the ``.blend'' file and that is saved as a new Blender file. After the baking process, the ``render.py'' invokes the blender process and generates static images of each frame. This rendering process requires long time, so that our proposed architecture does not generate a single movie file directly but save each frame of static image files in order to restart rendering process even from the middle when the system stops because of unexpected troubles. After every image frame are rendered, the ``render.py'' invoke the blender process and execute a composite process. By this process, a movie file is generated from static image frame files. Finally, the ``render.py'' copies the movie file to the web server based on a prepared setting.
Normally, this ``render.py'' loops until explicitly terminated by an operator. Nevertheless, the ``render.py'' will be suddenly terminated by unexpected troubles. In such a case, the ``monitor.py'' keeps monitoring the running status of ``render.py'' and restarts the ``render.py'' script if the ``render.py'' does not work.
Figure 8: gpy.py
The ``GPU.py'' is a python script which is loaded from blender-embedded python environment and which assigns GPU settings for the Blender. If the proposed system has multiple GPUs, those GPU configurations are described in the ``GPU.py''.
Figure 9: bake.py
The ``bake.py'' is a python script which is loaded from blender-embedded python environment and which includes 3 simple function calls. These calls are for executing physical simulations, baking the result of the simulations and quitting a blender program. After the physical simulations are successfully finished, the ``bake.py'' save the blender file as an over write mode and quit the blender program.
5. Experimental Network Operation Tools
In this study, we have developed 3 experimental network operation tools to prove the efficiency of the proposed architecture. This section describes those experimental network operation tools.
5.1 Wireless LAN AP Monitoring Tool
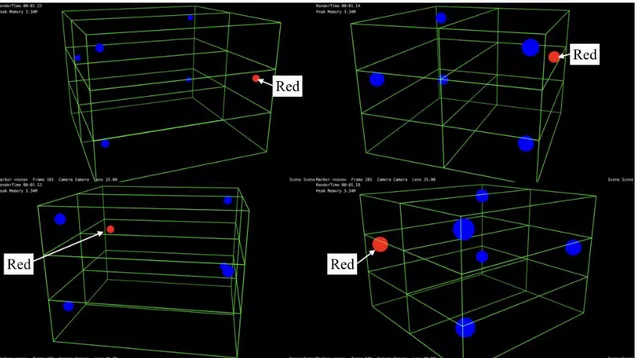
In this study, we have developed a wireless LAN access point monitoring tool based on the proposed architecture as a part of experimental implementation. The Figure 10 shows a user interface of the wireless LAN access point monitoring tool. In the figure, blue spheres indicate normal access points and red spheres indicate malfunctioning access points.
Figure 10: Wireless LAN Access Point Monitoring Tool
Figure 11: Source Code of the Wireless LAN Access Point Monitoring Tool
The wireless LAN access point monitoring tools is to show the status of the designated wireless LAN access points based on the physical positions.
Typical monitoring tools which are not 3D visualized show the status of the designated wireless LAN access points by text-based list format. However, in actual network operations, there are many cases that physical position of the access point should be identified when troubles occurred. Therefore, in an advanced network operation tool, the status of wireless LAN access points should be displayed with information of the actual physical position. The monitoring tool we developed is able to show the status of access points with physical positions.
in this paper is not practical, however, the tool itself is able to be used for actual network operation. The code of the monitoring tool is very simple and consists of some blocks which are for obtaining the access point list, changing materials to red color. This 3D data and the materials will be created by 3DCG designer.
5.2 Load Average Monitoring Tool
Figure 12: Load Average Monitoring Tool
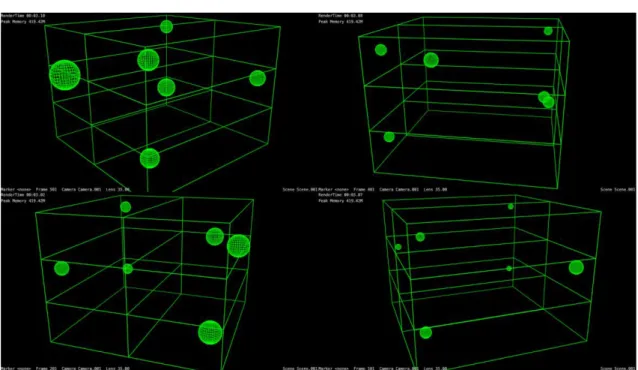
In our study, we have developed a tool for monitoring load averages of network devices. Load information of devices will be transferred from other systems like syslog, SNMP, etc. The Figure 12 shows the user interface of the tool. The information on load of devices should be displayed with information on physical positions. In our tool, sphere means each device, and the size of each sphere describes the status of load of each device. The big sphere means highly loaded device.
Figure 14: Firewall Verification Tools
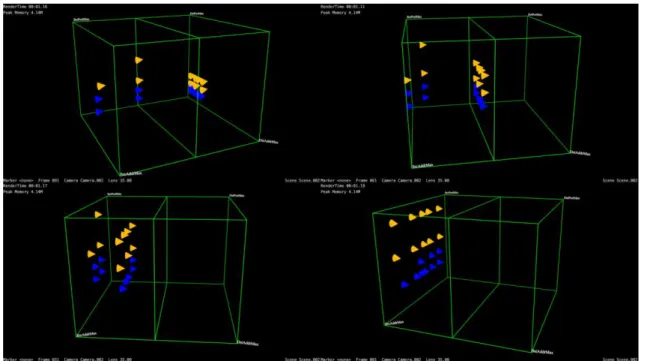
In this study, we have developed a tool for verifying a functionality of a firewall equipment. The Figure 14 shows the user interface of the tool. This tool shows two statuses of packets. Those are before reaching to the firewall and after going through the firewall. The face in the middle of the cube indicates the firewall node. Packet objects are sent from a one face toward to the other side face. If a packet should be dropped at the firewall, a packet object disappears at the face in the middle of the cube in the tool. This indicate that a packet had been dropped at the firewall in an actual network. If it does not disappear, it had passed through the firewall. Network operators can confirm the firewall settings by confirming that the packet drops at the firewall face.
The face where the packet is generated indicates source node. The vertical axes of the source node face indicate source IP addresses, and horizontal axes of the source node face indicates source port numbers. The face in the opposite side of source face indicates destination node. The vertical axes of the destination node face indicate destination IP addresses, and horizontal axes of the destination node face indicates
destination port numbers.
Figure 15: Source Code of the Firewall Verification Tool
The Figure 15 shows the source code of the tool, which based on the proposed architecture. The source code is more complex than two tools previously explained, because this tool require complex 3DCG animation for each packet. However, like the two tools described before, 3DCG code relating to 3D objects, lights and cameras is not required.
6. Evaluation
This section describes evaluation of the propose architecture. The evaluation consists of quantitative evaluation and quality evaluation.
6.1 Quantitative Evaluation
At first, we describe quantitative evaluation for the basic architecture we achieved.
Table 4: The Number of Codes of Experimental Network Monitoring Tools
As the number of codes are illustrated in the table, the proposed architecture is obviously effective because each tool consists of a few lines program code.
The reduction of codes might not be effective when it requires a creating dynamic object or a dynamic animation for many objects like FW checker in our study, because creating a dynamic object or creating a dynamic animation need several codes in the source code of tools.
On the other hand, in case of a getting dynamic information irregularly or the short amount of dynamic data as well as the wireless LAN AP Monitoring tool, the proposed architecture seems successful because the Blender processes much 3DCG data in advance because static setting does not require code.
6.1.2 Time Duration for Generating Movie File
It must be required that the monitoring tools using the proposed architecture generate a movie file within short enough short time. In our study, we have measured and evaluated the time of monitoring tools generated the movie file based on our proposed architecture. The primary factor of taking much time of rendering is the increasing number of objects in a 3D virtual space. Therefore, we have simulated and confirmed the case when the packets increase. The number of packets in the simulation is 1000. The Figure 16 shows the rendering time for each frame. In the middle of animation,
packets in the simulated environment reach the maximum number in the simulation. The red point indicates the rendering time using CPU. The blue point indicates the rendering time using GPU. In case of CPU, rendering time increases depending on the number of packets. In case of GPU, rendering time is stably low and it does not depend on the number of packets. The Table 5 shows the statistics information of the simulation.
Figure 16: Taime for Rendering Movie Frames
Table 5: Statistics Information of the Simulation
This result indicates that a programmer can develop a network operation and management tool based on our proposed architecture whose performance of movie creation does not rely on the number of packets when the system employ one or more GPU.
The Table 6shows the comparison of the previous methods and the proposed method. The primary advantage of the proposed method is to decrease a development cost by separating a logical part and a user interface part of development. As mentioned above, such an advantage is similar to the separation of HTML and CSS. In the previous methods, to develop network management or operation tools, a huge program code and high costs are required. In the proposed method, a tiny program code is enough.
Furthermore, 3D objects are able to be reused in other network management tools in our proposed method so that redevelopment cost will be more and more reduced.
However, as we have stated above, it is a trade-off between flexibility and easiness of development in many cases, therefore the consideration to flexibility and interactive user interface support in the proposed architecture are future works in our study.
7. Conclusion
This paper describes the basic architecture which is able to be used to develop 3DCG visualized network operation and management tools. The proposed architecture employs the Blender as the core software for generating 3DCG image files and movie files, and also employs the programming language Python as a programming language to control the Blender. By using those main softwares, the proposed architecture achieves network operation and management tools without high cost of development. This paper also states efficiency of the proposed architecture by illustrating some evaluations of the architecture. The future work of this study is to support interactive 3D user interfaces and to decrease time lag of generating movie files in the proposed architecture.
Reference
[1] NICTERWEB 2.0. http://www.nicter.jp/cube
DAEDALUSVIZ: Novel real-time 3D visualization for darknet monitoring-based alert system. Proceedings of the Ninth International Symposium on Visualization for Cyber Security, October 2012.
[3] Manish Karir Jon Oberheide, Michael Goff. Flamingo: Visualizing internet traffic. Network Operations and Management Symposium, 2006. NOMS 2006. 10th IEEE/IFIP,
April 2006.
[4] Blender Foundation. http://www.blender.org/.
[5] Python Software Foundation. https://www.python.org/.
[6] Erwan Le Malecot, Masayoshi Kohara, Yoshiaki Hori, and Kouichi Sakurai. Interactively combining 2D and 3D visualization for network traffic monitoring VizSEC ’06 Proceedings of the 3rd international workshop on Visualization for computer
security, November 2006.
[7] Harald Meyer, Thomas Odaker, and Karin Anna Hummel. OMVis: a 3D network protocol visualization tool for OMNeT++. SIMUTools ’10 Proceedings of the 3rd
International ICST Conference on Simulation Tools and Techniques, March 2010. [8] Troy Nunnally, Kulsoom Abdullah, Selcuk Uluagac, and Raheem Beyah. NAVSEC: A recommender system for 3D network security visualizations. Proceedings of the Tenth Workshop on Visualization for Cyber Security, October 2013.
[9] OpenGL – The Industry Standard for High Performance Graphics. http://www.opengl.org.
[10] GNU General Public License. https://www.gnu.org/licenses/gpl-3.0.en.html
[11] Brian R Kent. 3D Scientific Visualization with Blender. Morgan & Claypool Publishers, March 2015.
[12] W3C HTML. https://www.w3.org/html/.
近年、3 次元可視化型のネットワーク運用管理ツールの重要性が高まりつつある。3 次元可 視化型のネットワーク運用管理ツールはコンピュータネットワークの運用管理において有 用性は高いことが多い。しかしながら、3 次元可視化型のネットワーク運用ツールの開発に は、高度なスキルと大きなコストが必要となる。その一方で、3DCG 技術がより身近なもの となりつつある。これは、コンピュータハードウェアやソフトウェアの急速な発展や高性 能化によるものである。本研究では、3DCG ソフトウェア''Blender''およびプログラミング言 語''Python''を用いて、三次元可視化型のネットワーク運用ツールの基本アーキテクチャを構 築した。本論文では、その詳細、評価結果、効果について論じる。