J. Operations Research Soc. of Japan VoJ. 10, Nos. 3 & 4, June 1968
AIRLINE SYSTEMS SIMULATION
- A
COMPUTER SYSTEMJIRO KONDO University of Tokyo
(Received December 18, 1967)
Summary
ALSS (Airline Systems Simulation) is a computer program which simulates an operation of an airline company. Taking into account of passenger growth, airline networks, utilization of mixed fleet and competition with surface transport means, we can calculate an overall profit of an airline company, the number of carried passengers, the optimum number of flight service on each route and the optimum selec-tion of the type of aircraft.
Introduction
Selection of an adequate aircraft on each route is one of the most important desision-making business for top managements of an airline company. It depends upon the characteristics of route (passenger density, airport facilities, weather on the route, etc.)
Therefore, for the purpose of investigating specifications of the suit-able aircraft, for an airline comany, it will be necessary to simulate the
overall management of airline business. Lockhead [1] and Douglas [2J
have developed a system, simulating an airline operation. 145
J. Kondo
Monte Carlo method is extensively adopted for this kind of simula· tion, however it may require a large capability of computer. Consequently, it may take a lot of money and of time to accomplish a complete simulation of airline business, even now when the electronic computers have achieved a great progress.
In the present study, we have assumed:
(1) Cost being calculated by ATA formula [3]: Direct operating
cost and indirect operating cost are calculated by the new AT A formula of 1965-1966.
(2) Simultaneous operation of mixed fleet on a net work: Usually
air line company operates a various types of airplanes on her net work service routes. We can determine the optimum type of airplane adequate for the operation on each route.
(3) A mathematical model of passenger's behavior is introduced,
representing passenger's selection of suitable transport means.
(4) Utilization of aircraft in a year is assumed by the ATA formula.
(5) An introduction of evaluation function to an objective function
of airline operation, reflecting the policy of top management. ALSS Main Program
The ALSS main program is indicated in Fig. 1. As imputs, we
introduce:
(1) The net work characteristics: potential number of air passengers,
field length of airport, stage length.
(2) Direct operating cost and indirect operating cost are calculated
by the way of ATA formula revised in 1965-1966.
(3) Assuming the passenger's behavier, number of passengers carried
on each route is obtained.
(4) Profit=retail sales-cost on each (oute, is worked out.
(5) Taking into account of the potential uncarried passengers who
have transfers to the surface transportation means from air, a new ob-jective function is introduced.
seLection of the
optiml1.!l1. aircraft for each. route
StJll/JTliJzg
/Jp
themaximum profit t1IId ntmther of aircraft
OIl each rode
(6) Optimum frequency of service corresponding the maximum value ofthe objective function is determined. From the ATA utilization formula of aircraft, we can calculate the necessary number of aircraft to be able servicing the optimum frequency of flight on each route.
(7) Summing up the profit and number of aircraft, we can obtain the gross profit and total number of aircraft and also most suitable type of airplane can be determined.
A Mathematicl Model of Passenger's Behavior
Passenger's increasing characteristics according to the frequency of
flight service may be considered in the following way. In Fig. 2, D
Fig. 2.
stands for the daily potential air passenger on a particular route and the shaded area corresponds the number of passengers who are willing to
embark on the flight departing at the time To. Here we have assumed
that the need of travel for a particular person occurs uniformly in working hours of a day. We can easily modify the program to include the time variation of potential demand for air travel, if reliable statistics are available. As is indicated in the figure, we assumed that the probability
of taking a flight which is scheduled to depart at time To,
(1) P(To/t) =~2 1 exp (t-2 To)2 2
"V Ira (J
number of passengers who would like to book on the flight departing at
To, yields
(2 )
~
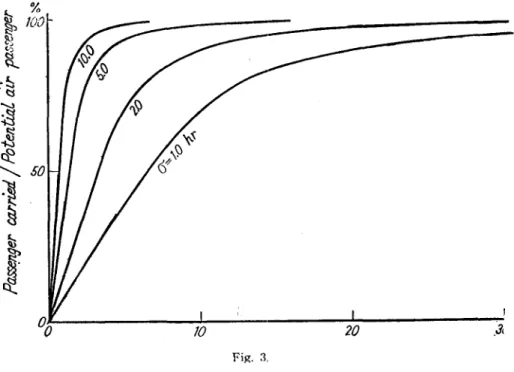
P(Tolt)dtDJ TI T - P" corresponds to the passengers who are forced to take other transportation means, like automobile or railway. Because there is the
limit S of payload of an aircraft, Pb does not always coincide with the
passengers carried on the flight To. Therefore, Pb-S means the
pas-sengers who can not embark on the flght To because of full booking.
Fig. 3 indicates the ratio Pbl D J TI T in terms of frequency of daily
service, we notice that the actualized ratio of potential air passengers
depends on a representing the passenger's characteristics.
Objective Function of Air Line Business The profit of airline company is defined as
(3 ) P=ax-c,
where a is transportation fare and c is operating cost while x is, a random
variable representing the number of carried passengers. Consequently
ax stands for revenue, and the profit is represented as (1).
Using the statistics of carried passengers we find that the load factor,
corresponding the maximum profit, is about 80-90'7'0.
This does not represent the actual situation of airline companies.
Their aim of operation is likely to achieve 50-60'7'0 in terms of load
factor. However, it is rather difficult to evaluate the value of airline operation and almost impossible to ask the objectives or policy of man· agements. Considering the publicity of transportation business and rapid growth of passengers, the air line company should try to carry potential air passengers as much as possible.
Hence, we introduce a generalized profit which is defined as
(4 ) Pr;=ax-c-a(D-x), if D>x,
in place of (1), where a means a potential loss caused by missing one
customer, and D is a potential air passenger. Therefore D-x is expressing
the number of passengers who transferred to the other air line or the other means of transportation.
We assumed
(5 ) a=1/2a,
in the following analysis, and find the way of operation that maximizes the generalized profit.
151
Model Airline Operation
Table 1 is an example of ALSS output, when it is applied to a model airline net work, as indicated in Fig. 4.
Fig. 4.
Number of passengers carried on each route, revenue income, number of flight, types of aircraft, optimum for each route, etc., obtained as out-puts of ALSS.
We also investi~ated the appropiateness of the output of ALSS when
it is applied to the all Japan domestic operation in the past. Table 2
indicates the outputs which are similar to Table 1.
Each of these figures indicate reasonable values when compared with the statistics of 1966.
European Continental Operation
ALSS is applied to simulate the all European airline operation. The leading 80 air routes (80 major sectors) are selected and prediction of air traffic in the summer of 1978 on each route is introduced as input of ALSS.
The necessary number of each aircraft composing the optimum fleet coresponding to the maximum generalized profit has been obtained.
t-:l I>l
C'"
Cb .~
AIRLINE SYSTEM SIMULATION (ALSS)
..
___ .!:.!.!.!U.S.1.~.,-Ill.""2' _ _ _ _ _ _ _ _ _ _ _ _ _ _ _ _ _ _ _ _ _ _ _ _ _ _ _ _ _ _ _ _ ----j
r-.
t---CDDAILY'1I0'I' ,d" L I NE ~ 9766 ,POTHST I (VDAII.'t' C"'Lh,"",1 R"lL;;.I~.E;---"----,,,,, cOst 31103 . . - , @GEHERAl.llEO ... ,..;OIT"""',",,,'" PRO,.IT--·--r0246I
_
CAlL" " . , ~~ _ _ D_An'f' 'A)t',~.MI ""114; @, ... .!!'e"'R .... .,''--''LO'''.'''0--1.'''.'''-C.!jIO'''R'-_ • .,,''' • .2C''.,7'---_ _ _ _ _ _ - - - / (f'LEUh..---_ _ _ _ _ _ ~~IJ_43 _-...---!..t-'1' ____ _
.•• xxx 1 DIST.I FQ. ___ itF';'RE. __ ~1 TSIGi'lU g,U q~DfM,U~O. llO ___ (j~_SDD~~ ~'LALTERNlT" atl
IH $ .. ute_s.,OOL O~ REVEo.JUE RATE.loCOO ~ __ ~AU'
-.J
•
:t~~g:;:::~ ~~~t~ t~~~;=:;;::
~~~~:~:~:: ;i~:::!;~:~ ~1~H:~=g~{fg·:~*~l---j.-
~(j)~QfcolfqpAI.I.Oij,PA. q,rJiiEb, @PlltO'IT ~~.~~.~@."VII./" ~(·A/C IIIQ, ~GEN.pR no.os 0.50 3784 '0 u 4 .U36 4!5 202 2u 0 '03 .~ 1.ln 1,'1 .DI~ _ _ '_'~~ _ _ TSJQ~~-.!---h6" DeMAND.. 300 SDDioINOI 1'0 ALTE'UUT'I 200
WARE-l,DOI. ._ ~EYE~UE RATE.l'O~ __ E n'ATfO lit , ~
~ IIB-UX
1. PROFIT(i.e.REVENUE·COST) OF TOTAL SYSTEM(U.S.$) FOR OPTIMUM OPERATION.
2. DIRECT AND INDIRECT COST OF TOTAL SYSTEM, ACCORDING TO THE ATA STANDARD METHOD(U.S.$).
3. IMAGINARY PROFIT ASSUMING THE FARE TO BE 1.5 TIMES THE ACTUAL OPERATION IS DEFINED TO BE OPTIMUM
WHEN GENERALIZED PORFIT OF EACH ROUTE IS MAXIMUM,
TO ACCOUNT FOR THE EFFECTS OF COMPETITION, PUBLIC
SERVICES, POLICIES TO STIMULATE FURTHER GROWTH OF PASSENGER. etc. (U.S.S).
4. TOTAL NUMBER OF PASSENGERS DE VIDEO BY TOTAL NUMBER OF AVAILABLE SEATS.
5, OPTIMUM FLEET COMPOSITION(NAME AND REQUIRED NUMBER OF AIRCRAFT l.
6. ROUTE CONNECTING A PAIR OF AIRPORTS,
7, DISTANCE BETWEEN AIRPORTS ALONG THE AIR ROUTE(N.M,) B. FARE CORRESPONDING TO AVERAGE U.S. DOMESTIC SERVICES.
(U.S.S)
9. AVERAGE TIME DURATION FOR MOST Of PASSENGERS TO WAIT FOR FLIGHT INSTEAD OF CHANGING TO SURFACE
TRANSPORT ATIONS(HOUR)
10. DAILY POTENTIAL AIR PASSENGER DEMAND(TOTAL OF BOTH WAYS) DEFINED AS TOTAL NUMBER OF PASSENGER WILLING
TO USE AIR TRANSPORTATION IF AVAILABLE AT HIS
CONVENIENCE.
11. STANDARD DEVIATION OF POTENTIAL PASSENGER DEMAND INCLUDING EFFECTS OF DAILY AND SEASONAL VARIATIONS,
12. DISTANCE TO ALTERNATE AIRPORT(NM)
13. PASSENGER SHARE OF THE AIRLINE AS COMPARED WITH COMPETING AIRLINES ON THE SAME ROUTE.
14. ACTUAL REVENUE DEVIDED BY(FARE·:NO. OF PASSENGER CARRIED}
15. BLOCK TIME (HOUR)
16. TOTAL DAILY COST FOR EACH ROUTE(U,S. $.)
17. ALLOWABLE NO. OF PASSENGER TO BE CARRIED FOR EACH FLIGHT.
18. OPTIMUM FREQUENCY OF SERVICE(ONE WAY) FOR GIVEN AIRCRAFT AND DEMAND.
19. MET DAILY PROFIT FOR EACH ROUTE(REVENUE·COST}. MINUS SIGN
MEANS THAT OPERATIONS ARE CONTINUED FOR PUBLIC SERVICES OR IN VIEW OF FUTURE GROWTH OF PASSENGERS.
20. STANDARD DEVIATION OF PROFIT.
21. DAILY NUMBER OF PASSENGER APPEARING AT SALES COUNTERS(BOTH WAYS).
22. DAILY NUMBER OF PASSENGERS CARRIED BY AIR(BOTH WAYS),
23. AVERAGE LOAD FACTOR FOR OPTIMUM OPERATION.
24. NUMBER OF AIRCRAFT REQUIRED FOR OPERATION OF EACH ROUTE.
25. GENERALIZED PROFIT FOR EACH ROUTE. OPERATION IS PLANNED TO MAXIMIZE THIS, AND IF MAXIMIZED GENERALIZED PROFIT IS NEGATIVE, OPERATION IS GIVEN UP,
""
~ !-oo~
t
AIR LINE' JAPAN~~G ____ .
DA1~Y. PROFIT 45S0U69 DAILY COST ~a70n467 GENERAL.gEQ PROP)T .1a67934&8
DULY
;thr
?~58? DAl~Y !'AX.N!". "113Aa'______ _ 9727 1.2.83.
YS-l1. 22,41
r.21 .64 •• 7
·SPK.WKD.· .J)j$.T~. 91 1'~~6n TSIGHA' .. hQ.L_ n~MANP'_---.30a ____ SPJl!jNll".U~ ALTeeNAIEao 2U·
RUNWAY "cNGTM., 3940
Ale TB COST -A •• OW,PAX fRoa, 'PROFIT SOPRrT PAX poS---fv.-C-lF" Ale REi:i;-:-JjfIfIl".,lI
9727 0 61 Q ,51 0 0 '0 0 0 0,000 0,000 0,
.YSoi'l 0.66 914922 ~o 3 _261Gij8 1'0247 1'~· 153 0.424 0.714· 95829
______ .* _P.27 1l....2L... ... 1.11JllU1tJ1 ·4D 4 01~5245 ,-hoe? 194 189 •• 59_0 __ ._ .. ~ _Z16ll.a
_ $PK.OBW.· 01 SI,' 89_ _ rARSo .511 TSIGH.. 0.&7 lleHANDI!;. a" SDDHND. 1~8 ._AJ.t~20J! ____ _
..,
RUNWAY LeNGTH. 3940E
---A-;-I7iC;----·I9;;---. . C"'O .. ST ... A.,..I.I.,.,O;;uW.PAX~ ·pROFIT SP9RrT PAX POll AV.vt ;,/e R~Q.·,.N."""·-·-Il Y~m ~:~; 95;;U'~ ~~
-+--
.26685~ ~4444g 15§ 15~~: ~~g ~:m
162~~~ E.?? 0.68 123083' 40 5 _,S1744 ~6i71:S '238 23.3 Q.~81· 1,20;' 342799
·.SPK.KUW. OIST.o 145 rARe- '-819 TSIGH •• 2.iO O_EHANOF· .. _ 0 SODHNO. .ALTERNATE",200; RUNWAY LENGTH. 3940
Ale Ta COST -Al:Low-;:n:x--rRra.---m'jT--SOPlll'T--.cp~OS-AV.L/f-:-·-· AlC REQ, 0_11 ... "'"
9721 Din n 51 Q 0 0 Q 0 o.oPO 0.000 0
YS.ll: 0.61 0 ·60 0 0 0 0 0 0,000 0.000 0
ft?? 0.93 0 4D 0 Q Q 0 Q R,ogo 0,004 P
_ _ .. ~.Q.fUi..~.K.UH*: ~. D:1.Sr.a, .43· F")'Re. 322:6 TSIGHAR "._1. n;:M.iWna; "',.." .~nnMtJl'ul Jlti§A JI "S::::UJ.l~~.l aftft
~UNWAYLeNGTH.- 3940 ... .
Ale TB C06T ALLOW,PAX FR.a. PROrJTSPPRrTPAX PGS AV,~IF' Ale REO •. Olll,,",!
8727 0,50 Q ' 21 Q 0 0 0.000 0.000 "
YS.11 0.41 ·0 60 0 0 0 0,000 0.000 0
~ . , 0,47 0 40 0 0 0 O.QOQ g,ooo L
-t11 rARe. ,.
·~H. '940
OEMAtiO_· Ul!. AI, TliRNAIE., 2"
--sppfif;-' ~.
....
154 J. Kondo
prospective aircraft no. of passenger no. of aircraft
YX 097 30 11 098 50 0 099 75 2 100 100 8 101 150 17 102 200 50 103 250 74 104 300 17
The result shows a considerable coincidence with the conclusion ob· tained previously by a separate analysis [4].
Conclusion and Remarks
A computer program is developed to simulate the overall operation of airline network. In the course of development, a mathematical model representing passenger's behavior and a new objective function reflecting the airline policy are introduced. For the cost estimation the new AT A formula are extensively applied.
We can determine the most profitable selection of aircraft on each route and the optimum number of flight as well as the necessary number of airplanes. The program will be utilized for the purpose of operations research for an aircraft manufacturer and at the same time it will become a useful tool of decision making for an airline company who is looking
forward to introduce a new type of aeroplane. It can also furnish the
optimum schedule of flight service when the potential passengers on a route is known.
This work is sponcered by the Ministry of International Trade and Industry under the contract with the Society of Japanese Aircraft Con· structors. The work is conducted at the Operations Research Center of SJAC.
REFERENCES
[ 1] Gunn, W.A., "Systems Simulation of Airline Operations," Operations Research,
12, 1 (1964), 206-229.
[2] Kingsley, J.D., "Airline Operations and Planning Model," [FORS, IV, (1965),
Preprint.
[ 3] Air Transport Association of America, Standard Method of Estimating Comparative Direct Operating Costs of Airplanes, June 1966, Draft, June 1965, Draft, June 1966.
[ 4 ] Wheatcroft, S., European Shorthaul Aircraft Requirements in 1978., A Report for Rolles-Royce Limited, (1966).