doi: 10.1253/circj.CJ-18-1107
concentration measured by the ESI-MS/MS method was not elevated in patients with chronic HF at any level of severity as assessed by NYHA classification.8 However,
cardiac patients with a lower LV ejection fraction (EF) or dilated LV end-diastolic dimension (LVDd) showed a higher plasma adenosine concentration, suggesting that endogenous adenosine counteracts LV dysfunction and LV dilation in patients with heart disease.8
However, changes in the plasma adenosine concentration after acute myocardial infarction (AMI) and the effect of endogenous adenosine on LV function and LV dilation in the chronic phase are still unknown. Therefore, in the present study, we examined whether the plasma adenosine concentration increases after AMI and if endogenous adenosine improves LV function and attenuates LV dilation in the chronic phase 6 months after AMI.
E
ndogenous adenosine is reported to trigger ischemic preconditioning of the heart.1,2 It has also beenreported that administration of adenosine or an adenosine analog before prolonged ischemia protects the heart and reduces the size of the myocardial infarct,3,4 and
that an adenosine A1 receptor agonist improved left ventricular (LV) function and remodeling in dogs with advanced heart failure (HF).5 These reports suggest that
adenosine is a cardioprotective agent. Some have reported that the plasma adenosine concentration is elevated in patients with chronic HF, and that the extent of the increase in plasma adenosine concentration correlated well with the severity of chronic HF as assessed by NYHA classification;6 however, others have reported that the
plasma adenosine concentration did not differ between normal subjects and patients with NYHA class III chronic HF.7 We recently reported that the plasma adenosine
Received October 22, 2018; revised manuscript received December 26, 2018; accepted January 9, 2019; J-STAGE Advance Publication released online February 26, 2019 Time for primary review: 26 days
Department of Cardiology, Gifu University Graduate School of Medicine, Gifu (M.H., T.T., Shingo M., Y.Y., H.K., M.K., K.N., Shinya M.); Laboratory of Pharmaceutical Analytical Chemistry, Gifu Pharmaceutical University, Gifu (Y.E., B.U.), Japan Mailing address: Shinya Minatoguchi, MD, PhD, Department of Cardiology, Gifu University Graduate School of Medicine, 1-1
Yanagido, Gifu 501-1194, Japan. E-mail: minatos@gifu-u.ac.jp
ISSN-1346-9843 All rights are reserved to the Japanese Circulation Society. For permissions, please e-mail: cj@j-circ.or.jp
Increased Plasma Adenosine Concentration in the Subacute
Phase May Contribute to Attenuation of Left Ventricular
Dilation in the Chronic Phase in Patients With
Acute Myocardial Infarction
Masanori Hatasa, MD; Toshiki Tanaka, MD, PhD; Shingo Minatoguchi, MD, PhD; Yoshihisa Yamada, MD, PhD; Hiromitsu Kanamori, MD, PhD;
Masanori Kawasaki, MD, PhD; Kazuhiko Nishigaki, MD, PhD; Yukihiro Esaka, PhD; Bunji Uno, PhD; Shinya Minatoguchi, MD, PhD
Background: Changes in the plasma adenosine concentration and the effects on left ventricular (LV) function and remodeling in
patients with acute myocardial infarction (AMI) remain unclear.
Methods and Results: In 58 patients with AMI and 14 subjects without cardiac disease (controls), we measured the plasma adenosine
concentration by LC-MS/MS. Blood samples were taken from the antecubital vein on days 0, 1, 7, and 14 after AMI, and from the controls on admission. Cardiac echocardiography was performed in the acute (within 7 days) and chronic (6 months) phases of AMI. There were no significant differences in the plasma adenosine concentrations among days 0 (211.5±150.2 nmol/L), 1 (192.7±141.3 nmol/L), 7 (218.8±154.1 nmol/L), and the controls (136.0±50.9 nmol/L). The plasma adenosine concentration increased significantly on day 14 (321.1±195.4 nmol/L) after AMI as compared with days 0, 1 and 7. AMI patients with a greater increase in the plasma adenosine concentration in the subacute phase showed an attenuation of LV dilation in the chronic phase. The plasma adenosine concentration in the acute phase did not affect the LV ejection fraction in the chronic phase.
Conclusions: The plasma adenosine concentration significantly increased 14 days after AMI, which may contribute to attenuation
of LV dilation in the chronic phase.
Key Words: Acute myocardial infarction; Left ventricular dilation; Left ventricular ejection fraction; Plasma adenosine concentration
2 HATASA M et al.
months after the onset of AMI.
The protocol was approved by the Ethics Committee of Gifu University Graduate School of Medicine (approval no. 27-394). All patients provided written informed consent before the study commenced. The investigation conformed with the principles outlined in the Declaration of Helsinki (BMJ 1964; ii: 177). The public trial registry number was R000026665.
Evaluation of LV Function and Dilation
Echocardiography (iE33, PHILIPS, Tokyo, Japan) was performed to measure the LVEF (i.e., LV systolic function) and LVDd within 7 days (acute phase) and at 6 months (chronic phase) after the onset of AMI.
Measurement of Plasma Adenosine Concentration
For AMI patients, blood samples (1 mL each) were taken from the antecubital vein for measurement of the plasma
Methods
Subjects
The study group comprised 58 patients with AMI (AMI group) and 14 patients without cardiac diseases who were admitted to Gifu University Hospital & Takayama Red Cross Hospital. Patients with normal heart function based on echocardiography and a normal ECG were enrolled as a control group. They underwent echocardiography because of some anterior chest complaints but did not have any cardiovascular diseases. The diagnosis of AMI was based on the presence of prolonged anterior chest pain, ST-segment elevation on ECG, and an occluded coronary artery on coronary angiography. AMI patients were treated with percutaneous coronary intervention followed by standard pharmacological treatment. The patients were enrolled consecutively into the AMI or control group. Of the 58 patients with AMI, 38 were followed up for 6
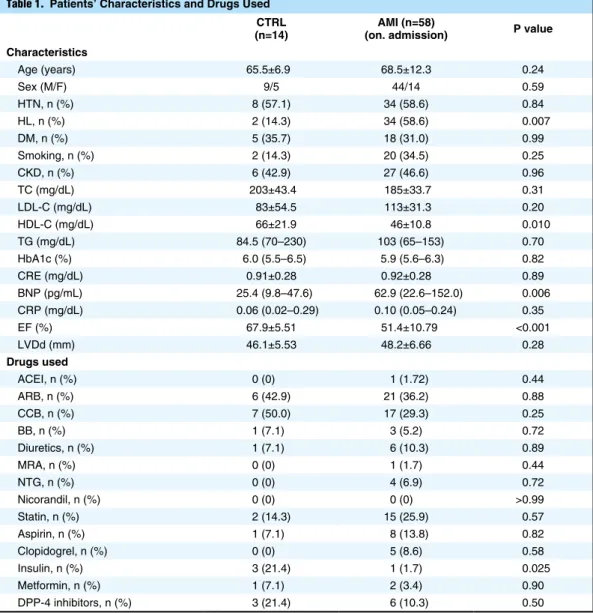
Table 1. Patients’ Characteristics and Drugs Used CTRL
(n=14) (on. admission)AMI (n=58) P value Characteristics Age (years) 65.5±6.9 68.5±12.3 0.24 Sex (M/F) 9/5 44/14 0.59 HTN, n (%) 8 (57.1) 34 (58.6) 0.84 HL, n (%) 2 (14.3) 34 (58.6) 0.007 DM, n (%) 5 (35.7) 18 (31.0) 0.99 Smoking, n (%) 2 (14.3) 20 (34.5) 0.25 CKD, n (%) 6 (42.9) 27 (46.6) 0.96 TC (mg/dL) 203±43.4 185±33.7 0.31 LDL-C (mg/dL) 83±54.5 113±31.3 0.20 HDL-C (mg/dL) 66±21.9 46±10.8 0.010 TG (mg/dL) 84.5 (70–230) 103 (65–153) 0.70 HbA1c (%) 6.0 (5.5–6.5) 5.9 (5.6–6.3) 0.82 CRE (mg/dL) 0.91±0.28 0.92±0.28 0.89 BNP (pg/mL) 25.4 (9.8–47.6) 62.9 (22.6–152.0) 0.006 CRP (mg/dL) 0.06 (0.02–0.29) 0.10 (0.05–0.24) 0.35 EF (%) 67.9±5.51 51.4±10.79 <0.001 LVDd (mm) 46.1±5.53 48.2±6.66 0.28 Drugs used ACEI, n (%) 0 (0) 1 (1.72) 0.44 ARB, n (%) 6 (42.9) 21 (36.2) 0.88 CCB, n (%) 7 (50.0) 17 (29.3) 0.25 BB, n (%) 1 (7.1) 3 (5.2) 0.72 Diuretics, n (%) 1 (7.1) 6 (10.3) 0.89 MRA, n (%) 0 (0) 1 (1.7) 0.44 NTG, n (%) 0 (0) 4 (6.9) 0.72 Nicorandil, n (%) 0 (0) 0 (0) >0.99 Statin, n (%) 2 (14.3) 15 (25.9) 0.57 Aspirin, n (%) 1 (7.1) 8 (13.8) 0.82 Clopidogrel, n (%) 0 (0) 5 (8.6) 0.58 Insulin, n (%) 3 (21.4) 1 (1.7) 0.025 Metformin, n (%) 1 (7.1) 2 (3.4) 0.90 DPP-4 inhibitors, n (%) 3 (21.4) 6 (10.3) 0.50
ACEI, angiotensin-converting enzyme inhibitor; ARB, angiotensin II receptor blocker; BB, β-blocker; BNP, B-type natriuretic peptide; CCB, calcium-channel blocker; CKD, chronic kidney disease; CRE, creatinine; CRP, C-reactive protein; DM, diabetes mellitus; EF, ejection fraction; HbA1c, hemoglobin A1c; HTN, hypertension; HL, hyperlipidemia; LVDd, left ventricular end-diastolic dimension; MRA, mineralocorticoid receptor antagonist; NTG, nitroglycerine; TC, total cholesterol; TG, triglyceride.
conditions without ionic suppression caused by matrix compounds in human plasma. The calibration curve was linear across the examined dynamic range from 10 to 500 nmol/L (r=1.000). The relative standard deviations of the MS/MS responses with 6 trials were 2.17%, 2.71%, 2.24%, and 1.82% for plasma samples containing 10, 50, 100, and 500 nmol/L adenosine, respectively. The detailed analytical procedures and validation for the ESI-MS/MS method have been published.9
Blood Biochemical Analysis
Blood biochemical analyses for creatine kinase (CK), aspartate aminotransferase (AST), alanine aminotransferase (ALT), lactate dehydrogenase (LDH), creatinine (CRE), blood urea nitrogen (BUN), C-reactive protein (CRP), hemoglobin A1c (HbA1c), total cholesterol (TC), low-density lipoprotein cholesterol (LDL-C), high-low-density lipoprotein cholesterol (HDL-C), triglycerides (TG), and B-type natriuretic peptide (BNP; Shionoria BNP RIA kit; Shionogi, Osaka, Japan) were performed.
Drugs used and complications in patients were examined. Statistical Analysis
The data are shown as mean±1 standard deviation. Cate-gorical data are summarized as percentages and were compared with a chi-square test or Fisher’s exact test. The normality of data distributions was tested using the Kolmogorov-Smirnov test. The significance of the differ-ences between groups for variables that were normally distributed was determined by an unpaired Student’s t-test. Otherwise, a Mann-Whitney U test was used to compare the differences between groups. Effects of drugs on echo-cardiographic parameters were assessed by univariate analysis. P<0.05 was considered significant. All statistical adenosine concentration on days 0, 1, 7 and 14 after the
onset of AMI. We defined days 0, 1, and 7 (within 7 days) as the acute phase and day 14 as the subacute phase of AMI. Blood samples were collected into sterile tubes containing EDTA, immediately placed on ice, and then centrifuged at 10,000 g for 15 min. Plasma was then collected and frozen at −83°C until further analysis. Blood samples are conventionally collected in tubes containing dipyri-damole, 2’-deoxycoformycin and EDTA to block the degradation of adenosine.6,7 However, it was recently
confirmed that blood collection without dipyridamole and 2’-deoxycoformycin combined with measurement of the plasma adenosine concentration using the highly sensitive ESI-MS/MS method combined with Hydrophilic interac-tion chromatographic (HILIC) separainterac-tion meninterac-tioned below,9 yields relatively accurate levels of adenosine in
plasma.8 Therefore, in the present study, we used tubes
containing only EDTA to collect blood samples.
Plasma adenosine concentrations were measured using a Prominence HPLC system (Shimadzu, Japan) equipped with a 3200 QTRAP MS/MS system with a Turbo V source and an ESI probe (AB SCIEX, Canada). HILIC separation was performed on a Tosoh TSKgel Amide-80 column (3 μm, 150×2.0 mm i.d.) with a mobile phase consisting of water and acetonitrile (linear gradient: 100‒90% acetonitrile over 12 min followed by 90‒30% over 8 min) at a flow rate of 0.2 mL/min at 40°C. We recently developed an ESI-MS/MS method to determine adenosine in human plasma combined with HILIC separation after simple pretreatment consisting of deproteinization and ultrafiltration.9 This method gives highly sensitive and
reproducible multiple-reaction monitoring signals of adenosine (m/z: 268.1/136.1) and 15N5-adenosine (m/z: 273.1/141.1) as an internal standard under positive ESI
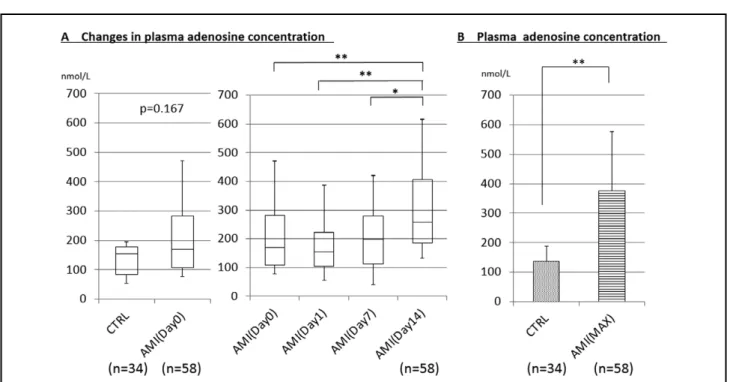
Figure 1. Plasma adenosine concentrations in the peripheral blood. (A) Changes in the plasma adenosine concentration on days
0, 1, 7 and 14 after acute myocardial infarction (AMI). (B) Maximum (MAX) plasma adenosine concentrations after AMI and in the control patients (CTRL). *P<0.05, **P<0.01.
4 HATASA M et al.
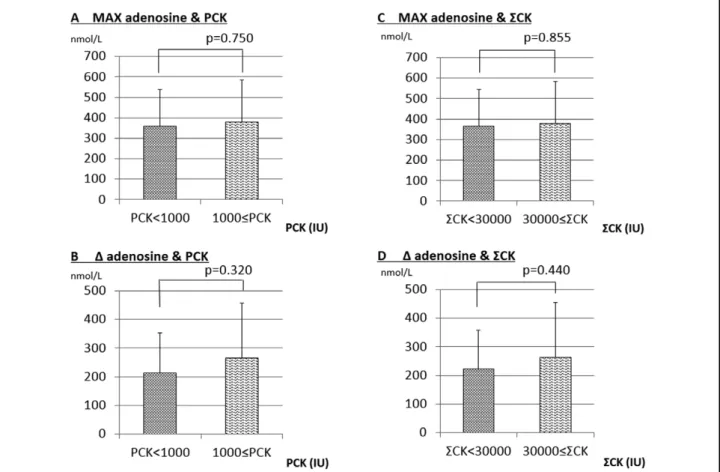
concentration on other days (i.e., day 0, 1, 7, or 14). There-fore, we determined the maximum plasma adenosine concentration (Max adenosine) of each patient regardless of the day after AMI onset, and compared it with the plasma adenosine concentrations in the control group. Max adenosine in the AMI group was significantly greater than in the control group (P<0.01; Figure 1B). Peak CK (PCK) and the sum of CK (ΣCK) are reported to be indicators of myocardial infarct size,10 so we measured CK
at 8 points during days 0–2. The highest value of CK was defined as PCK. When AMI patients were divided into 2 groups (PCK <1,000 IU and PCK ≥1,000 IU), Max adenosine was not different between them (P=0.750; Figure 2A). ∆Adenosine (Max adenosine - minimum plasma adenosine concentration) was not different between the group with PCK ≥1,000 IU and the group with PCK <1,000 IU (P=0.320; Figure 2B). Similarly, when the AMI patients were divided into 2 groups according to ΣCK (ΣCK <30,000 IU and ΣCK ≥30,000 IU), Max adenosine was not different between the 2 groups (P=0.855, Figure 2C). ∆Adenosine was also not different between them (P=0.440, Figure 2D).
analyses were performed using Stat View version 5.0 (SAS Institution Inc., Cary, NC, USA).
Results
Patients’ Characteristics and Drugs UsedPatients’ characteristics and drugs used are shown in Table 1. The incidence of HL was greater in the AMI group than in the control group. BNP was higher and HDL-cholesterol was lower in the AMI group than in the control group. EF was lower in the AMI group than in the control group. The incidence of drugs used, such as insulin, was lower in the AMI group than in the control group. Plasma Adenosine Concentrations
On day 0, the plasma adenosine concentration was not significantly different between the AMI group (211.5± 150.2 nmol/L) and control group (136.0±50.9 nmol/L) (Figure 1A). The plasma adenosine concentration in AMI patients did not increase on day 1 (192.7±141.3 nmol/L) or day 7 (218.8±154.1 nmol/L) but significantly increased on day 14 (321.1±195.4 nmol/L) compared with days 0, 1, and 7 (Figure 1A). The changes in the plasma adenosine concentration described during days 0–14 in the AMI group (Figure 1A) were typical of most of the AMI patients, although some patients exhibited a peak plasma adenosine
Figure 2. (A) Maximum plasma adenosine concentration (MAX adenosine) in AMI patients with peak CK (PCK) <1,000 IU and
those with PCK ≥1,000 IU. (B) ∆adenosine in AMI patients with PCK <1,000 IU and those with PCK ≥1,000 IU. (C) MAX adenosine in AMI patients with ΣCK <30,000 IU and those with peak ΣCK ≥30,000 IU. (D) ∆adenosine in AMI patients with ΣCK <30,000 IU and those with peak ΣCK ≥30,000 IU. AMI, acute myocardial infarction; CK, creatine kinase.
∆adenosine between the patients with positive ∆EF (263.7± 182.2 nmol/L) and negative ∆EF (313.6±108.6 nmol/L) (Figure 4D).
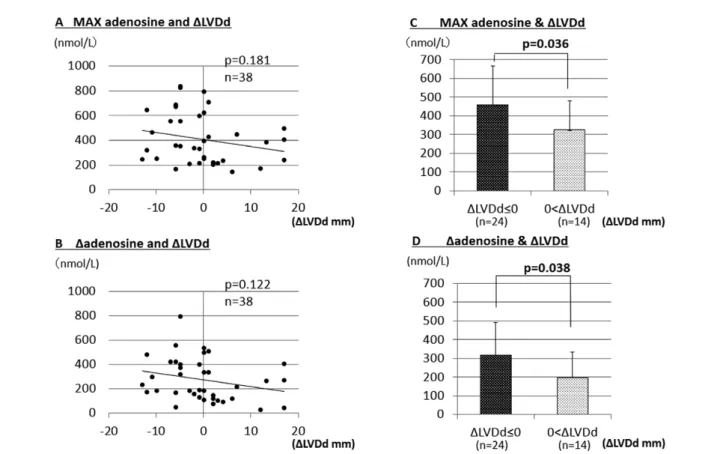
LV Dilation and Plasma Adenosine Concentration
Of the 58 AMI patients subjected to acute-phase analysis (days 0–7 after onset), 38 were followed until 6 months after AMI (chronic phase) to measure the LVDd. LV dilation, which indicates HF, is generally assessed by an increase in LVDd between the acute and chronic phases. The difference between LVDd in the acute and chronic phases (LVDd in the chronic phase - LVDd in the acute phase) was defined as ∆LVDd. Max adenosine tended to inversely correlate with ∆LVDd (P=0.181) (Figure 5A). ∆Adenosine also tended to inversely correlate with ∆LVDd (P=0.122) (Figure 5B). We divided the patients into 2 groups: a positive ∆LVDd group (LVDd increased in the chronic phase, ∆LVDd >0, suggesting progression to LV dilation) and a negative ∆LVDd group (LVDd decreased in the chronic phase or remained unchanged from the acute phase, ∆LVDd ≤0, suggesting attenuation of LV dilation). Max adenosine was significantly higher (P=0.036) in the negative ∆LVDd group (458.0±208.1 nmol/L) than in the positive ∆LVDd group (324.7±154.7 nmol/L) (Figure 5C). ∆Adenosine was significantly higher (P=0.038) in the negative ∆LVDd group (317.4±174.0 nmol/L) than in the positive ∆LVDd group (196.7±139.0 nmol/L) (Figure 5D). Factors Affecting LVEF and LV Dilation
In the univariate analysis, many factors that may be asso-Relationship Between Plasma Adenosine Concentrations
and Age, Sex, Hypertension, Diabetes Mellitus, and Hyperlipidemia
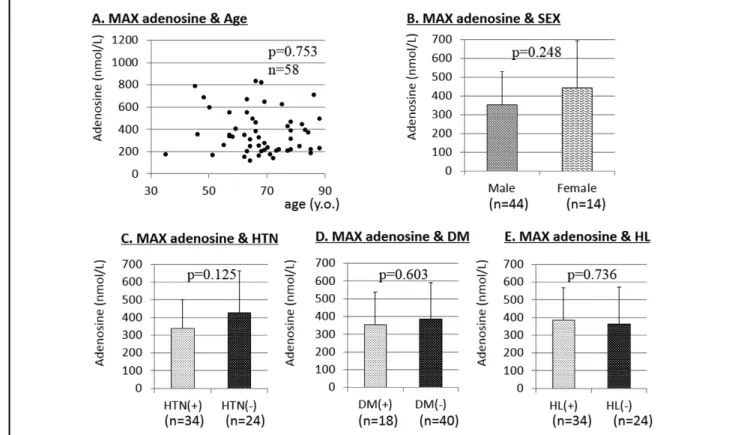
We included only AMI patients in these analyses. There was no relationship between the plasma adenosine concentra-tion and age (P=0.753; Figure 3A). There was no difference in plasma adenosine concentrations between male and female patients (P=0.248; Figure 3B), between patients with and without hypertension (P=0.125; Figure 3C), between patients with and without diabetes mellitus (P=0.603; Figure 3D), or between patients with and without hyperlip-idemia (P=0.736; Figure 3E).
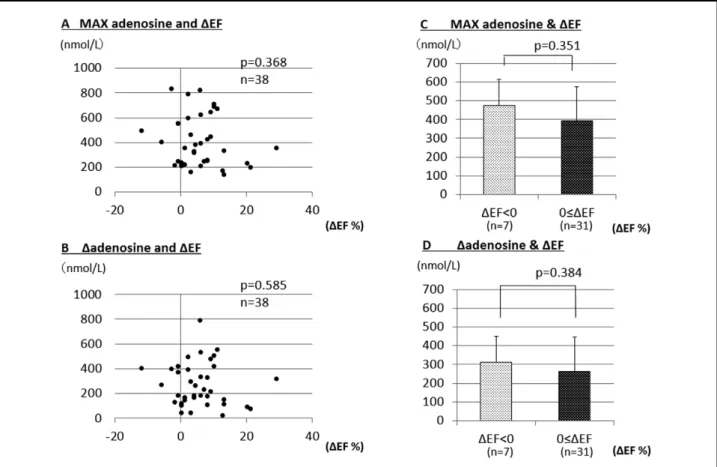
LV Function and Plasma Adenosine Concentration
Of the 58 AMI patients subjected to acute-phase analysis (days 0–7 after onset), 38 were followed until the chronic phase (6 months after AMI) to measure the LVEF. The difference between the EF in the acute and chronic phases (EF in the chronic phase – EF in the acute phase) was defined as ∆EF. ∆EF did not correlate with Max adenosine (P=0.368; Figure 4A) or ∆ adenosine (P=0.585; Figure 4B). When patients were divided into 2 groups based on ∆EF, positive ∆EF (EF increased in the chronic phase or remained unchanged from the acute phase, ∆EF ≥0; n=31 ) and negative ∆EF (EF decreased in the chronic phase compared with the acute phase, ∆EF <0; n=7 ), there was no significant difference in Max adenosine (P=0.351) between the patients with positive ∆EF (394.1±199.1 nmol/L) and negative ∆EF (474.6±194.9 nmol/L) (Figure 4C), and also there was no significant difference (P=0.384) in
Figure 3. Relationship between maximum (MAX) adenosine and (A) age, and (B) sex. MAX adenosine in the absence and
6 HATASA M et al.
release is accelerated by a short period of myocardial ischemia such as ischemic preconditioning.11 However,
changes in the plasma adenosine concentrations in patients with AMI caused by chronic myocardial ischemia, but not to short periods of ischemia, are still unknown. In the present study, there was no significant difference in the plasma adenosine concentrations between the controls and that on day 0 after AMI. The plasma adenosine concen-tration did not significantly increase on day 1 or 7 after AMI compared with that on day 0. The plasma adenosine concentration, however, significantly increased on day 14 compared with that on days 0, 1 and 7 after AMI (Figure 1). This means that MI in the acute phase does not necessarily increase the plasma adenosine concentration. Because the plasma adenosine concentration did not increase within 7 days after AMI, the reason why it increased on day 14 after AMI may involve factors other than solely myocardial ischemia. We recently reported that the plasma adenosine concentration increased in cardiac patients with LV dilation or LV dysfunction (reduced EF), suggesting that an elevated plasma adenosine concentration might counteract LV dilation or LV dysfunction.9 As a matter of fact,
adenosine agonists have been reported to attenuate LV remodeling and improve LV function in animal models of MI12 and advanced HF.5
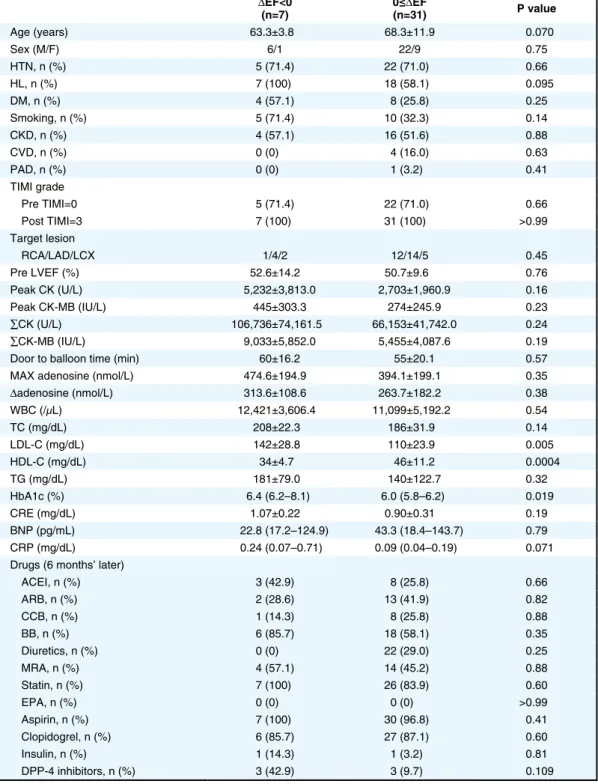
Although the precise mechanisms by which the plasma ciated with LVEF and LV dilation were compared between
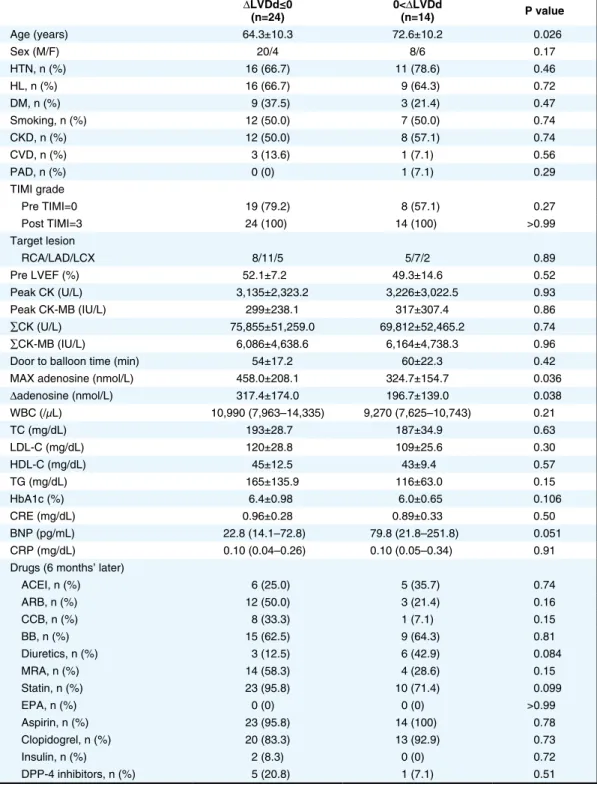
the negative and positive ∆EF groups (Table 2), and between the negative and positive ∆LVDd groups (Table 3). Concerning ∆EF, among the factors, high HDL-C was associated with a positive ∆EF (Table 2), and high LDL-C and high HbA1c were associated with a negative ∆EF (Table 2). High Max adenosine and high ∆adenosine were not associated with a positive ∆EF (Table 2). Concerning the ∆LVDd, Max adenosine and ∆adenosine were signifi-cantly higher in the negative ∆LVDd group than in the positive ∆LVDd group (Table 3). Age was significantly higher in the positive ∆LVDd group than in the negative ∆LVDd group (Table 3). Therefore, among many factors, Max adenosine and ∆adenosine were associated with attenuation of LV dilation.
Discussion
The present study demonstrated that: (1) the plasma adenosine concentration increases in the subacute phase after AMI, (2) Max adenosine was significantly higher in the negative ∆LVDd group than in the positive ∆LVDd group, and (3) ∆adenosine was significantly higher in the negative ∆LVDd group than in the positive ∆LVDd group.
It has been widely accepted that adenosine has cardio-protective effects.1–4 It has been reported that adenosine
Figure 4. Plasma adenosine concentration and left ventricular function. (A) Relationship between maximum (MAX) adenosine and
∆EF. (B) Relationship between ∆adenosine and ∆EF. (C) Comparison of MAX adenosine between patients with positive ∆EF or negative ∆EF. (D) Comparison of ∆adenosine between patients with positive ∆EF and those with negative ∆EF. Max adenosine, maximum plasma adenosine concentration; ∆adenosine, maximum adenosine concentration – minimum plasma adenosine concentration; EF, ejection fraction.
tion in the chronic phase 6 months after AMI.
Concerning LV function, as shown in Figure 4, Max adenosine and ∆adenosine did not correlate with ∆EF. There was no significant difference in Max adenosine or ∆adenosine between patients with ∆EF <0 and those with ∆EF ≥0. These results suggested that endogenous adenosine released after AMI is not sufficient to improve LV function in the chronic phase. In order to improve LV function, it may be necessary to administer some adenosine agonists or adenosine-producing drugs. In human studies, it has been reported that an elevated plasma adenosine concen-tration caused by chronic treatment with dipyridamole improved LV function and remodeling and attenuated the severity of HF in patients with chronic HF.14,15
Measurements of the increase in the plasma adenosine concentration after AMI in the subacute phase might allow physicians to predict LV dilation in the chronic phase. Elevation of endogenous adenosine in the subacute phase may not be sufficient to facilitate robust recovery of LV function but may be sufficient to attenuate LV dilation in the chronic phase in patients with AMI.
As presented in Table 2 and Table 3, statistical analysis showed that, among many factors, the extent of endogenous adenosine favourably correlated with attenuation of LV dilation but not with improvement in LV function. It was suggested that older age negatively affected attenuation of adenosine concentration increases in the subacute phase at
14 days after AMI is unclear, one possible explanation being that LV dilation or reduced EF at this time, judging from our recent report that plasma adenosine concentra-tions were elevated in patients with LV dilation or reduced EF.9 This possibility is supported by the patients’ clinical
characteristics demonstrating that the plasma BNP level was significantly higher in AMI patients than in the controls, and that EF was significantly lower in AMI patients than in the controls (Table 1). Furthermore, our previous animal study demonstrated that the LVDd was enlarged and EF reduced on day 14 after AMI induced by 30-min coronary occlusion and reperfusion in rabbits.13 In
addition, because the clinical features that may affect Max adenosine and ∆adenosine would be factors that may cause ∆LVDd ≤0), the clinical feature that may influence higher Max adenosine and ∆adenosine was only younger age among the many factors as shown in Table 3.
In the present study, as shown in Figure 5, Max adenosine and ∆adenosine tended to inversely correlate with ∆LVDd. Max adenosine was significantly higher in patients with ∆LVDd <0 than in those with ∆LVDd ≥0. ∆Adenosine was significantly higher in patients with ∆LVDd <0 than in those with ∆LVDd ≥0. These results suggested that an elevated plasma adenosine concentration in the subacute phase of AMI might contribute to attenuation of LV
dila-Figure 5. Plasma adenosine concentration and left ventricular (LV) remodeling. (A) Relationship between Max adenosine and
∆LVDd. (B) Relationship between ∆adenosine and ∆LVDd. (C) Comparison of the MAX adenosine between patients with positive ∆LVDd and those with negative ∆LVDd. (D) Comparison of ∆adenosine between patients with positive ∆LVDd and those with negative ∆LVDd. Max adenosine, maximum plasma adenosine concentration; ∆adenosine, maximum plasma adenosine concen-tration – minimum plasma adenosine concenconcen-tration; LVDd, LV end-diastolic dimension; ∆LVDd, difference between LVDd in the acute and chronic phases (LVDd in the chronic phase – LVDd in the acute phase).
8 HATASA M et al.
in the chronic phase in patients with AMI. Study Limitations
There are several to note. Although the plasma adenosine concentration significantly increased 14 days after AMI, we did not measure the concentrations after 14 days. Therefore, the peak plasma adenosine concentration after AMI is still unclear.
Because echocardiographic data were not obtained in LV dilation despite the presence of endogenous adenosine
(Table 3).
To summarize, the results suggested that higher plasma adenosine concentrations in patients with AMI may counteract LV remodeling but still be insufficient to improve LV function in the chronic phase.
In conclusion, the plasma adenosine concentration increased during the subacute phase in patients with AMI. Endogenous plasma adenosine may counteract LV dilation
Table 2. Comparison of Factors Affecting ΔEF ΔEF<0 (n=7) 0≤(n=31)ΔEF P value Age (years) 63.3±3.8 68.3±11.9 0.070 Sex (M/F) 6/1 22/9 0.75 HTN, n (%) 5 (71.4) 22 (71.0) 0.66 HL, n (%) 7 (100) 18 (58.1) 0.095 DM, n (%) 4 (57.1) 8 (25.8) 0.25 Smoking, n (%) 5 (71.4) 10 (32.3) 0.14 CKD, n (%) 4 (57.1) 16 (51.6) 0.88 CVD, n (%) 0 (0) 4 (16.0) 0.63 PAD, n (%) 0 (0) 1 (3.2) 0.41 TIMI grade Pre TIMI=0 5 (71.4) 22 (71.0) 0.66 Post TIMI=3 7 (100) 31 (100) >0.99 Target lesion RCA/LAD/LCX 1/4/2 12/14/5 0.45 Pre LVEF (%) 52.6±14.2 50.7±9.6 0.76 Peak CK (U/L) 5,232±3,813.0 2,703±1,960.9 0.16 Peak CK-MB (IU/L) 445±303.3 274±245.9 0.23 ∑CK (U/L) 106,736±74,161.5 66,153±41,742.0 0.24 ∑CK-MB (IU/L) 9,033±5,852.0 5,455±4,087.6 0.19
Door to balloon time (min) 60±16.2 55±20.1 0.57
MAX adenosine (nmol/L) 474.6±194.9 394.1±199.1 0.35
Δadenosine (nmol/L) 313.6±108.6 263.7±182.2 0.38 WBC (/μL) 12,421±3,606.4 11,099±5,192.2 0.54 TC (mg/dL) 208±22.3 186±31.9 0.14 LDL-C (mg/dL) 142±28.8 110±23.9 0.005 HDL-C (mg/dL) 34±4.7 46±11.2 0.0004 TG (mg/dL) 181±79.0 140±122.7 0.32 HbA1c (%) 6.4 (6.2–8.1) 6.0 (5.8–6.2) 0.019 CRE (mg/dL) 1.07±0.22 0.90±0.31 0.19 BNP (pg/mL) 22.8 (17.2–124.9) 43.3 (18.4–143.7) 0.79 CRP (mg/dL) 0.24 (0.07–0.71) 0.09 (0.04–0.19) 0.071 Drugs (6 months’ later)
ACEI, n (%) 3 (42.9) 8 (25.8) 0.66 ARB, n (%) 2 (28.6) 13 (41.9) 0.82 CCB, n (%) 1 (14.3) 8 (25.8) 0.88 BB, n (%) 6 (85.7) 18 (58.1) 0.35 Diuretics, n (%) 0 (0) 22 (29.0) 0.25 MRA, n (%) 4 (57.1) 14 (45.2) 0.88 Statin, n (%) 7 (100) 26 (83.9) 0.60 EPA, n (%) 0 (0) 0 (0) >0.99 Aspirin, n (%) 7 (100) 30 (96.8) 0.41 Clopidogrel, n (%) 6 (85.7) 27 (87.1) 0.60 Insulin, n (%) 1 (14.3) 1 (3.2) 0.81 DPP-4 inhibitors, n (%) 3 (42.9) 3 (9.7) 0.109 Abbreviations as in Table 1.
Advance Publication
their home towns. The number of AMI patients with 6 months’ follow-up was relatively small, so a clinical study with a larger number of AMI patients is warranted.
It is difficult to clarify the mechanism by which a higher plasma adenosine concentration contributed to the attenu-ation of LV dilattenu-ation in patients with AMI in a clinical setting.
Acknowledgment
We thank Miss Akiko Tsujimoto for technical assistance. the subacute phase of 14 days after AMI, it is unclear
whether the changes in LVDd were affected not only by LV remodeling, but also by myocardial stunning. We tried to follow up all 58 AMI patients until 6 months after the onset of AMI at Gifu University Hospital and Takayama Red Cross Hospital but only 38 AMI patients could be followed for this time. One of the reasons for this is that some patients at Takayama Red Cross Hospital had trav-elled to Takayama city for sightseeing and they returned to
Table 3. Comparison of Factors Affecting DLVDd
ΔLVDd≤0 (n=24) 0<(n=14)ΔLVDd P value Age (years) 64.3±10.3 72.6±10.2 0.026 Sex (M/F) 20/4 8/6 0.17 HTN, n (%) 16 (66.7) 11 (78.6) 0.46 HL, n (%) 16 (66.7) 9 (64.3) 0.72 DM, n (%) 9 (37.5) 3 (21.4) 0.47 Smoking, n (%) 12 (50.0) 7 (50.0) 0.74 CKD, n (%) 12 (50.0) 8 (57.1) 0.74 CVD, n (%) 3 (13.6) 1 (7.1) 0.56 PAD, n (%) 0 (0) 1 (7.1) 0.29 TIMI grade Pre TIMI=0 19 (79.2) 8 (57.1) 0.27 Post TIMI=3 24 (100) 14 (100) >0.99 Target lesion RCA/LAD/LCX 8/11/5 5/7/2 0.89 Pre LVEF (%) 52.1±7.2 49.3±14.6 0.52 Peak CK (U/L) 3,135±2,323.2 3,226±3,022.5 0.93 Peak CK-MB (IU/L) 299±238.1 317±307.4 0.86 ∑CK (U/L) 75,855±51,259.0 69,812±52,465.2 0.74 ∑CK-MB (IU/L) 6,086±4,638.6 6,164±4,738.3 0.96
Door to balloon time (min) 54±17.2 60±22.3 0.42
MAX adenosine (nmol/L) 458.0±208.1 324.7±154.7 0.036
Δadenosine (nmol/L) 317.4±174.0 196.7±139.0 0.038 WBC (/μL) 10,990 (7,963–14,335) 9,270 (7,625–10,743) 0.21 TC (mg/dL) 193±28.7 187±34.9 0.63 LDL-C (mg/dL) 120±28.8 109±25.6 0.30 HDL-C (mg/dL) 45±12.5 43±9.4 0.57 TG (mg/dL) 165±135.9 116±63.0 0.15 HbA1c (%) 6.4±0.98 6.0±0.65 0.106 CRE (mg/dL) 0.96±0.28 0.89±0.33 0.50 BNP (pg/mL) 22.8 (14.1–72.8) 79.8 (21.8–251.8) 0.051 CRP (mg/dL) 0.10 (0.04–0.26) 0.10 (0.05–0.34) 0.91 Drugs (6 months’ later)
ACEI, n (%) 6 (25.0) 5 (35.7) 0.74 ARB, n (%) 12 (50.0) 3 (21.4) 0.16 CCB, n (%) 8 (33.3) 1 (7.1) 0.15 BB, n (%) 15 (62.5) 9 (64.3) 0.81 Diuretics, n (%) 3 (12.5) 6 (42.9) 0.084 MRA, n (%) 14 (58.3) 4 (28.6) 0.15 Statin, n (%) 23 (95.8) 10 (71.4) 0.099 EPA, n (%) 0 (0) 0 (0) >0.99 Aspirin, n (%) 23 (95.8) 14 (100) 0.78 Clopidogrel, n (%) 20 (83.3) 13 (92.9) 0.73 Insulin, n (%) 2 (8.3) 0 (0) 0.72 DPP-4 inhibitors, n (%) 5 (20.8) 1 (7.1) 0.51 Abbreviations as in Table 1.
10 HATASA M et al. 8. Kinomura Y, Tanaka T, Aoyama T, Hatasa M, Minatoguchi S,
Iwasa M, et al. Endogenous adenosine may counteract left ventricular dysfunction, dilation, and hypertrophy in patients with heart disease. Circ J 2018; 82: 1319 – 1325.
9. Murakami H, Otani E, Iwata T, Esaka Y, Aoyama T, Kawasaki M, et al. Simple pretreatment and HILIC separation for LC-ESI-MS/MS determination of adenosine in human plasma. Anal Sci 2015; 31: 1189 – 1192.
10. Turer AT, Mahaffey KW, Gallup D, Weaver WD, Christenson RH, Every NR, et al. Enzyme estimates of infarct size correlate with functional and clinical outcomes in the setting of ST-segment elevation myocardial infarction. Curr Control Trials Cardiovasc Med 2005; 6: 12.
11. Kitakaze M, Hori M, Takashima S, Sato H, Inoue M, Kamada T. Ischemic preconditioning increases adenosine release and 5´-nucleotidase activity during myocardial ischemia and reperfu-sion in dogs. Circulation 1993; 87: 208 – 215.
12. da Silva JS, Babriel-Costa D, Sudo RT, Wang H, Groban L, Ferraz EB, et al. Adenosine A2A receptor agonist prevents cardiac remodeling and dysfunction in spontaneously hypertensive male rats after myocardial infarction. Drug Design Dev Ther 2017; 11: 553 – 562.
13. Minatoguchi S, Takemura G, Chen XH, Wang N, Uno Y, Koda M, et al. Acceleration of the healing process and myocardial regeneration may be important as a mechanism of improvement of cardiac function and remodeling by postinfarction granulocyte colony-stimulating factor treatment. Circulation 2004; 109: 2572 – 2580.
14. Kitakaze M, Minamino T, Node K, Komamura K, Kuzuya T, Hori M. Elevation of plasma adenosine levels may attenuate the severity of chronic heart failure. Cardiovasc Drugs Ther 1998; 12: 307 – 309.
15. Sanada S, Asanuma H, Koretsune Y, Watanabe K, Nanto S, Awata N, et al. Long-term oral administration of dipyridamole improves both cardiac and physical status in patients with mild to moderate chronic heart failure: A prospective open-randomized study. Hypertens Res 2007; 30: 913 – 919.
Source of Funding
This study was supported by funding from Gifu University Graduate School of Medicine.
Author Contributions
Shinya M. designed the experiment, T.T., Shingo M., Y.Y., M.K., K.N., Y.E., and B.U., obtained data, and M.H. and Shinya M. wrote the manuscript.
References
1. Liu GS, Thornton JD, Van Winkle DM, Stanley AWH, Olsson RA, Downey JM. Protection against infarction afforded by preconditioning is mediated by A1-adenosine receptors in rabbit heart. Circulation 1991; 84: 350 – 356.
2. Thornton JD, Thornton CS, Downey JM. Effect of adenosine receptor blockade: Preventing protective preconditioning depends on time of initiation. Am J Physiol 1993; 265: H504 – H508. 3. Thornton JD, Liu GS, Olson RA, Downey JM. Intravenous
pretreatment with A1-selective adenosine analogues protects the heart against infarction. Circulation 1992; 85: 659 – 665. 4. Tsuchida A, Liu GS, Wilborn WH, Downey JM. Pretreatment
with the adenosine A1 selective agonist, 2-chloro-N6-cyclo-N6-cyclopentyladenosine (CCPA), causes a sustained limitation of infarct size in rabbits. Cardiovasc Res 1993; 27: 652 – 656. 5. Sabbah HN, Gupta RC, Kohli S, Wang M, Rastogi S, Zhang K,
et al. Chronic therapy with a partial adenosine A1-receptor agonist improves left ventricular function and remodeling in dogs with advanced heart failure. Circ Heart Fail 2013; 6: 563 – 571.
6. Funaya H, Kitakaze M, Node K, Minamino T, Komamura K, Hori M. Plasma adenosine levels increases in patients with chronic heart failure. Circulation 1997; 15: 1363 – 1365.
7. Matsui S, Tamura N, Takekoshi N, Murakami E. Plasma adenosine concentration during and after dynamic exercise in patients with chronic heart failure. Int J Angiol 1995; 4: 188 – 192.