Title Effects of Salinity Stress on Growth, Yield and Water UseEfficiency of Tomato under Soilless Cultivation( 本文(Fulltext) )
Author(s) ZHANG, PENGFEI
Report No.(Doctoral Degree) 博士(農学) 甲第668号 Issue Date 2017-03-13 Type 博士論文 Version ETD URL http://hdl.handle.net/20.500.12099/56216 ※この資料の著作権は、各資料の著者・学協会・出版社等に帰属します。
Effects of Salinity Stress on Growth, Yield and Water
Use Efficiency of Tomato under Soilless Cultivation
2016
The United Graduate School of Agricultural Science, Gifu University
Science of Biological Environment
(Gifu University)
Effects of Salinity Stress on Growth, Yield and Water
Use Efficiency of Tomato under Soilless Cultivation
Content
List of Abbreviations………I List of Figures………..II List of Tables………..III
General abstract……….………...…..1
Chapter 1 General introduction………...3
1.1 Effects of salinity stress on tomato growth………..4
1.1.1 Effects on tomato root development………..…….………..4
1.1.2 Effects on tomato shoot development………..………...………..5
1.1.3 Effects on tomato leaf development………..……….………..6
1.2 Effects of salinity stress on tomato yield………...………..8
1.3 Effects of salinity stress on tomato fruit quality………..…9
1.4. Effects of salinity stress on tomato water use efficiency……..………11
1.5. How to ameliorate effects of salinity on tomato plants under hydroponic cultivation?………...………..…………11
Chapter 2 Effects of low salinity stress on growth, yield and water use efficiency of tomato under soilless cultivation………..15
Abstract………....15
2.1 Introduction………..15
2.2 Materials and methods……….17
2.2.2 Experimental design and treatments………..18
2.2.3 Measurements….…...…..………...19
2.2.3.1 Evapotranspiration………...……19
2.2.3.2 Plant growth variables...………...19
2.2.3.3 Yield and water use efficiency..………...19
2.2.3.4 Fruit quality variables…………...……….……..20
2.2.4 Data analysis….………...20
2.3 Results and discussion..………...20
2.3.1 Plant growth………..………..20
2.3.2 Yield……….………...…22
2.3.3 Water use efficiency……..………..23
2.3.4 Fruit quality………24
2.4 Conclusions…………..……….25
Chapter 3 Effects of salinity stress at different growth stages on the growth, yield, and water use efficiency of tomato (Solanum lycopersicum)………..…………29
Abstract……….29
3.1 Introduction………...…29
3.2 Materials and methods………...…30
3.2.1 Experimental site………30
3.2.2 Experimental design and treatments………..31
3.2.3.1 Transpiration……….……….…..32
3.2.3.2 Plant growth parameters...………...32
3.2.3.3 Yield and water use efficiency..………...33
3.2.3.4 Fruit quality parameters………...33
3.2.4 Data analysis….………..33
3.3 Results………..……….34
3.3.1 Plant growth………..………...…...34
3.3.2 Fruit yield………...…34
3.3.3 Fruit quality………..………..35
3.3.4 Yield and fruit quality of frontal and later trusses……..………35
3.3.5 Water use efficiency……..………..36
3.4 Discussion...…………..……….37
3.5 Conclusions…………..……….39
Acknowledgments………..…………45
I
List of Abbreviations
EC Electric conductivity ET Evapotranspiration FR Fruiting FW FloweringNaCl Sodium chloride
SPAD Soil-plant analysis development
TP Transpiration
V Vegetative
II
List of Figures
Chapter 1
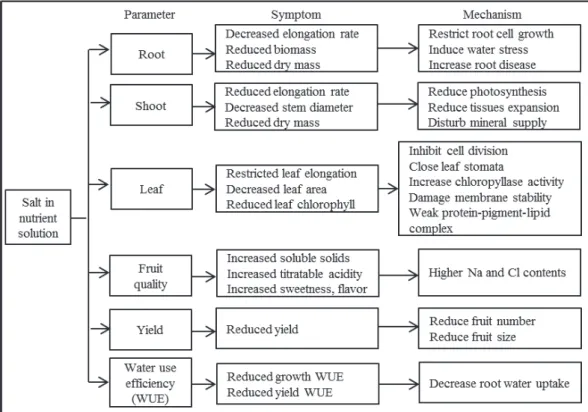
Figure 1-1 Effects of salinity stress on growth, yield and water use efficiency of tomato
under Hydroponics system………..……13
Chapter 2
Figure 2-1 Daily temperature and humidities during the experimental period………...26Figure 2-2 Diagram of the hydroponic power’s pot……….……….…..…26
Figure 2-3 Effects of salinity stress on relative yield………...…………...…26
Figure 2-4 Effects of salinity stress on relative ET....………..…27
Figure 2-5 Effects of salinity stress on fruit quality...……….………27
Chapter 3
Figure 3-1 Daily temperatures and humidities during the experimental period……..…40Figure 3-2 Effects of salinity stress on the fruit sugar and acid contents of tomato (Solanum lycopersicum) plants.………...………..…..…40
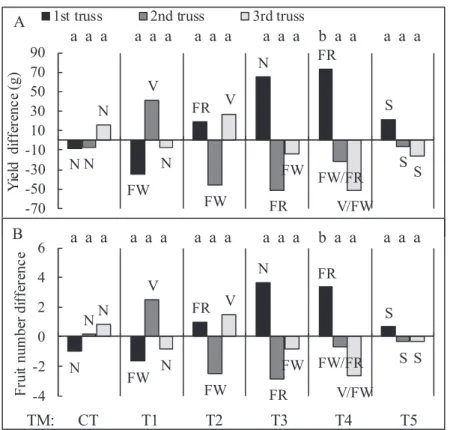
Figure 3-3 Differences in the yield and number of fruit between three trusses of tomato (Solanum lycopersicum) plants.……….……...…………...…41
Figure 3-4 Differences in the sugar and acid contents between three trusses of tomato (Solanum lycopersicum) plants...….………...……….……..…42
III
List of Tables
Chapter 1
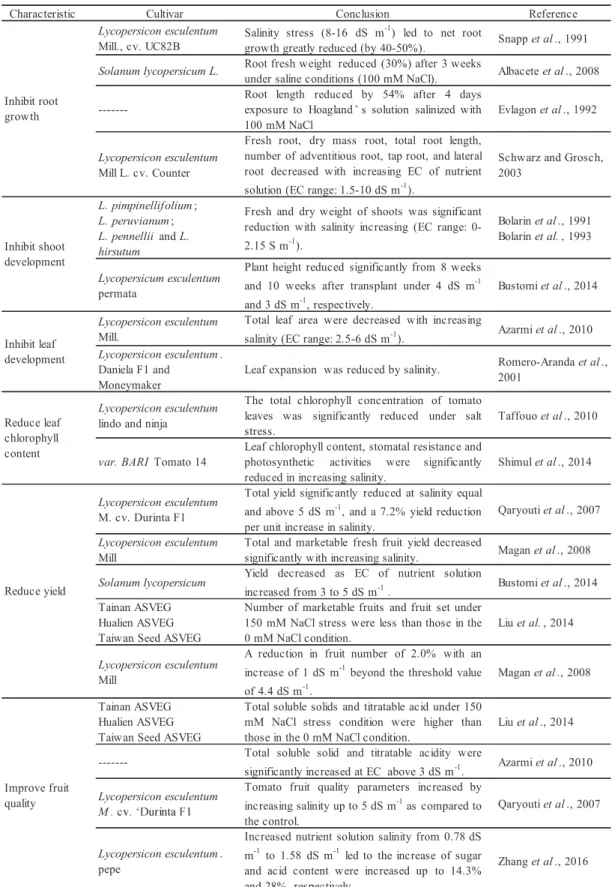
Table 1-1 Characteristics related to salinity tolerance in tomato……….………14
Chapter 2
Table 2-1 EC and added salt of each treatment……….………..28Table 2-2 Effects of salinity stress on plant fresh weight (g)..………28
Table 2-3 Effects of salinity stress on SPAD value (leaf chlorophyll)………... 28
Table 2-4 Effects of salinity stress on dry weight, yield and WUE.………..…..28
Chapter 3
Table 3-1 Experimental scheme for salt management according to the tomato (Solanum lycopersicum) growth stages.………...………43Table 3-2 Effects of salinity stress at different developmental stages on the biomass, plant height, leaf chlorophyll (SPAD value), dry weight, yield, and yield/fresh biomass (Y/B) ratio of tomato (Solanum lycopersicum) plants..………43
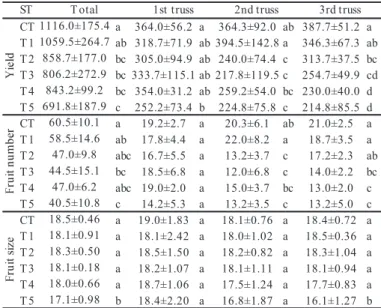
Table 3-3 Effects of salinity stress on the yield of tomato (Solanum lycopersicum) plants.………...43
Table 3-4 Effects of salinity stress at different growth stages on the transpiration (TP), water use efficiency for yield (WUEy), water use efficiency for biomass (WUEb), and relative TP (R-TP) of tomato (Solanum lycopersicum) plants.…………...…44
1
General abstract
Tomato (Solanum lycopersicum) is one of the most important vegetable plants in the world. Tomato is consumed fresh, cooked or after processing; canning process also transforms tomato into juice, pulp, paste, or a variety of sauces. Soilless cultivation is widely used to growing tomato in order to improve the control of the growing environment and avoid uncertainties in the water and nutrient status of the soil. Growing tomato with added salt in nutrient solution is a well-known technique to increase fruit quality; however, high concentrations of salt in their root zone cause the reduction of growth, fruit size and fruit yield. Therefore, the purpose of this research was to find the most suitable electrical conductivity (EC) threshold and best salinity management methods and optimal flower number, which does not causes fruit yield reduction as far as possible to improve fruit quality, is important for tomato soilless cultivation. Two experiments were conducted as following:
(1) Effects of low salinity stress on growth, yield and water use efficiency of tomato under soilless cultivation
(2) Effects of salinity stress at different growth stages on tomato growth, yield and water use efficiency
The first experiment:
For the purpose of the most suitable EC threshold, an experiment was conducted using Hydroponic P Pot under six salinity levels (electrical conductivity (EC): 0.78, 0.91, 1.10, 1.26, 1.41, and 1.58 dS m 1), with three pots (six plants) in a completely randomized design in each treatment. The results showed that plant fresh weight, soil-plant analysis development (SPAD) value (leaf chlorophyll), and dry weight were significantly affected by salinity stress at EC = 1.58 dS m 1. Tomato yield was
2
significantly affected by salinity stress when EC reached 1.41 dS m 1. and was more sensitive than growth variables. Fruit quality was improved with increasing salinity. Evapotranspiration was also significantly affected by salinity stress at EC = 1.58 dS m 1. However, WUE for yield (fresh fruit) and biomass were not significantly different among salinity levels. The SPAD value (leaf chlorophyll) was the most sensitive indicator for salinity stress. The salinity threshold of the tomatoes was 1.41 dS m 1 to achieve higher fruit quality and yield by using Vegetable Life A nutrient solution.
The second experiment:
For the purpose of best salinity management methods, an experiment of effects of salinity stress at different growth
was carried out. Six different growth stages were exposed to the same salinity stress treatments using a completely randomized design, with three pots (six plants) per treatment. It was found that short-term (<21 days) salinity stress during any of the growth stages did not affect tomato growth or WUE, and during the vegetative stage did not affect yield. Salinity stress during the flowering and fruiting stages caused a reduction in tomato yield, which was due to a reduction in the number of fruit produced rather than the fruit size. However, salt exposure at the fruiting stage also improved fruit quality. The effect of salinity stress on the yield and fruit quality of the frontal and later truss depended on the developmental stage of the truss at the time when the stress occurred.
3
Chapter 1: General introduction
Tomato (Solanum lycopersicum) is one of the most important vegetable plants in the world. Global production is estimated at 163.96 million metric tons, with China and India as the leading producers in 2013 (Faostat, 2015). Tomato is consumed fresh, cooked or after processing; canning process also transforms tomato into juice, pulp, paste, or a variety of sauces (Cuartero and Fernandez, 1999).
Soilless cultivation is a method of growing plants using mineral nutrient solutions, in water, without soil, is supported by using inter medium such as perlite, rockwool, clay pellets, peat moss, or vermiculite instead of the root system (Fan et al., 2012). Meric et al. (2011) reported that soilless cultivation is widely used in order to improve the control of the growing environment and avoid uncertainties in the water and nutrient status of the soil. It also overcomes the cumulation of salinity, pests and diseases (Fan et al., 2012) and minimizes environmental contamination stemming from fertigation runoff (Savvas, 2002; Rouphael et al., 2006). This technique also aids in saving irrigation water and fertilizers, thereby appreciably increasing the water use efficiency by the crop (Schwarz et al., 1996; Zekki et al., 1996).
Salinity stress limits the productivity of agricultural crops, with adverse effects on germination, plant vigor and crop yield (Munns and Tester, 2008). Many studies report that tomato plants exposed to high concentrations of salt in their root zone cause the reduction of growth, fruit size and fruit yield (Magan et al., 2008; Mohammad et al., 1998; Scholberg and Locascio, 1999). According to Gama et al. (2007), plants grown under salinity conditions are basically stressed in three ways. These are: (1) reduction of water potential in the root zone and causing water deficit, (2) phytotoxicity of ions such as Na+ and Cl-, and (3) nutrient imbalance by depression in uptake and/or shoot transport.
4
However, many researchers believe that tomato plants grown under salinity conditions have increased fructose, glucose, total soluble solids, amino acids and organic acids (Wu and Kubota, 2008; Sato et al., 2006).
1.1 Effects of salinity stress on tomato growth 1.1.1 Effects on tomato root development
Root plays an important role in plant growth due to direct contact with salt solution under soilless cultivation. Root growth as well as, physiology and morphology of the plant are affected by salinity stress (Fig.1-1).
Salinity negatively affects tomato root growth under soilless cultivation. Leo (1964) reported that high salinity decreased elongation rates of roots and found that compared with the control nutrient solution, tomato root subjected to 1% NaCl solution reduced at 26% of the elongation rate. According to the studies of Snapp et al. (1991), salinity reduces tomato (Lycopersicon esculentum Mill., cv. UC82B) root length density in the late growing season (after 67 days after transplant). Albacete et al. (2008) had presented data that tomato (Solanum lycopersicum L.) root fresh weight reduced (30%) after three weeks under saline conditions (100 mM NaCl). Root dry matter also showed reduction under salinity (10 dS m 1) together with an increase in root-shoot ratio (Lovelli et al., 2011). Evlagon et al. (1992) found that the root length reduced by 54% after 4 days
exposure ed with 100mM NaCl, while surface area reduced
by 20% when 100mM Ca was added to the salinized solution. Schwarz and Grosch (2003) also reported that fresh and dry mass of tomato (Lycopersicon esculentum [Mill] L.
cv. Counter) root, total root length, number of adventitious root, tap root, and lateral root
decreased with increasing EC of nutrient solution (EC range: 1.5-10 dS m 1). Table 1-1 presents a compilation of studies reported on salinity tolerance in various tomato
5
cultivars.
The reduction of root growth under salinity stress is caused by root cell growth restriction, root-zone water stress and root disease increase (Fig.1-1). Tomato grown under salinity condition causes root cell growth restriction, because of low water potential of external medium, interference of the ions or the toxicity of accumulated ions (Cuartero and Fernandez, 1999). Satti and Lopez (1994) reported that the reduction in root dry matter could be a result of salinity induced water stress, which inhibited photosynthesis and subsequent failure in the translocation of assimilates or photosynthates. Snapp et al. (1991) had also reported that salinity reduced net root growth in field-grown tomato, from the finding that is correlated with severe Phytophthora root rot in susceptible genotypes.
1.1.2 Effects on tomato shoot development
Salinity negatively affects tomato shoot growth under soilless cultivation. Studies by Bolarin et al. (1991, 1993) suggest that twenty-one genotypes belonging to four
Lycopersicon wild tomato species (L. pimpinellifolium: PE-2, PE-8, PE-13, PE-14,
PE-15; L. peruvianum: PE-16, PE-18, PE-20, PE-51, PE-52, PE-40, PE-48; L. pennellii: PE-45, PE-47 and L. hirsutum: PE-34, PE-35, PE-36, PE-37, PE-39, PE-41, PE-43) show significant reductions in fresh and dry weight of shoots in response to salinity stress (EC range: 0-2.15 S m 1). Kamrani et al. (2013) had shown that salinity should reach 20 mM to show effect on tomato shoot development; they also pointed that increased salinity decreases shoot height significantly. Oztekin and Tuzel, (2011) reported that average tomato (21 commercially available cultivars) plant height showed 29.03% reduction under 200 mM NaCl treatment when compared with no salinity treatment. Tomato (Permata) plant height reduced significantly from 8 weeks and 10 weeks after transplant under 4dS m 1 and 3dS m 1, respectively (Bustomi et al. 2014). Cruz et al. (1990)
6
reported that reducing the tomato stem length was one of the most reliable indicators for a wide range of tomato genotypes under saline stress. Saberi et al. (2011) also reported that stem diameter was one of the growth parameters which decreased with increasing salinity, similar in forage sorghums (Sorghum bicolor L.) stem diameter decreased with increasing salinity (Table 1-1).
Shoot reduction under salinity stress is caused by reduction in photosynthesis, that leads to reduction in expansion of tissues and disturbance in the mineral supply (Fig.1-1). Zhu (2002) had inferred that reduction in shoot growth under saline conditions is possible due to three reasons: (1) salinity reduced photosynthesis, which in turn limits the supply of carbohydrate needed for growth; (2) salinity reduced shoot and roots growth by reducing turgor in expanding tissues resulting from lowered water potential in root growth medium; and (3) salinity disturbs mineral supply, either an excess or deficiency; induced changes in concentrations of specific ions in the growth medium, may have a direct influence on growth.
1.1.3 Effects on tomato leaf development
Salinity also inhibits tomato leaf expansion under hydroponics system. Adams et al. (1990) reported a significant decrease in tomato plant leaves with increasing salinity levels. Subsequently, Azarmi et al. (2010) also showed that total leaf area of tomato (Lycopersicon esculentum Mill.) decreased with increasing salinity (EC range: 2.5-6 dS m 1). Kamrani et al. (2013) also reported that leaf area at salinities of 40 and 60 mM was decreased in tomato plants. Data presented by Romero-Aranda et al. (2001) also shows that the leaf expansion of two tomato cultivars (Lycopersicon esculentum. Daniela F1 and Moneymaker) is reduced by salinity (Table 1-1).
7
inhibition of cell division, disturbance of water balance and closure of leaf stomata. Wignarajah et al. (1975) had shown that high NaCl levels inhibits leaf cell division in Phaseolus vulgaris. Reports by Erdei and Taleisnik (1993) in maize and sorghum, as well as Huang and Redmann (1995) in wild barley indicate that leaf expansion inhibition is related to salt-induced disturbance of water balance and to loss of leaf turgor under extreme conditions. Parida and Das (2005) reports in their review that salt accumulation in leaves may first inhibit photosynthesis by increasing stomatal and mesophyll conductance to carbon dioxide (CO2) diffusion and is known to impair Ribulose biphosphate (RuBp) carboxylase.
Salinity also reduces leaf chlorophyll content (Fig.1-1). Azarmi et al. (2010) had presented data to show that leaf chlorophyll content is reduced with salinity. According to Taffouo et al. (2010), total chlorophyll concentration of tomato leaves is significantly reduced under salt stress in all cultivars except for Lindo at 50 and 100 mM NaCl and
Ninja at 50 mM NaCl. Recently, Shimul et al. (2014) also reported that total tomato (var. BARI Tomato 14) leaf chlorophyll content, stomatal resistance and photosynthetic
activities are significantly reduced with increasing salinity (Table 1-1).
Reduction in leaf chlorophyll content has been related to salt-induced increasing chloropyllase activity, adverse effects on membrane stability and weakening of protein-pigment-lipid complex (Taffouo et al., 2010). Hanafy et al. (2002) reported that salinity could increase chlorophyllase activities, which might be due to the salinity adverse effects on some ions absorption, such as Mg and Fe, which were involved in the chloroplast formation. Based on experiments in rice, Ashraf and Bhatti (2000) had proposed that decrease in chlorophyll content under salinity condition may be due to its adverse effects on membrane stability.
8
ions absorption. The amount of photoassimilate production is limited by leaves stomatal closure or no stomatal formation and chlorophyll reduction caused by Na+ and Cl -accumulation in leaves (Romero-Aranda and Syvertsen, 1996). Salinity raised Na+ concentration in the leaves of tomato plants, while Ca2+ and K+ concentrations are greatly reduced (Cuartero and Fernandez, 1999).
1.2 Effects of salinity stress on tomato yield
That tomato yield is reduced under salinity above threshold values condition is an unquestioned fact. Qaryouti et al. (2007) had reported that the total yield of tomato (Lycopersicon esculentum M. cv. Durinta F1) is significantly reduced at salinity equal and above 5 dS m 1, and a 7.2% yield reduction per unit increase in salinity. In addition, Magan et al. (2008) also reported that tomato (Lycopersicon esculentum Mill) total and marketable fresh fruit yield decreased significantly with increasing salinity. Dalton et al. (1997) observed that yield is reduced uniformly with decreasing osmotic potential of the nutrient solution. Hajiboland et al. (2010) had proposed that tomato (Solanum
lycopersicum L.) growth and yield reduction affected by salinity could be the reasons for
variation in photosynthetic products translocation toward root, decrease of plant top especially leaves, partial or total enclosed of stomata, direct effect of salt on photosynthesis system and ion balance. Observations of Bustomi et al. (2014) indicate that tomato (Solanum lycopersicum) yield increased as EC of nutrient solution increased from 0 to 3 dS m 1 due to increase of nutrients, while decreased as EC of nutrient solution increased from 3 to 5 dS m 1 due to increase of salinity stress. Findings of Del Amour et
al. (2001) show that the reduction of tomato (Lycopersicon esculentum Mill. cv. Daniela)
fruit yield by salinity was due to a reduction in both size and number of fruit (Table 1-1). Some researchers have inferred that tomato yield reduction is due to reduction in
9
number of fruits produced. The number of tomato fruits/plant depends on the number of trusses/plant, the number of flowers/truss and the fruit set index (number of fruits/number of flowers) at each truss (Cuartero and Fernandez, 1999). The tomato cultivars of Tainan
ASVEG No. 19, Hualien ASVEG No. 21 and Taiwan Seed ASVEG No. 22 under 150 mM
NaCl stress condition showed 73%, 83.3% and 79.3% in number of marketable fruits per plant and 59%, 66.4% and 61.4% in fruit set, respectively, less than those in the 0 mM NaCl condition (Liu et al. 2014). Magan et al. (2008) found a threshold value of 4.4 dS m
1 and a reduction in tomato (Lycopersicon esculentum Mill) fruit number of 2.0% with an increase of 1 dS m1 beyond the threshold. However, other researchers have opined that fruit size is significantly decreased with increasing salinity (Cuartero and Fernandez, 1999; Chretien et al., 2000; Fernandez et al., 2004;). Li et al. (2001) and Eltez et al. (2002) also reported that the number of fruits are unaffected by moderate salinity, and yield reduction was entirely due to smaller fruits. Nevertheless, salinity stress in the root zone is accompanied by yield loss through a reduction in fruit weight, but not in the number of fruits (Willumsen et al., 1996; Li et al., 2001). Inference of Sakamoto et al. (1999) that tomato (Lycopersicon esculentum L. cv. Momotaro) fruit size reduction under salinity stress is caused by inhibition of water uptake by the root resulting in reduction of water transport to the fruit, and increased concentration of soluble solids is of some relevance. Adams (1991) as well as Cuartero and Fernandez (1999) also reported that yield reduction in tomato under salinity stress is caused by decrease in mean fruit weight (Table 1-1).
1.3 Effects of salinity stress on tomato fruit quality
Tomato root zone salinity positively affects tomato fruit quality under hydroponics system (Fig.1-1). Soluble solids, sugars, acidity and pH are important quality parameters
10
for both fresh market produce and processing tomatoes; other characteristics such as taste and shelf life are more important only for the fresh market produce (Cuartero et al., 1999).
Petersen et al. (1998) had reported that hydroponically produced tomato with NaCl enriched nutrient solution had higher consumer preference because of increasing sweetness and flavor, but also made the fruit harder. Salt enrichment in nutrient solution is known to increase ascorbic acid as well, which adds acidic taste to the fruit (Zushi and Matsuzoe, 1998). Magan et al. (2008) reported that total soluble solids (Brix index) and titratable acidity increased by 5.4 and 9.2% per dS m 1, respectively in tomato grown in soil-less greenhouses in Mediterranean climate. According to the data presented by Liu et
al. (2014), tomato cultivars of Tainan ASVEG No. 19, Hualien ASVEG No. 21 and Taiwan Seed ASVEG No. 22 under 150 mM NaCl stress condition showed 16.3%, 78.4%
and 50% in total soluble solids and 50%, 263.6% and 45.3% in titratable acid, respectively, higher than those in the 0 mM NaCl condition. Azarmi et al. (2010) reported that total soluble solid and titratable acidity were significantly increased at EC of above 3 dS m1, and EC increased from 2.5 to 6 dS m1, total soluble solid and titratable acidity were increased to 13.4% and 28.9%, respectively. Qaryouti et al. (2007) also reported that tomato (Lycopersicon esculentum M fruit quality parameters (Fruit dry matter %, total soluble solids, and titratable acidity) increased by increasing salinity up to 5 dS m 1 as compared to the control, while fruit firmness decreased with increasing salinity. Mizrahi et al. (1988) had suggested that adding salts to the root media for better tomato fruit quality.
Fruit juice acidity increased with increasing salinity, which could be due to the higher Na+ and/or Cl contents in the fruit juice since these were the only ions that increased with salinity (Del Amour et al. 2001). Petersen et al. (1998) reported that NaCl treatment
11
improved the sweetness of tomato more than other elements because of higher Na and Cl contents in the fruit.
1.4 Effects of salinity stress on tomato water use efficiency
Water use efficiency (WUE) does not have a single precise definition. Its definition depends upon the particular context in which it is being discussed. WUE is generally used to define the relationship between plant growth, yield and water use in terms of agronomy (Chaves et al., 2004). Soilless cultivation researchers usually determined plant water consumption by irrigation nutrient solution volume minus draining method (Meric et al., 2011)
Salinity can decrease root water uptake through its osmotic effect, and then induce water stress. Plant water uptake is reduced with increased salinity (Romero-Aranda et al., 2001). Al-Harbi et al. (2009) and Al-Omran et al. (2012) concluded that the adverse effect of irrigation with saline water on total dry biomass and total fresh tomato fruit yield is due to the reduction in WUE of plant growth and total yield under soil cultivation. Al-Karaki (2000) found a decrease in tomato dry matter produced per litre of water with increased salinity. However, WUE is constant in the range of salinity inclusive between 4.7 and 9.1 dS m 1 (Van Os, 2001; Reina et al., 2005). This difference, apart from the type of tomato used, can be attributed to other factors, including climatic conditions.
1.5 How to ameliorate effects of salinity on tomato plants under hydroponic cultivation?
As mentioned above, root zone salinity negatively affects tomato root, shoot, leaf and yield, while positively affects tomato fruit quality under soilless cultivation. Improving tomato fruit quality without growth and yield reduction has always been a difficult task
12
under salinity condition. Here, we review some strategies, such as increased potassium concentration, increased calcium concentration and use of daily high salt pulses.
Rengel (1992) pointed out increasing in external calcium concentration could have positive effect on tomato plants under NaCl stress. Increasing Ca2+ and K+ in nutrient solution can ameliorate effects of salinity on most of tomato cultivars; for example, addition of 20 mM Ca(NO3)2 and 2mM KNO3 to salinity nutrient solution (NaCl: 50mM) increased root volume by 25.3% and 66.7% for Strain B, 131.3% and 12.5% for Pakmore (Lopez and Satti, 1996). Through cross mixed three phosphorus levels (0.5, 1 and 2 mM P) and four levels of NaCl salt (0, 50, 100 and 200 mM NaCl), Mohammad et al. (1998) showed that increasing the phosphorus levels tended to enhance tomato (cv Riogrande) root growth through increasing both root growth and root surface area. Kaya and Higgs (2003) reported that the yield, dry matter, plant height and total chlorophyll of bell pepper (Capsicum annum cv. 11B 14) showed 63.0%, 23.7%, 28.1% and 27.5%, increase respectively, under salinity soil (EC: 7.2 dS m 1) with KNO
3 (1g/kg) supplementary, higher than those under salinity soil only. Rubio et al. (2009) also pointed out that an increase of potassium concentration (0.2, 2, 7 and 14 mM) in the root medium under saline conditions (NaCl: 30mM) increased the number of fruits per plant in bell pepper (C.
annuum L. cv. Somontano), but total fruit yield was not affected. Tabatabaei (2006)
reported that increasing potassium concentration could increase growth in olives. This is probably related to role of K+ in enzymes stability and alleviation of Na+ toxicity effects. Use of daily high salt pulses is another method suggested to increase fruit quality without decreasing yield.
13
Fig. 1-1 Effects of salinity stress on growth, yield and water use efficiency of tomato under Hydroponics system
14
Table 1-1: Characteristics related to salinity tolerance in tomato.
Characteristic Cultivar Conclusion Reference
Lycopersicon esculentum
Mill., cv. UC82B
Salinity stress (8-16 dS m-1) led to net root
growth greatly reduced (by 40-50%). Snapp et al ., 1991
Solanum lycopersicum L. Root fresh weight reduced (30%) after 3 weeks
under saline conditions (100 mM NaCl). Albacete et al ., 2008
---Root length reduced by 54% after 4 days exposure to Hoagland s solution salinized with 100 mM NaCl
Evlagon et al ., 1992
Lycopersicon esculentum
Mill L. cv. Counter
Fresh root, dry mass root, total root length, number of adventitious root, tap root, and lateral root decreased with increasing EC of nutrient solution (EC range: 1.5-10 dS m-1).
Schwarz and Grosch, 2003
L. pimpinellifolium ; L. peruvianum ; L. pennellii and L. hirsutum
Fresh and dry weight of shoots was significant reduction with salinity increasing (EC range: 0-2.15 S m-1).
Bolarin et al ., 1991 Bolarin et al. , 1993
Lycopersicum esculentum
permata
Plant height reduced significantly from 8 weeks and 10 weeks after transplant under 4 dS m-1
and 3 dS m-1, respectively.
Bustomi et al ., 2014
Lycopersicon esculentum
Mill.
Total leaf area were decreased with increasing
salinity (EC range: 2.5-6 dS m-1). Azarmi et al ., 2010
Lycopersicon esculentum .
Daniela F1 and Moneymaker
Leaf expansion was reduced by salinity. Romero-Aranda et al ., 2001
Lycopersicon esculentum
lindo and ninja
The total chlorophyll concentration of tomato leaves was significantly reduced under salt stress.
Taffouo et al ., 2010
var. BARI Tomato 14
Leaf chlorophyll content, stomatal resistance and photosynthetic activities were significantly reduced in increasing salinity.
Shimul et al ., 2014
Lycopersicon esculentum
M. cv. Durinta F1
Total yield significantly reduced at salinity equal and above 5 dS m-1, and a 7.2% yield reduction
per unit increase in salinity.
Qaryouti et al ., 2007
Lycopersicon esculentum
Mill
Total and marketable fresh fruit yield decreased
significantly with increasing salinity. Magan et al ., 2008
Solanum lycopersicum Yield decreased as EC of nutrient solution
increased from 3 to 5 dS m-1 . Bustomi et al ., 2014
Tainan ASVEG Hualien ASVEG Taiwan Seed ASVEG
Number of marketable fruits and fruit set under 150 mM NaCl stress were less than those in the 0 mM NaCl condition.
Liu et al. , 2014
Lycopersicon esculentum
Mill
A reduction in fruit number of 2.0% with an increase of 1 dS m-1beyond the threshold value of 4.4 dS m-1.
Magan et al ., 2008 Tainan ASVEG
Hualien ASVEG Taiwan Seed ASVEG
Total soluble solids and titratable acid under 150 mM NaCl stress condition were higher than those in the 0 mM NaCl condition.
Liu et al ., 2014 --- Total soluble solid and titratable acidity were
significantly increased at EC above 3 dS m-1. Azarmi et al ., 2010
Lycopersicon esculentum M
Tomato fruit quality parameters increased by increasing salinity up to 5 dS m-1as compared to
the control.
Qaryouti et al ., 2007
Lycopersicon esculentum .
pepe
Increased nutrient solution salinity from 0.78 dS m-1to 1.58 dS m-1 led to the increase of sugar and acid content were increased up to 14.3% and 28%, respectively. Zhang et al ., 2016 Reduce yield Improve fruit quality Inhibit shoot development Inhibit root growth Inhibit leaf development Reduce leaf chlorophyll content
15
Chapter 2: Effects of low salinity stress on growth, yield and water use efficiency of tomato under soilless cultivation
Abstract
This study was conducted to investigate the effects of low salinity stress on growth, yield, water use efficiency (WUE), and fruit quality of cherry tomatoes cultivated under a soilles
six salinity levels (electrical conductivity (EC): 0.78, 0.91, 1.10, 1.26, 1.41, and 1.58 dS m 1), with three pots (six plants) in a completely randomized design in each treatment. The results showed that plant fresh weight, soil-plant analysis development (SPAD) value (leaf chlorophyll), and dry weight were significantly affected by salinity stress at EC = 1.58 dS m 1. Tomato yield was significantly affected by salinity stress when EC reached 1.41 dS m 1. and was more sensitive than growth variables. Fruit quality was improved with increasing salinity. Evapotranspiration was also significantly affected by salinity stress at EC = 1.58 dS m 1. However, WUE for yield (fresh fruit) and biomass were not significantly different among salinity levels. The SPAD value (leaf chlorophyll) was the most sensitive indicator for salinity stress. The salinity threshold of the tomatoes was 1.41 dS m 1 to achieve higher fruit quality and yield by using Vegetable Life A nutrient solution.
2.1 Introduction
The tomato is one of the most popular vegetables worldwide. Global production is estimated at 138.7 million metric tons, with China and India the leading producers during 2012 (Faostat, 2015). The tomato is the most common crop plant produced by hydroponic culture in greenhouses due to uniform products and improved control under those
16
growing conditions. Among tomato cultivars, the cherry tomato is a widespread variety of table tomato, grown in China, United States, and other countries.
The harmful effects of salinity stress on tomatoes have been found to cause a reduction in growth (Kamrani et al. 2013), fruit size, and fruit yield (Bustomi Rosadi et al. 2014; Magan et al. 2008). The summary by Gama et al. (2007) listed three mechanism by which plants are compromised by salinity stress: 1) water deficit due to reduced water potential in the root zone; 2) a toxic effect due to the high concentration of Na+
nutrient imbalance by depression of uptake and/or shoot transport. Tester and Davenport (2003) also reported that high concentrations of Na+ could cause a range of osmotic and metabolic problems within plant shoots. On the other hand, it is widely considered that the quality of fruits of tomato plants grown under saline conditions is higher than those grown under non-saline conditions (Cornish 1992; Magan et al. 2008). Auerswald et al. (1999) also reported that sugar and acid contents of fruits were enhanced with increasing electric conductivity (EC) levels of the nutrient solution. Azarmi et al. (2010) found that growth variables and yield were reduced with increasing salinity; however, fruit qualitative properties were improved by salinity at EC levels between 2.5 6 dS m 1 under a hydroponics system.
Previous studies have mostly focused on higher salinity levels (EC > 2.0 dS m 1) when considering salinity stress in soilless cultivation, (Amor et al. 2001; Azarmi et al. 2010; Maggio et al. 2007; Reina-Sanchez et al. 2005) because a nutrient solution is generally highly saline. In accordance with soil cultivation, it was also found that tomato yield is reduced and fruit quality is improved by adding salt to a nutrient solution in soilless cultivation (Amor et al. 2001; Azarmi et al. 2010). However, very little information on the effects of low salinity concentrations (EC < 1.6 dS m 1) is available, and the threshold salinity value for the cultivation of tomatoes under a soilless condition remains vague.
17
According to the above description, a higher salinity concentration causes a reduction of growth and fruit yield, but improves fruit quality. Under the condition of a low salinity concentration, it is important to determine a threshold salinity value which minimizes the reduction in fruit yield, but improves fruit quality.
Previous studies have mostly focused on higher salinity levels (EC > 2.0 dS m 1) when salinity stress was considered in the soilless cultivation (Amor et al. 2001; Reina-Sanchez
et al. 2005; Maggio et al. 2007; Azarmi et al. 2010) because nutrient solution generally
contains high salinity. However, very little information is available on the use of nutrient solution with low salinity concentration (EC < 1.6 dS m 1) for tomato cultivation.
The present study was conducted to achieve the following objectives:
1: To investigate the effects of low salinity concentration (EC < 1.6 dS m 1) of a nutrient solution on plant growth, yield, and fruit quality of tomatoes cultivated under a soilless condition.
2: To calculate the evapotranspiration (ET) and water use efficiency (WUE) for tomatoes cultivated under a soilless condition through the gravimetric method.
3: To evaluate the salinity threshold of a nutrient solution for maintaining the yield of tomatoes while also improving fruit quality.
2.2 Materials and methods 2.2.1 Experimental site
The experiment was conducted in a plastic covered house with open surrounding sides, located at the Experimental Farm of Gifu University, Gifu Prefecture, Japan (35 27 51 N, 136 44 14 E), over a period of 8 weeks from May to July, 2014. The house was 11 m in length and 5 m in width with an area of 55 m2. Daily temperatures and relative humidity inside the house are shown in Fig. 2-1. The average temperature during
18
the day and night was 31.5°C and 20.8°C, respectively, whereas the average relative humidity was 52.8% and 88.9%, respectively during the experiment duration.
2.2.2 Experimental design and treatments
Cherry tomato (Lycopersicon esculentum ng a
-3000, manufactured by MINORU kasei. Co. JP) (Fig. 2-2). The pot can be separated into a nutrient solution bucket, plant table, and plant bowl. A standard nutrient solution of Vegetable Life A (N, P, K, Mg, Mn, and B of 1.3%, 0.6%, 1.9%, 0.32%, 0.008%, and 0.008%, respectively; manufactured by Otsuka Chemical Co. Ltd., Tokyo, Japan), diluted 200 times by tap water as a solution, which had an EC of 0.8 dS m 1, was used to cultivate the tomatoes. Sodium chloride (NaCl) was added to the solution to impose salinity stress on tomato plants.
Seedlings were transplanted in a randomized complete block design with six plants per treatment at the approximately 20 cm height stage. A total of 36 plantswere cultivated in 18 pots (two plants per pot). Six salinity levels, namely the control (CT) (0.8 dS m 1; recommend by the solution manufacturer), ST1 (0.95 dS m 1), ST2 (1.10 dS m 1), ST3 (1.25 dS m 1), ST4 (1.40 dS m 1), and ST5 (1.55 dS m 1) were prepared as treatments. For example, the ST2 treatment was exposed nutrient solution with an EC maintained at approximate 1.10 dS m 1 by the addition of salt throughout the experiment duration. The EC of each pot was measured daily after irrigation, and salt was added to maintain the EC levels of each treatment. The average measured EC (n = 168; three pots × 56 days) was used as the actual EC of each treatment (Table 2-1).
Lateral buds were pruned during sprouting. The top bud was pruned by the fifth week (from 29 to 35 days after transplantation) when the plant was in the four flower trusses stage.
19
2.2.3 Measurements 2.2.3.1 Evapotranspiration
Daily ET (g day 1) per pot was measured by the gravimetric method, calculated as follows:
(1)
where ETi is the evapotranspiration at day i (g), Wi is the weight of the whole bucket
(including 13 L of nutrient solution) after irrigation at day i (g), and W'i+1 is the weight of
the whole bucket before irrigation at day i + 1 (g). Irrigation was conducted by adding nutrient solution. The amount of irrigation was taken to be the same as ETi. The total ET
per pot (two plants) during the test was divided between each plant based on the final plant biomass. The total ET per plant was defined as the actual ET.
2.2.3.2 Plant growth variables
The weight of a fresh plant (g/plant) was measured by weighing the plant and plant
was measured by a soil-plant analysis development (SPAD) chlorophyll meter (Minolta SPAD-502 meter, Tokyo, Japan) once a week. Yadava (1986) reported that SPAD values have a direct linear relationship with extracted leaf chlorophyll. Therefore, the SPAD value was used to describe leaf chlorophyll in the present study. After the cultivation test, the weight of the aboveground biomass and root biomass were measured after drying at 105°C for 30 min, and then at 70°C until a constant weight was achieved in a ventilated oven (Chen et al. 2012).
2.2.3.3 Yield and WUE
Fruit yield (g/plant), individual fruit weight, and fruit number of all plants were measured during the harvest seasons (from week 6 to 8).
20
(Araus, 2004). WUE, described as the amount of water used per unit of yield, can be used to monitor and compare the different plant growth systems (Meric et al. 2011).
WUE was calculated in total yield (WUEy, g/kg, gram of fresh fruit produced per kg of water) and in biomass (WUEb, g/kg, gram of biomass produced per kg of water) per pot.
2.2.3.4 Fruit quality variables
Tomato fruits were harvested nearly twice a week during the fully mature fruit stage. The fruits of similar size and no appearance of defects were chosen at harvesting day for fruit quality measurements. Eight fruits (two per truss) per plant were chosen during the harvest seasons. Each fruit was then juiced by small juicer. Fruit sugar content (%) was measured by a hand refractometer (N-1E, manufactured by ATAGO, Japan). Prepared juice was diluted 50 times with Quinone Reagent Solution (RE-99432, manufacturered by ATAGO, Japan), which was then used to measure fruit acid content (%) by the Pocket acid meter (PAL-AC1, manufactured by ATAGO, Japan).
2.2.4 Data analysis
Statistical analysis was conducted using one-way ANOVA, and measurement results
the ST3 treatment was not used because of abnormally high biomass (> 150%) compared with the average of the other plants under the same treatment.
2.3 Results and discussion 2.3.1 Plant growth
The effects of salinity stress on plant growth indicators are shown in Tables 2-2~2-4. Table 2-2 shows that the lowest fresh weight was recorded in the ST5 treatment from day 35. The ST5 treatment showed significant differences in fresh weight compared to the CT
21
from day 49. Table 2-3 shows that the SPAD value (leaf chlorophyll) experienced stress at day 28 under ST4, and followed from day 35 under ST5, but recovered later under ST4. Dry weight, dry root weight, and dry aboveground organ weight also showed significant difference under ST5 (Table 2-4).
Based on the above phenomena, plant fresh weight and SPAD value (leaf chlorophyll) were significantly affected by salinity stress from day 49 and 35, respectively under the ST5 treatment. It was indicated that the SPAD value (leaf chlorophyll) was more sensitive as a plant growth indicator than plant fresh weight under salinity stress. Besides, tracing the plant fresh weight is difficult under traditional agricultural production. Therefore, based on timeliness and simplicity of the SPAD value (leaf chlorophyll), this method may be very useful for detection of various stresses, and especially management of salinity in tomato cultivation under salinity conditions.
Plant growth indicators showed significant differences under the ST5 treatment. Meanwhile, the values of growth variables under ST4 (e.g., fresh weight from day 28, SPAD value from day 14, dry weight, dry root weight, dry aboveground biomass weight; fruit number, and weight of one fruit) were obviously lower than that of the other treatments. This indicated that the growth variables also suffered slight stress under the ST4 treatment, although no significant difference was observed. According to this result, the threshold value of tomato growth could be estimated as between 1.41 dS m 1 (ST4) and 1.58 dS m 1 (ST5). The decrease in fresh weight could be caused by the inhibition of leaf expansion related to salt-induced destruction of the water balance (Huang and Redmann, 1995), inhibition of cell division (Wignarajah et al. 1975), and inhibition of leaf photosynthesis (Parida and Das, 2005). The SPAD value (leaf chlorophyll) was significantly reduced from day 35 under the ST5 treatment. This could be attributed to salt-induced weakening of the protein-pigment-lipid complex and increasing
22
chlorophyllase activity (Taffouo et al. 2010). Salt-induction in a nutrient solution has been shown to result in water stress in the root zone (Satti and Lopez, 1994), restriction of root cell growth (Bressan et al. 1990; Cuartero and Fernandez, 1999), and an increase of root disease (Snapp et al. 1991).
2.3.2 Yield
In the present study, the average actual yield (Ya: n = 6) of the CT (0.78 dS m 1) is defined as the reference yield (Yo) for tomato growth with no salinity stress effects. The relationship between relative yield (Ya/Yo) and salinity levels showed that the relative yield was significantly decreased by exposure to salinity in the ST4 and ST5 treatments (Fig. 2-3). Table 2-4 shows that tomato yield experienced stress under the ST4 and ST5 treatments. The fruit number was reduced by the salinity of the ST5 treatment.
Based on the above explanation, the EC at ST4 (EC = 1.41 dS m 1) can be regarded as the yield threshold salinity under a soilless cultivation condition. Many other studies have reported the EC threshold of tomato to range between 2.5 and 4 dS m 1 under soilless cultivation (Azarmi et al. 2010; Bustomi Rosadi et al. 2014; Magan et al. 2008). These discrepancies may relate to interactions between the cultivar, environmental factors, and cultural practices (Dorais et al. 2001). For example, Reina-Sanchez et al. (2005) estimated threshold values ranging from 0 to 3.4 dS m 1 for four tomato cultivars (Lycopersicon esculentum Mill.: L; threshold value: L9 < L1 < Floradade < L5) under a common cultivation condition. Magan et al. (2008) also obtained three different threshold values (3.6, 3.1, and 2.9 dS m 1) through three soilless experiments, based on different growth season, cultivar, or cultivation density between every two experiments.
The above explanation indicates that the salinity threshold of tomato yield estimated from this experiment is effective under the suitable conditions without the stress of
23
environmental factors and using Vegetable Life A nutrient solution.
The plant growth variables showed significantly affected by salinity under ST5 treatment (1.58 dS m 1), but yield decreased significantly under ST4 treatment (1.41 dS m 1). This difference indicated that tomato yield was more sensitive than growth variables under salinity stress. This finding supports that of Shabani et al. (2012), who showed that cherry tomato growth variables and yield are significantly different compared to non-salt treatment (1.9 dS m 1) when salinity was higher than 5.8 dS m 1 and 5.0 dS m 1, respectively. In another trial, we also found that the yield of tomato under salinity stress at the flowering, fruiting, or between the flowering and fruiting stage was significantly different compared to no salinity condition, but there are no differences for growth parameters (fresh weight, height, leaf chlorophyll and dry weight) (Zhang et al. 2016b).
2.3.3 Water use efficiency (WUE)
In the present study, the average actual ET (ETa: n = 6) of the CT (0.78 dS m 1) is defined as reference crop ET (ETo) for tomato growth with no salinity stress effects (Allen
et al. 1998; Doorenbos and Pruitt, 1977). The average ratio of total fresh weight to actual ET was approximate 3.56%, which showed that the fresh weight of a plant could be
neglected in estimating actual ET in the present study.
Fig. 2-4 shows the relationship between ETa/ETo and salinity levels. The ETa/ETo of the ST5 treatment was significantly different compared with the CT, indicating that salinity stress effects water uptake of tomatoes. This result is in agreement with the conclusions of Reina-Sanchez et al. (2005) and Romero-Aranda et al. (2001), who also observed that water uptake was decreased with increasing salinity. This phenomenon may be caused by an osmotic and toxic effect. Salt induction disrupts the plant osmotic balance and results in decreasing plant water uptake and closing stomatal apertures, which leads to the
24
inhibition of transpiration (Munns and Tester, 2008). Salt induction also causes the accumulation of Na+ and Cl- ions in root tissues and an imbalance of acquisition of the other nutrients, which consequently reduces root water uptake due to the toxic effect (Aroca et al. 2011).
Table 2-4 shows that there was no significant difference between the WUE for yield and biomass, except for the WUE for biomass under the CT. This indicates that WUE in yield and biomass were not affected by increasing salinity of the nutrient solution. Qaryouti et al. (2007) reported that the WUE of tomato fruit yield was not significantly affected by increasing salinity at EC levels between 3 7 dS m 1 under soilless cultivation. However, Reina-Sanchez et al. (2005) reported that the WUE (gram of fruit per liter of water transpired) reduced significantly as salinity of the nutrient solution increased. This discrepancy could be attributed to the range of salinity levels used; the range of salinity levels by Reina-Sanchez et al. (2005) was much higher than that used in the present study and that by Qaryouti et al. (2007). In addition, the cultivation condition and cultivars were also different.
2.3.4 Fruit quality
The average sugar and acid content (n = 48, ST3: n = 40) showed an increasing trend with increasing salinity (Fig. 2-5). In particular, the sugar content under ST3 and acid content under ST4 were significant different to those of the CT. These results are in agreement with findings by Auerswald et al. (1999), who reported that higher EC (1.0, 3.5, and 6.0 dS m 1) values resulted in higher contents of reducing sugar and titratable acid. Ullah et al. (1994) also reported that salinity increased the contents of sugars and acids (ascorbic and citric acid) of the tomato fruits.
25
2.4 CONCLUSIONS
1. The growth variables such as plant fresh weight, SPAD value (leaf chlorophyll) and dry weight were significantly affected by salinity under the ST5 treatment (1.58 dS m 1). Meanwhile, these variables also showed obviously lower values under the ST4 (1.41 dS m 1) treatment compared with the other treatments, although there were no significant differences. Therefore, the threshold values of tomato growth occurred between 1.41 dS m 1 (ST4) to 1.58 dS m 1 (ST5).
2. The growth performance indicators did not show salinity stress phenomena at the same growth stage. Plant fresh weight was significantly reduced from day 49, whereas the SPAD value (leaf chlorophyll) was reduced from day 35. The SPAD value (leaf chlorophyll) was more sensitive than plant fresh weight to salinity stress.
3. The plant fresh weight, SPAD value (leaf chlorophyll), and dry weight were significantly affected by salinity under the ST5 treatment (1.58 dS m 1); however, the yield decreased significantly when EC reached1.41 dS m 1 (ST4). It can be concluded that the salinity threshold of tomato yield was 1.41 dS m 1 under a low salinity concentration using Vegetable Life A nutrient solution. It also indicated that tomato yield was more sensitive than growth variables to salinity stress.
4. ET values were obviously influenced by the salinity under the ST5 treatment. However, WUE values for yield and plant fresh weight were not influenced by salinity stress at EC values <1.58 dS m 1.
5. The fruit sugar and acid content were increased with increasing salinity, but at EC values <1.58 dS m 1.
26
Fig. 2-2 Diagram of hydroponic powe
Fig.2-1 Daily temperatures and humidities during the experimental period 0 10 20 30 40 50 60 Minimum Average Maximum 0 20 40 60 80 100 0 10 20 30 40 50 60
Days after transplanting
Fig.2-3 Effects of salinity stress on relative yield (Different test, p < 0.05)) CT ST 1 ST 2 ST 3 ST 4 ST 5 0.2 0.4 0.6 0.8 1.0 1.2 1.4 1.6 1.8 2.0 0.70 0.90 1.10 1.30 1.50 1.70 EC a ab ab a bc c
27
Fig.2-4 Effects of salinity stress on relative ET (Different s test, p < 0.05)) CT ST 1 ST 2 ST 3 ST 4 ST 5 0.6 0.8 1.0 1.2 1.4 0.70 0.90 1.10 1.30 1.50 1.70 EC a a a a ab b
Fig.2-5 Effects of salinity stress on fruit quality. Different test, p < 0.05). 0.40 0.45 0.50 0.55 0.60 0.65 0.70 0.75 0.80 5.0 5.5 6.0 6.5 7.0 7.5 8.0 8.5 9.0 CT ST1 ST2 ST3 ST4 ST5 EC treatments Sugar Acid abc bcd cd d a ab a a b a c a
28
Table 2-1. EC and added salt of each treatment
Table 2-2: Effects of salinity stress on plant fresh weight (g). Data are the means ± SD of six plants except ST3 treatment of five plants. Values in the same column that are followed by different lower-case letters (a
< 0.05).
Table 2-3: Effects of salinity stress on SPAD value (leaf chlorophyll). Data are means ± SD of six plants except ST3 treatment of five plants. Values in the same column that are followed by different lower-case letters (a
< 0.05).
Table 2-4: Effects of salinity stress on the dry weight, yield, and WUE. Data of dry weight and yield are means ± SD of six plants except ST3 treatment of five plants. Data of WUE for yield and biomass are means ± SD of three pots except ST3 treatment of two pots. Values in the same column that are followed by different lower-case letters (a c) are significant Plan Actual CT 0 0.80 0.78 ST1 1.3 0.95 0.91 ST2 2.6 1.10 1.10 ST3 3.9 1.25 1.26 ST4 5.2 1.40 1.41 ST5 6.5 1.55 1.58
Treatment Added salt (g/13L)
EC (dS m-1)
ST level
CT 295 ± 14ab 364 ± 12ab 504 ± 41a 728 ± 84a 982 ± 121a 1241 ± 168ab 1469 ± 191a 1538 ± 209a ST1 275 ± 38b 334 ± 61b 515 ± 50a 741 ± 72a 977 ± 80a 1247 ± 104ab 1521 ± 127a 1649 ± 138a ST2 320 ± 17a 396 ± 21a 570 ± 33a 805 ± 63a 1053 ± 123a 1286 ± 185a 1519 ± 253a 1593 ± 288a ST3 308 ± 10a 373 ± 11ab 527 ± 25a 754 ± 72a 1027 ± 107a 1291 ± 143a 1582 ± 172a 1658 ± 197a ST4 299 ± 29ab 349 ± 67ab 495 ± 112a 689 ± 159a 920 ± 190a 1140 ± 227ab 1336 ± 272ab 1403 ± 264a ST5 300 ± 24ab 366 ± 50ab 520 ± 78a 710 ± 96a 893 ± 111a 1064 ± 135b 1158 ± 177b 1129 ± 154b Day 35 Day 42 Day 49 Day 56 Day 7 Day 14 Day 21 Day 28
ST level CT 40.00 ± 3.34 a 53.20 ± 11.2 a 55.58 ± 1.92 a 56.43 ± 1.37 a 58.22 ± 3.17 a 59.62 ± 2.44 a 58.08 ± 2.53 ab 56.75 ± 2.36 ab ST1 41.03 ± 5.08 a 51.68 ± 4.27 a 53.83 ± 3.68 a 56.17 ± 3.60 ab 59.00 ± 1.68 a 59.03 ± 1.59 a 61.58 ± 1.34 a 59.43 ± 1.36 a ST2 40.58 ± 3.09 a 54.13 ± 1.22 a 55.42 ± 2.07 a 53.43 ± 2.81 ab 59.30 ± 3.05 a 59.40 ± 3.34 a 59.40 ± 3.29 ab 57.77 ± 2.78 ab ST3 37.50 ± 5.93 a 53.80 ± 3.04 a 55.80 ± 2.57 a 53.90 ± 1.36 ab 58.60 ± 1.56 a 57.70 ± 2.74 ab 60.30 ± 2.33 ab 56.80 ± 1.76 ab ST4 38.52 ± 3.60 a 51.20 ± 1.98 a 53.77 ± 1.22 a 52.98 ± 2.94 b 57.87 ± 2.55 a 57.60 ± 3.75 ab 57.48 ± 3.28 b 53.57 ± 5.74 b ST5 36.90 ± 5.15 a 49.87 ± 1.68 a 52.58 ± 2.37 a 53.53 ± 1.31 ab 54.20 ± 2.97 b 54.43 ± 3.32 b 52.45 ± 4.19 c 48.52 ± 5.27 c
Day 35 Day 42 Day 49 Day 56
Day 7 Day 14 Day 21 Day 28
261.59 ± 41.79 a 21.81 ± 1.60 ab 239.78 ± 41.15 a 516.97 ± 146.85 a 48.50 ± 12.16 a 10.74 ± 1.67 a 12.36 ± 0.92 a 34.37 ± 0.41 b 276.82 ± 35.96 a 23.82 ± 1.34 a 253.00 ± 34.71 a 469.78 ± 36.43 ab 50.67 ± 12.42 a 9.76 ± 2.43 a 10.94 ± 0.56 a 35.41 ± 0.70 ab 266.11 ± 65.26 a 22.87 ± 2.28 a 243.24 ± 63.72 a 491.97 ± 165.20 ab 49.00 ± 6.07 a 10.06 ± 3.33 a 11.10 ± 2.59 a 34.99 ± 1.07 ab 253.98 ± 44.79 a 23.22 ± 1.99 a 230.76 ± 45.02 a 553.99 ± 103.58 a 51.80 ± 6.50 a 10.63 ± 0.72 a 12.50 ± 0.71 a 36.80 ± 0.79 a 229.59 ± 32.42 a 20.20 ± 3.16 b 209.38 ± 30.09 a 363.20 ± 141.72 bc 40.17 ± 11.14 ab 8.82 ± 1.60 a 10.86 ± 0.66 a 36.51 ± 1.65 ab 173.46 ± 26.65 b 14.76 ± 1.78 c 158.69 ± 24.71 b 315.32 ± 85.60 c 35.67 ± 2.34 b 8.77 ± 1.92 a 10.43 ± 2.04 a 35.90 ± 1.44 ab WUEy (g/kg) WUEb (g/kg) CT ST level Dry weight (g) Dry root (g) Dry aboveground (g) Yield (g) Fruit number ST3 ST4 ST5 Weight of one fruit (g) ST1 ST2
29
Chapter 3: Effects of salinity stress at different growth stages on the growth, yield and water use efficiency of tomato (Solanum lycopersium)
Abstract
This study investigated the effects of salinity stress at different growth stages on the growth, yield, fruit quality, and water use efficiency (WUE) of tomato (Solanum
lycopersicum) plants cultivated under soilless conditions. Six different growth stages
were exposed to the same salinity stress treatments using a completely randomized design, with three pots (six plants) per treatment. It was found that short-term (<21 days) salinity stress during any of the growth stages did not affect tomato growth or WUE, and during the vegetative stage did not affect yield. Salinity stress during the flowering and fruiting stages caused a reduction in tomato yield, which was due to a reduction in the number of fruit produced rather than the fruit size. However, salt exposure at the fruiting stage also improved fruit quality. The effect of salinity stress on the yield and fruit quality of the frontal and later truss depended on the developmental stage of the truss at the time when the stress occurred.
3.1 Introduction
Tomato (Solanum lycopersicum) is one of the most important vegetable plants in the world. The fruit of tomato are used in a variety of ways, including for fresh consumption, in cooking, and for processing, where it is canned, or made into juice, pulp, paste, or a variety of sauces (Cuartero and Fernandez-Munoz 1999). Soilless cultivation has been widely used to better control the growing environment, stabilizing the water and nutrient status of the soil (Meric et al. 2011), and overcoming issues with the accumulation of salts, pests, and diseases (Fan et al. 2012).
30
Salinity stress negatively affects tomato growth (Mohammad et al. 1998), fruit size, and fruit yield (Scholberg and Locascio 1999; Magan et al. 2008). However, many researchers believe that tomato plants that are grown under high-salinity conditions could contain increased levels of fructose, glucose, total soluble solids, amino acids, and organic acids (Wu and Kubota, 2008; Sato et al., 2006).
Okano et al. (2002) reported that the earlier a salinity stress was applied to the fruit development stages of single-truss tomato plants, the lower the fruit weight and the higher the soluble solids content. Similarly, Wu and Kubota (2008) showed that salinity stress from the beginning of the tomato fruiting stage resulted in higher fruit total soluble solid concentrations and fructose concentrations than stress from 4 weeks after fruiting began; and Saito et al. (2006) reported that salinity stress throughout the entire fruiting stage led to higher fruit quality than stress during either the first or latter half of the fruiting stage.
Previous studies have mostly focused on the effect of salinity stress on the fruiting stage in single-truss tomato cultivation systems. Consequently, very little information is available on the effect of salinity stress at different growth stages of tomato plants, or on the different trusses that are produced.
The objectives of this study were to investigate the effects of salinity stress at different growth stages of tomato on:
1. Plant growth, yield, fruit quality, and water use efficiency (WUE). 2. Frontal and later truss at different developmental stages of the truss.
3.2 Materials and methods 3.2.1 Experimental site
The experiment was conducted in a plastic house (5 m wide 11 m long) located at the Experimental Farm of Gifu University, Gifu Prefecture, Japan (35 27 51 N, 136
31
44 14 E) over 13 weeks from September to December 2015. The daily temperatures and humidities inside the house are shown in Fig. 3-1. During the experimental period, the average temperatures were 23.9°C (daytime) and 14.6°C (nighttime), the average humidities were 66.5% (daytime) and 96.6% (nighttime), and the average solar radiation was 7.0 MJ m 2 day 1.
3.2.2 Experimental design and treatments Cherry tomato (Lycopersicon esculentum
-3000; Minoru Kasei, Co., Ltd., Japan), which consists of a nutrient solution bucket, a plant table, and a plant bowl (Fig. 2-2). The standard nutrient solution Vegetable Life A (1.3% N, 1.2% P, 1.9% K, 0.32% Mg, 0.008% Mn, and 0.008% B; Otsuka Chemical Co. Ltd., Tokyo, Japan) diluted 200 times by tap water was used to cultivate the tomato plants, which has an electrical conductivity (EC) of 0.8 dS m 1. Sodium chloride (NaCl) was added to the solution to impose a salinity stress on the tomato plants.
The seedlings were cultivated at the farm of Gifu University. When they reached a height of approximately 20 cm, they were transplanted in a randomized complete block design with six plants per treatment, giving a total of 36 plants in 18 pots (two plants per pot).
In a previous study, we found that the salinity threshold of tomato was 1.41 dS m 1 under low salinity stress using the Vegetable Life A standard nutrient solution (Zhang et
al. 2016a). Therefore, a salinity level of 2.0 dS m 1 was used to represent a salinity stress in the present study. The growing period of each truss was divided into three growth stages: the vegetative stage (V) of the 2nd truss, i.e., the period from the beginning of the 1st truss flowering until the beginning of the 2nd truss flowering; the flowering stage
32
(FW) of the 2nd truss, i.e., the period from the beginning of the 2nd truss flowering until the end of the 2nd truss flowering; and the fruiting stage (FR) of the 2nd truss, i.e., the period from the development of the 1st fruit of the 2nd truss until the ripening of the last fruit of the 2nd truss. Six salinity treatments were applied to the plants: CT (N: control treatment; solution EC = 0.8 dS m 1 throughout the experiment), T1 (solution EC = 2.0 dS m 1 during the vegetative stage of the 2nd truss), T2 (solution EC = 2.0 dS m 1 during the flowering stage of the 2nd truss), T3 (solution EC = 2.0 dS m 1 during the fruiting stage of the 2nd truss), T4 (solution EC = 2.0 dS m 1 from the flowering until the fruiting stage of the 2nd truss), and T5 (S: solution EC = 2.0 dS m 1 throughout the experiment) (Table 3-1). The nutrient solution was replaced once every 2 weeks.
Lateral buds were pruned as they sprouted and the top bud was pruned in the fifth week (from 29 to 35 days after transplanting) when the plant was in the third flower truss stage.
3.2.3 Measurements 3.2.3.1 Transpiration
The daily transpiration rate (TP, g day 1) per pot was measured using the gravimetric method and calculated using the following equation:
where TPi is the transpiration rate on day i (g), Wi is the weight of the entire bucket
(including 13 L of nutrient solution) following irrigation on day i (g), and W'i+1 is the
weight of the entire bucket before irrigation on day i + 1 (g). Irrigation was carried out by adding the same amount of nutrient solution as had been lost through transpiration (i.e.,
TPi). The total TP per pot was divided between the two plants in each pot based on their
final plant biomass, and the total TP TP.
3.2.3.2 Plant growth parameters
33
per week. Leaf chlorophyll was also measured once per week using a SPAD chlorophyll meter (Minolta SPAD-502 meter, Tokyo, Japan). Yadava (1986) reported that there is an exact linear relationship between SPAD values and extracted leaf chlorophyll, and so these were used to describe leaf chlorophyll in this study. The dry weights of the upper parts of the plants and roots were measured by drying the plant materials at 105°C for 30 minutes and then at 70°C in a ventilated oven until a constant weight was achieved (Chen
et al. 2012).
3.2.3.3 Yield and WUE
The yield (g/plant) and number of fruit on each plant were measured during the harvest season. Fruit size was calculated by dividing the fruit yield of each truss by the number of fruit.
WUE was calculated in terms of total yield (WUEy, g/kg: grams of fresh fruit produced per kg of water) and biomass (WUEb, g/kg: grams of biomass produced per kg of water).
3.2.3.4 Fruit quality parameters
Fruit quality measurements were taken from fully mature tomato fruit that were of a similar size (17 ± 2 g) and had no appearance defects. Three fruit (one per truss) were chosen from each plant, giving a total of 108 fruit. Each fruit was juiced using a small juicer and the fruit sugar content (%) was measured with a hand refractometer (N-1E; ATAGO, Japan). The prepared juice was then diluted by 50 times using quinone reagent solution (RE-99432; ATAGO, Japan), following which the fruit acid content (%) was measured using a pocket acid meter (PAL-AC1; ATAGO, Japan).
3.2.4 Data analysis
34
3.3 Results
3.3.1 Plant growth
The fresh biomass and leaf chlorophyll levels were significantly different between plants exposed to the T5 treatment and the CT treatment (Table 3-2). The highest values of biomass and plant height were recorded when salinity stress occurred during the vegetative stage (T1). By contrast, the highest value of leaf chlorophyll was recorded when salinity stress occurred during the flowering stage (T2), followed by the fruiting stage (T3) and the no stress treatment (CT). The highest value of dry weight was also obtained when salinity stress occurred during the flowering stage (T2). For all growth indicators, the lowest values were obtained when salinity stress occurred throughout the entire experimental period (T5). Salinity stress at different growth stages significantly affected the ratio between yield and fresh biomass, with the CT treatment exhibiting the highest value followed by T1, and the T5 treatment having the lowest value.
3.3.2 Fruit yield
Salinity stress at different growth stages significantly affected the total yield and number of fruit (Table 3-3). The highest total yield and number of fruit were obtained with the control treatment (CT), while the lowest values were obtained with the T5 treatment. None of the treatments except T5 significantly affected the yield of the 1st truss. However, the T2, T3, T4, and T5 treatments significantly affected the yield of the 2nd and 3rd trusses compared with the CT treatment. Similarly, none of the treatments significantly affected the number of fruit on the 1st truss, whereas the T2, T3, and T5 treatments significantly reduced the number of fruit on the 2nd truss, and the T3, T4, and T5 treatments significantly reduced the number on the 3rd truss compared with the other