Tech Bull Fac Agr Kagawa Univ
SHALLOW-GROUND WATER IN THE DOWNSTREAM BASIN
O F T H E AYA RIVER, KAGAWA PREFECTURE
(4)
ON THE FLUCTUATION OF THE WATER TABLE IN THE RICE FIELDS CONSIDERED FROM THE ISOBATH MAPS OF THE STUDY AREA
Kiyoshi FUKUDA, Toshihide NAGANO, and Tadao MAEKAWA
Introduction
As reported in previous papers(' ')
,
we have been studying the conditions of the water table in the rice fields from the data obtained from our field investigations on 738 ha rice fields of the downstream basin of the Aya River, Kagawa Prefecture.From the data of the period from October 1964 to September 1965, we drew up 15 isobath maps of the study area. that is we drew up an isobath map for every month of the period. "An isobath map of the water table is a line on a land surface all points along which are the same vertical distance above the water table. And isobath shown on a map may collec- tivelly be called lines showing depth to the water tablen(').
In the rice fields, the depth measured from the soil surface to the water table is more important and more practicsl than the height of the water table measured from the sea level.
We have to know the depth of the water table and need to estimate the depth of the water table for each month. From the 15 isobath maps we were able to get 1) the fluctuation of the water table through a period, 2) the various shapes of the map as time past from the non-irrigation period to the irrigation period, 3) the relationship between the depth of the water table and its area, and 4 ) the effects of the irrigation water on the depth-area relationship.
Method
From the data t h e monthly average-water-table dapth of all the observation points were calculated. The depth of the water table measured from the soil surface, D (m), and its values varied from 0.14 m (DEL-1 in September 1965) to 3.36 m (BL-1 in January 1965). Thus, to draw up the equi-depth lines in the map, we divided the depth into seven classes 1)
0
5 m or less, 2 ) 0.5 to 1.0% 3 ) 1.0 to 1 . 5 ~ ~ ~4)
1.5 to 2.0m, 5 ) 2.0 to 2.5m, 6 ) 2.5 to 3.0m, and 7 ) 3.0 to 3.5 m.First, we drew u p an isobath map (Fig. 1 to Fig. 15) on a section paper; second, we traced tbe isobath on a 1 mm-section-tracing paper to calculate the area between the two equi-depth lines on the map. We counted the number of the 1 mm-meshes between the two equi-depth lines and calculated the lmm2 into h a . The poler planimeter method is generally
Vol 18, No 2 (1967) 187
used in counting the area of a map, however, we used the mesh-counting method because, although i t is more time consuming, it is simpler and there is less chance of an error occurring in the estimating.
To calculate the study area we have to have a boundary line for the area and to construct this boundary line, we divided the study area into two regions ; I ) the right side xegion of the Aya River, and 2) the left side region of the river. In each region, we connected the outside observation wells and used this connecting line as the boundary line. The boundary line forms a polygon on both sides of the Aya River, and we refere to these areas in the polygon as the study area (Fig. 1 to Fig. 15). Counting the number of 1 mm- meshes in the polygons, we obtained 492.85 ha for the right region, 157.94 ha for the left region, and therefore 650.79 ha for the study area. The right region makes u p 75.73 percent of the study area.
Results and Discussion
The seven-classes water -table depth and their areas in both the right and left regions of the study area Fig. 1 to Fig. 12 show the isobath map for every month of the year, and Fig. 13 to Fig. 15 show the average isobath map of the irrigation period, non-irrigation period, and the yearly average. From these figures, i t is clear that the deep water -table depth appeared to the foot of the mountain side and the narrow strips near the right side of the Aya River, and the shallow water-table depth appeared on the central part of the right region and the lower part of the left region.
From Fig. 1 to Fig. 12, we made up Table 1
.
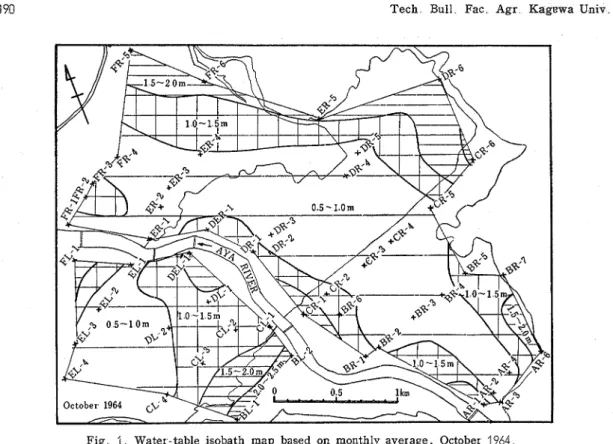
Table 1 shows the relationship between the seven-classes water -table depth and their areas for both region for every month of the year.October, 1964 ( F z g . 1)
October is the first month of the non-irrigation period. Thus, the distribution of the relationship between D (m) and A (ha) in this month i s affected by the irrigation water in the previous month (September).
Rzght t egzon: 0.5 m to 1.0 m-depth covered most of the central part, 276.05 ha or 56.01 percent. There are narrrow strips of 1.0 to 1 .5 m-depth, 151.37 ha or 30.71 percent of the region. There are three small strips and one belt shaped area of 1.5 to 2.0m-depth. The sum i s 64.13 ha or 13.01 percent. Area with 2.0 to 2.5 m-depth appeared arround BL-1 but is only 0.27 percent. 0.5m or less-depth and 2.5m or more-depth do not appear on either region
.
Left regzon: 0.5 to 1 .O fn-depth occupy 38.95 percent (61.52 ha) of the region; 1 .O to 1.5 m-depth is 41.24 percent (65.13 ha) ; 1.5 to 2 . 0 ~ ~ - d e p t h is 16.20 percent (25. 59 ha); and 2.0 to 2 . 5 ~ ~ - d e p t h is 3.61 percent (5.70 ha). Looking at the whole study area, 0.5 to I .O m-depth occupied 51.87 percent and 1.0 to 1.5 m-depth occupied 33.27 percent. Thus, both these areas made up 85.14 percent of the study area.
188 Tech Bull Fac Agr Kagawa Univ Table 1 The seven-classes water -table depth and their areas
for every mcnth of the year from Depth October November December January February March
Area 'lass (1 964) (1 965) m ha % ha % ha % ha % ha % ha % 0 0-0 5 0 0 0 0 0 0 0 0 0 0 0 0 0 5 - 1 0 27605 5 6 0 1 21927 4 4 4 9 1365 2 7 7 6 9 3 1 4 1 2 7 9 6 5 6 7 1040 2 1 1 1 0 - 1 5 151 37 30 71 187 17 37.98 366 20 74 30 328 10 6 6 5 7 311 31 63 17 313 19 6 3 5 5 A R 1 5 - 2 0 6413 1 3 0 1 8 5 4 9 17.35 10039 2 0 3 7 11949 2 4 2 4 10765 21.84 11455 2 3 2 4 2 0-2 5 1 30 0 27 0 92 0 18 12 49 2 53 38 25 7 76 43 45 8 82 51 98 10 55 2.5-30 0 0 0 0 0 12 0 03 0 08 0 02 2 48 0 50 2 73 0 55 3 0-3 5 0 0 0 0 0 0 0 0 0 0 0 0 Total 492 85 100 00 492 85 100 00 492 85 100 00 492 85 100 00 492 85 ! 00 00 492 85 100 00 0 0-0 5 0 0 0 0 0 0 0 0 0 0 0 0 05-1 0 6 1 5 2 3 8 9 5 5 0 4 2 31 92 1758 11 13 5 3 2 3 3 7 1524 9 6 5 4 7 3 2 9 9 1 0-1 5 65 13 41 24 77 83 49 28 79 68 50 45 92 11 58 32 86 14 54 54 74 32 47 06 A L 1 5 - 2 0 2559 1 6 2 0 2317 1 4 6 7 41 08 2 6 0 1 34.76 22.01 31 31 1 9 8 2 51 27 3 2 4 6 2 0-2.5 5 70 3 61 6 52 4 13 18 96 12 LO 9 64 6 10 15 37 9 73 20 15 12 76 2 5-3 0 0 0 0 0 0 6 4 0.41 1174 7 4 3 9 8 8 6 2 6 7 4 7 4 7 3 3 0-3 5 0 0 0 0 0 0 4 3 7 2 7 7 0 0 0 0 Total 157 94 100 00 157 94 100 00 157 94 100 00 157 94 100 00 157 94 100 00 157 94 100 00 0 0-0 5 0 0 0 0 0 0 0 0 0 0 0 0 0 5-1 0 337 57 51 87 269 69 41 44 31 23 4 80 12 25 1 88 43 20 6 64 15 13 2 32 1 0-1 5 216 50 33 27 265 00 40 72 445 88 68 51 420 21 64 57 397 45 61 07 587 51 59 55 Aw 1.5-20 8 9 7 2 1 3 7 9 10866 1 6 7 0 141 47 21.74 15425 2 3 7 0 13896 21 35 14582 25.48 2 0-2 5 7 00 1 07 7 44 1 14 31 45 4 83 47 89 7 36 58 82 9 04 72 13 11.08 2 5-3 0 0 0 0 0 0 76 0 12 11 82 1 82 12 36 1 9 0 10 20 1 57 3 0-3 5 0 0 0 0 0 0 4 3 7 0 6 7 0 0 0 0 Total 650 79 100 00 650 79 100 00 650 79 100 00 650 79 100 00 450 79 100 00 650 79 100 00 AR : The right region AL : T h e left region Aw : The whole study area
November, 1964 (Fzg .2)
Area with 0.5m or less-depth, and area with 2.5 m or more.depth do not appear on either region
.
Right region: 0.5 to 1 .Om-depth that made up 56.01 pelcent of the region (276.05ha) in October decreased to 44.49 percent (219.27iza) and it separated into two parts; one in the upper -central part and the other in the lower region. There are three areas of 1.0 to 1 . 5 ~ 2 -
depth and the sum is 37.98 percent (187.1 7ha) an increase from 30.71 percent (151.37ha). Along the foot of the mountain and on the right side of the Aya River, the areas of 1.5 to 2 . 0 ~ ~ - d e p t h made up 85.49ha (17.35 percent)
.
Near point AR-1 in the upper district of the region, there i s a negligibly small area of 2.0 to 2.5 m-depth, 0.92 ha (0 .I8 percent). Thus, area of 0 5 to 1 .Sm-depth occupied 82.47 percent of the region.Left regzon: In the central part of the region, there are 50.42ha (31.92 percent) of 0.5 to 1 .Om-depth. On both the upper and lower sides of this area, there are 77.83ha (49.28
in both the right and left regions and the whole study area October 1964 to September 1965.
April May June July August September
ha % ha % ha % ha % ha % ha %
percent) of 1.0 to 1.5 rn depth. 1.5 to 2 . 0 ~ ~ - d e p t h are in the lower and upper side of the 1 .O to 1 . 5 ~ ~ - d e p t h area, and they made up 23.17ha (14.67 percent). 2.0 to2.5m-depth appe- ared in the belt shaped area between point BL-1 and BL-2, 6.52 ha (4.13 percent). Thus, areas having 0.5 to 1 . 5 ~ ~ - d e p t h occupy 81.20 percent of the region. Looking a t the whole study area, areas with 0.5 to 1.5rn depth made up 82.16 percent of t h e study area.
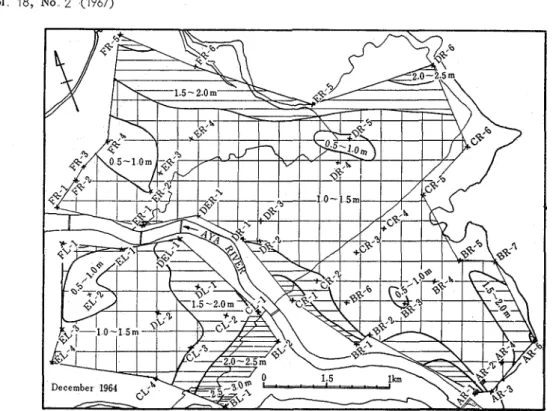
December 1964 (Fzg .S)
The shape of the isobath map is quite different from that of November's a s shown in Fig. 3. However, as in November areas with 0.5 m or less depth, and areas with 3.0 to 3.5 rn-depth do not appear on either region. But a small area having 2.5 to 3.0 rn-depth, the second deepest water -table depth, appears on both regions.
Rzght regzon: 1.0 to 1 . 5 ~ ~ - d e p t h increased from 37.98 percent i n November to 74.30 percent in December. However
,
the 0.5 to 1 .O m -depth areas decreased from 44.49 per cent in November to 2.77 percent in December and this separated into small areas as shown inTech Bull Fac Agr Kagewa Univ
Fig 1 Water. table isobath map based on monthly average, October 1964
Vol 18, No 2 (1967)
Fig 3 Water -table isobath map based on monthly average, December 1964.
Fig,3. There are four areas of 1.5 to 2 . 0 ~ ~ - d e p t h ; two are in the upper district, one i s near point CR-2, and the other is in the belt shaped area along the foot of the mountain. The sum is100.39 ha (20.37 percent). Areas of 2.0 to 2 . 5 ~ ~ - d e p h appear in five small areas; two are in the upper district, one is near point CR-1, one is near point DR-6, and the other is near point FR-5. The sum is 12.49 ha (2.53 percent). 2.5 to 3.0 m-depth appear at point AR-1, 0.12 ha (0.03 percent). Areas of 1.0 to 2.0 m-depth made up 94.67 percent of the region.
Left regzon: 0.5 to 1 .O m-depth area i s in the lower d i s t ~ i c t , 17.58 ha (1 1 .:3 peicent) ; and at the upper and lower sides of this area there are two areas of 1.0 to 1.5 m -depth, the sum of 79.68 ha (50.45 percent)
.
There are two areas of 1 .5 to 2.0 m .depth, and the sum is 41.08 ha (26.01 percent). 2.0 to 2.5 m-depth ax ea made up 18.96 ha (12.00 percent)Near point BL-1, there is a negligibly small area of 0.64 ha (0.41 percent) with 2.5 to 3.0 m-depth.
Areas having 1 .O to 2.0 m
-
depth made up 76.46 percent of the region.
Looking at the whole study area, areas having 1.0 to 2.0 m-depth occupy 90.25 percent. But the areas having the same depth were only 47.06 percent in October, and 57.42 percent in November.
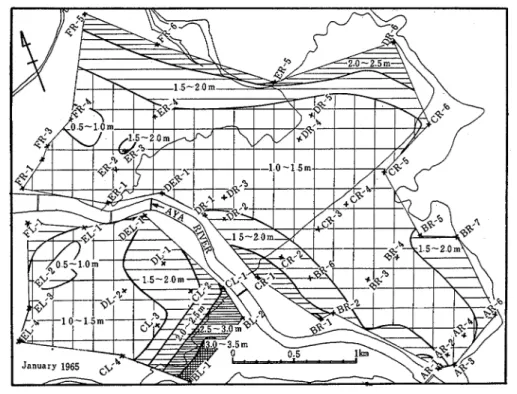
January (Fzg
.
4) , February (Fzg. 5),
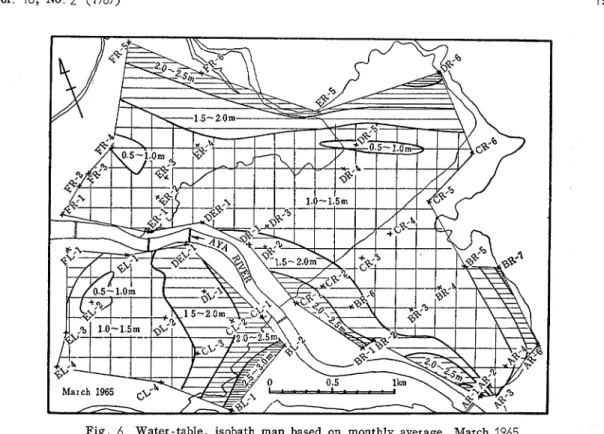
March (Fzg.
6),
and Aprzl (Fzg. 7) zn 1965
According to our field investigations, the water-table depth in the four months of January, February, March, and April stayed in the low stage of the phreatic cyclec3), in
Tech Bull. Fac. Agr. Kagawa Univ.
Fig. 4. Water-table isobath map based on monthly average, January 1965.
Vol. 18, No. 2 (1967)
F i g . 6 Water -table, isobath map based on monthly average, M a ~ c h 1965
194 Tech Bull Fac Agx Kagawa Univ
other words, the water table in these months were the deepest of the year.
The shape of the isobath maps for the four months are very much alike. Therefore, we shall discuss the characteristics of the isobath maps of four months a s a group hereafter.
Through this period, the shallowest water -table depth or 0.5m or less-depth does not appear on either region However, area having 3 0 to 3 gm-depth, the deepest water -table depth, appear in the left region in January.
Rzght region: Areas having 0 . 5 to. 1 .Om-depth occupy a small percent of t h e region; they varied from 1 41 percent (6 93 ha) in January to 5.67 percent (27.96 ha) in February. Areas having 1 0 to 1 5 m-depth spread from the upper district to the lower district (Fig. 4 to Fig. 7). And they vary from 63.17 percent (31 1 "31 ha) in Februar y to 66.57 percent (328 10 ha1 in January 1 5 to 2 0 m -depth var y from 21 -37 percent (1 05.35 ha) in April to 24 24 percent (119 49 ha) in January. 2 . 0 to 2 5 m-depth increases from 7.76 percent (38.25 ha) i n January to 10.55 percent (51.98 ha) in March. Areas having 2 5 to 3.0 m- depth are negligibly small being below one percent.
Thus, areas having 1 0 to 2.0 rn-depth occupy from 85.01 percent (February) to 90.81 percent (Januarv) of the region. Areas having 2.0 to 2.5 m-depth increase from 7.76 percent (January) to 10 55 percent (March) whereas they were only 0 18 percent (Novem- ber) to 2 53 percent (December).
Left regzon: Areas having 0.5 to 1 0 m-depth vary from 2 26 percent (April) to 9.65 percent (February). 1.0 to 1 5 m-depth area occupies about half of the region from 47.06 percent (74.32 ha) in March to 58 32 percent (92 11 ha) in January. Areas of 1.5 to 2.0 m - depth vary from 19.82 percent (31 31 ha) in February to 32.46 percent (51.27 ha) in March. 2.0 to 2.5 m-depth areas increase from 6.10 percent (9 64 ha) in January to 16 14 percent (25.49 ha) in April. 2.5 to 3.0 m-depth areas decrease from 7.43 percent in January to 1.66 percent in April In January, areas having 3.0 to 3.5 m-depth appear near point BL-1, 4.37 ha (2.77 percent).
Thus, areas having 1.0 to 2.0 m-depth occupy from 74 36 percent (February) to 79.94 percent (April) of the I egion.
In the whole study alea, the 1 0 to 2.0 m-depth areas occupy from 82 42 percent (Febru- ar y) to 88 27 per cent (January)
.
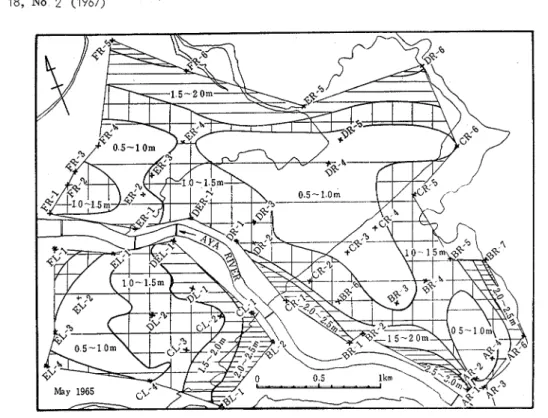
May, 1965 ( A g . 8)
The isobath map of May changed a great deal from that of the four previous months. It slightly resembled the map of November The water-table in May was on the period of rise, thus, areas having the shallow water -table depth (0.5 to 1 . O m-depth) increased to about 19 times that of April Areas having 0 . 5 ~ or less-depth and areas having 3 0 to 3 5rn-depth do not appear on either region.
Rcght regzon: Areas having 0 5 to I .O m-depth appear in three areas; one i s a 19.64 ha-area in the upper district, one is a 138 67 ha-area in the central district, and the other in a 35.70 ha-area in the lower district of the region; the sum is 194.01 ha, 39.7 percent of the region In April the areas having the same depth was only 1.76 percent of the region The 1.0 to 1 5 m-depth areas occupy 39.09 percent (1 92.64 ha) ; i t was
Vol 18, No 2 (1967)
Fig 8 Water -table isobath map based on monthly average, May 1965
65 ,, 63 per cent in April.
Along the foot of the mountain and along the right side of the Aya River, there are 1.5 to 2..0 m-depth areas, 85.13 ha (17.27 percent).
Areas having 2.0 to 2.5 m-depth occure in five places as shown in Fig.8 and they make up 3.79 percent (18.70 ha) of the region: i t was 10.25 percent in April.. Near point AR-1 along the right side of the Rya River and near point BR-7 along the foot of the mountain, there are two small areas having 2.,5 to 3.0 m-depth, only 0.48 percent (2.37 ha). Thus, 0..5 to 1 ., 5 m-depth areas occupy 78.46 percent whereas they were 67.44 percent in April.
Left region: 0.5 to 1.0 m-depth occupy 40.,97 ha (25.94 percent). Area having the same
depth was only 2.26 percent in April.. There are three areas having 1 ..O to 1.5 m-depth; one is in the upper district, one is at the foot of the mountain and the other is in the lower district. The sum equals 68.95 ha, 43.66 percent .. I t decreased from 58.32 percent (January) to 47.06 percent (Marchj
..
There are two areas having 1 . 5 to 2.0 m -depth, 34.67 ha, 21 "95 percent.. I n April, i t was 32.42 percent.There is a area having 2.0 to 2.5 m-depth, 13.35 ha, 8.45 percent. A decrease from 16.14 percent in April.. 0.5 to 1 ..5m-depth occupy 69.60 percent of the region whereas it was 49.78 percent in April
..
For the whole study area, 0.5 to 1 ..5 m -depth occupied 76.31 percent (in April, it occup- ied 63.15 percent). 1.0 to 2.0 m-depth covered 58.61 percent of the study area whereas they covered 85 ,,33 percent in April ..
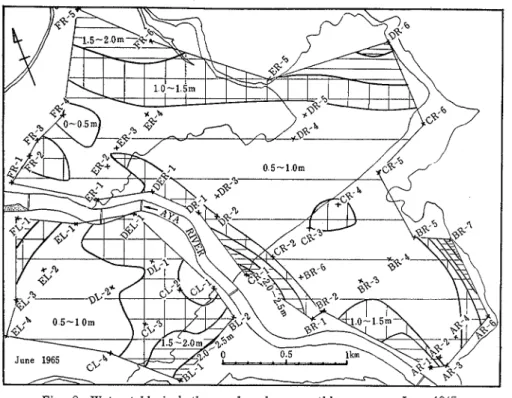
196 Tech Bull Fac Agr Kagawa Univ. ,June, ,1965 ( F i g .9)
The irrigation period begins in June and the water is used for the rice fields from the middle of this month. As the result, the water table rises, and areas having a deep water -table depth become very small, 1.5 m or more-depth are below 9.0 percent. Small areas having the shallowest water table of 0.5m or less-depth appear in the lower district on the right region.
Fig. 9. Water -table isobath map based on monthly average, ,June 1965..
Rzght region: 0.5 m or less-depth-area appears near point FR-4 in the lower district, but it i s 1.50 percent of the region. A greater part of the region, from the upper district to the lower district of the region is occupied with 0.5 to I .O m- depth area, 309.88 ha,
62.87 percent. Areas having the same depth weIe 39.37 percent in May,. There are six areas of 1 .,O to 1.5 m-depth; two along the foot of the mountain, three along the right side of the A Y ~ River, and the other in the central part of the region. The sum equals 126.00 ha, 25.57 perccent.. Areas having the same depth were 39.09 percent in May. There are five areas having 1.5 to 2.0 m-depth; three along the foot of the mountain and two along the right side of the Aya River. The sum equals 43.21 ha, 8.77 percent. There a r e four small areas having 2.0 to 2.5 m-depth; one around point, AR-1, two along the foot of the mountain, and the other is near CR-1 along the right side of the Aya River. The sum equals 5.58 ha, 1 .I3 percent. Around points CR-1, and BR-7 there are small area having 2.5 to 3.0m-depth making up 0,,77ha, 0.16 percent.
Area having 0.5 m or less to 1.5 m-depth increased from 78.46 percent in May to 89.94 percent in June.
Vol,. 18, No.. 2 (1967) 197 Le,ft region: Area having 0.5 m or less-depth does not appear in this region. 0.5 to 1 .Om-depth are in two areas; one large area i s in the lower-half part of the region, and the other is i n the upper part of the region. The sum is 76.87 ha, 48.67 percent. It was 25.94 percent in May.
There are two areas having 1 .0 to 1.5 m-depth; a large area on the upper side and a small area on the lower side. The sum is 64.99 ha, 41 .I5 percent. 1.5 to 2.0 m-depth makes up 14.36 ha, 9.09 percent, it was 21.95 percent in May. Around point BL-1, there is a small area having 2.0 to 2.5 m-depth, 1.72 ha, 1.09 percent. I t was 8.45 percent in May.
Area having 0.5 to 1.5 m -depth is 89.82 percent; it was 69.60 percent in May
.
For the whole study area; areas having 0.5 to l.Om-depth increased from 36.11 percent in May to 59.43 percent: 1 . 0 to 1 . 5 ~ ~ - d e p t h decreased from 40 20 percent to 29.35 percent: 1.5 t o 2.0 m-depth decreased from 18.41 percent to 8.84 percent: 2.0 to 2 . 5 ~ - d e p t h decreased from 4.92 pereent to 1 .I2 perccent : and 2.5 to 3.0 m-depth decreased from 0.36 percent to 0.12 percent.
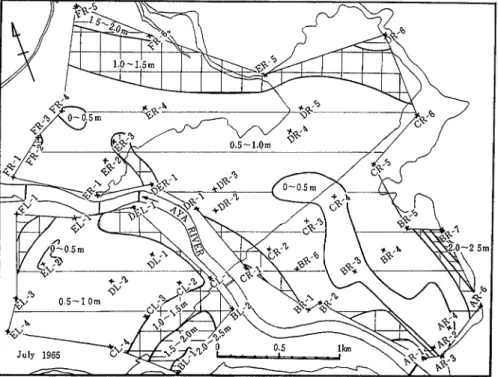
July, 1965 (Fzg. 10) In July, 3.0 to 3.5m-depth does not appear on either region.
Rzght region: There are two areas of 0.5 m or less-depth; one in the upper central part and the other in the lower part, and the sum is 51.36 ha, 10.42 percent. I t was 1.50 percent in June. Over half of the region i s occupied with 0.5 to 1 .O m -depth, 327.17 ha, 66.38 percent There are six areas having 1 .0 to 1.5 m-depth; two along the foot of the
198 Tech Bull Fac. Agr Kagawa Univ mountain, and the other along the right side of the Aya River. The sum is 100.36 ha, 20.37 percent. There are five small areas of 1.5 to 2.0 m-depth; three along the foot of the mountain, the other along the right side of the Aya River. The sum is 12.53ha, 2.54 percent.
Thus, areas having 0 . 5 m or less to 1.5 m-depth occupy 97.17 percent of the region. Left region: There i s a small area, 1.39 percent of 0.5 m or less -depth in the lower part of the region. Around the area, there is a big area of 0.5 to I . 0 m-depth, 108.94 ha of 68.98 percent of the regioa. There are two areas having 1 . 0 to 1 . 5 m-depth; one big area i n the upper side and the other in the lower side. The sum is 33.55 ha, 21 "24 percent.
There are two areas having 1.5 to 2 0 m-depth; one i n the upper side and t h e other in the lower side of the region and the sum is 11.92 ha, 7.55 percent. Near point BL-1, there is a small area having 2.0 to 2.5 m-depth; 1 .35 ha, 0.84 percent.
Thus, areas having 0.5 m or less to 1.5 m-depth occupy 91.61 percent of the region: it was 89.82 percent in June. For the whole study area, 95.82 percent of i t is occupied with 0.5 m or less to 1 . 5 m-depth-area It was 89.92 percent i n June.
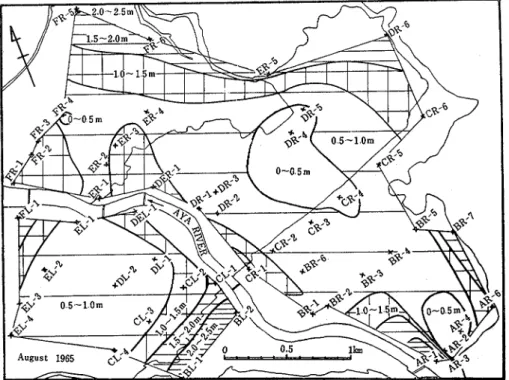
August, 1965 (Fzg. 11)
In August, the irrigation water is cut off for several dyas to strengthen the roots of the rice plants, thus, the water table declines below the average water-table depth in July and September(" Areas having the shallowest water -table depth, 0 . 5 m or less-depth, divides into three. Areas having 1.0 to 1.5m-depth and 1 5 to 2 . 0 ~ ~ - d e p t h increased slightly from that of July.
Vol 18, No 2 (1967) 199 Rzght regzon: There are three areas of 0.5 m or less area; one is a small area around AR-4 in the upper district, one is around point CR-4 and DR-4 in the central district, and the other is a small area around point FR-4 in the lower district. The sum i s 58.80 ha, 11.93 percent. This, 11.93 percent is the largest value of this depth through the year There is a big area having 0.5 to l.Om-depth of 269 l o h a , 5 4 6 0 percent. The area having the same depth was 66.38 percent in July. There are six areas of 1 0 to 1.5 m- depth; two are along the foot of the mountain and four are along the right side of the Aya River. The sum is 121 .I3 ha, 24.58 percent. There are four areas having 1.5 to 2.0 m-depth, two are along the foot of the mountain and two are along the right side of the Aya River. The sum is 42. 24 ha, 8.57 percent. I t was 2.54 percent in July. There are two small areas of 2.0 to 2 5 m-depth, one i s around p o ~ n t AR-1 in the upper district and the other is around point FR-5 in the lower district. The sum is 1.58 ha, 0.32 percent. Thus, areas having 0.5 m cr less to 1.5 m -depth occupy 91 11 percent of the region. I t was 97.17 percent in July.
Left regzon: There are no areas having 0.5 m or less-depth. These is a big area having 0.5 to 1 .O m-depth, 103.33 ha, 65 42 percent There are two areas having 1.0 to 1.5m-depth, 31.44 ha, 19.91 percent There are two areas of 1.5 to 2.0 m-depth, one in the upper district and the other in the lower district. The sum is 13.50 ha, 8.55 percent. Along the line connecting points BL-1 and BL-2, there is a belt shaped area having 2 0 to 2.5 m-depth, 9.67 ha, 6.12 percent. Thus, areas having 0.5 m or less to 1.5 m-depth occupy 85.33 percent of the region: I t was 91.61 percent in July
For the whole study area, areas having 0.5 m or less to 1.5 m-depth occupy 89.71 percent of the study area; it was 95.82 percent in July.
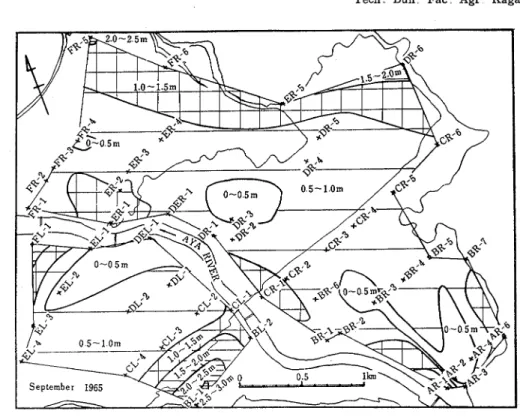
September. 196'5 (Fcg. 12)
September i s the phreatic-high,.rnonth, thus, the water table is the shallowest of the yearC5).. Areas having 2.0 m or more-depth do not appear io the right region, and areas having 3.0 to 3.5 m-depth do not appear on either region.
Right region: There are three areas having the shallowest water-table depth of 0.5 m o r less; one in the upper district (including three points AR-2, AR-4, and BR-3, one i n the central district (near point DR-3), and the other a small area aronnd point FR,-4 in the lower district. The sum is 46.90 ha, 9.51 percent. There is a big area having 0.,5 to 1 .Om- depth as shown in Fig. 12. This area spreads over the region from the upper to the lower districts, and covers 319,,50 ha, 64.,83 percent.. It was 54.60 percent in August. There are five areas having 1.0 to 1 " 5 m-depth: two along the foot of the mountain, and three along the right side of the Aya River. The sum is 122,,23 ha, 24.80 percent. There are three areas having 1 ..5 to 2 ,,0 m
-
depth; two along the foot c f the mountain near point DR-6, and FR-5, and the other around point AR-1 on the right side of the Aya River in the upper districts. The sum is 4,,22 ha, 0.86 percent. This 0.86 peIcent i s the smallest value for this depth through the year (the largest value is 24.24 percent in ,January).Thus, area having 0.5 m or less to 1.5 m-depth occupy 99.14 percent of the region, and this is the larqest value through the gear. The smallest value is 65.66 percent i n March.
Tech Bull Fac Agr Kagawa Univ
Fig 12 Water -table isobath map based on monthly average, September 1965
Left regzon: On a line connecting two points, EL-2 and DEL-1, there is a wedge shaped area of 26.10 ha, 16.53 percent, having 0.5 rn or less -depth This value of 16-55 percent is the largest through the year: the second largest is 1 39 percent in July. There is a big area having 0.5 to 1 .O m-depth 95.89 ha, 60.71 percent. There are two areas having 1.0 to 1.5 m-depth and the sum i s 17 49 ha, 11.07 percent The value of 11.07 percent is the smallest through the year (the largest is 58.32 percent in January)
.
There are two areas having 1.5 to 2.0 m-depth, 1 1 82 ha, 7.48 percent. Value of 11.82 ha is the smallest through the year (the largest i s the 51 27ha in March). There is an area of 5.70 ha, 3.61 percent, having 2.0 to 2.5 nz -depth. Around point BL-1, there is a small area having 2.5 to 3.0 m-depth, 0.94 ha, 0.60 percent.Thus, ar ea having 0.5 or less to 1.5 m - depth occupy 88.31 percent of the region. For the whole study area, areas having 0.5 m or less to 1.5 m-depth occupy 96.52 percent of the study area which is the largest value through the year The smallest value is 61 87 percent in M a ~ c h .
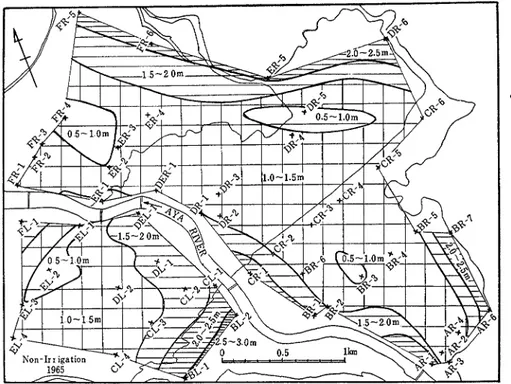
Irrzgatzon Period (Fzg. 1 3 ) , Non-lrrzgatzon Perzod (Fzg 1 4 ) , and the :'early Average (Fzg. 15)
A s a concluded isobath map, we made up two periodical isobath maps, irrigation and non-irrigation, and a yearly average isobath map as shown in Figs. 13, 14, and 15. The area each water-table depth covered and its percentage was calculated as listed on Table 2. The isobath map of the irrigation period (Fig. 13) is quite different from the non-irri- gation's (Fig. 14)
Vol.. 18, No. 2 (1967)
Fig 13 Water -table isobath map based on periodical average, irrigation period from ,June to September 1965
Fig. 14. Water -table isobath map based on pericdical average, non-irr igation period from October 1964 to May 1965.
Tech. Bull Fac Agr Kagawa Univ.
Fig 15 Water -table isobath map based cn yearly average from October 1964 to September 1965
Tabel 2 T h e seven-classes water-table depth and their areas in the whole study area for both t h e irrigation and non-irrigation pericds and t h e yearly average
Depth Irr igation Non..irrigation Yearly average
class period period
u1 ha % ha % ha % 0
olo
5 0.5-1 0 1 0-1 5 1 5-2 0 2 0-2 5 2 5-3 0 3 0-3 5 TotalDuring the non-irrigation period, the shallowest water -table depth 0,,5 rn or less-depth does not appear in the study area but there is a 1.69 percent during the irrigation period.. Over half of the study area (69.,32 percent, 451 .I2 h a ) is occupied with 0.5 to 1.0 rn- depth area during the irrigation period whereas it only covers 7.63 percent, 49.65 ha during the non-irrigation period.
Aneas with 1 .O to 1 - 5 rn-depth are 22.41 percent, 145.,81 ha, during the irrigation period whereas i t occupys over half of the study area, 64.94 percent, 422.63
ha,
during the non-Vol 18, No 2 (1967)
irrigation period Thus, the area with 0.5 m or less to 1.5 m-depth occupys 93.42 percent of the study area during the irrigation period whereas it occupys 72 57 percent during the non-ir rigation period.
On the other hand, there isn't any area with 0 5 m or less-depth through the study area There are 36.25 percent of 0 5 to 1 0 m depth and 47
57
pciccnt of 1.0 to 1.5 m-depth during the yearly average; thus, areas with 1.5 m or less depth occupys 83.82 percent of the study area.
The Percentage of the Area zn the Seven-Classes Water-Table of the Depth
Table 3 shows the percentage of the areas in the seven-classes of the water -table depth of the study area through the year from October 1964 to september 1965. This table was made up from Table 1 From Table 3, we were to see the structure of the seven-classes of the water -table depth for each month
Table 3 T h e percentage of the area in the seven-classes of the wate1-table depth for the whole study area
- --
Percentage of the area Month O / _ D ~ 0 . 5 m 0 5LDLl.Om 1 O L D d l . 5 m 1 5/-Dd2 Om 20/-DL2 5m 2 . 5 / ~ D ~ 3 . 0 m 3 0 4 D d 3 5m October 1964 November December January 1965 Febr uar y March April May June July August S e p t e m b e ~
D : The water-table depth, m
Ayeas having 0 . 5 m or. l e s s - d e p t h : Areas having the shallowest water-table depth of 0 . 5 ~ . or less-depth appeared for four months of the irrigation period, and they increased from 1 .I4 percent (June) to 11.22 percent (Sept.ember) of the study area..
Areas having 0 . 5 t o 1 . 0 m - d e p t h : The percentage of the areas having 0.5 to 1 ..Om-depth varied from 1.88 (January and April) to 67.01 (.July). During the irrigation period, they were 57.,23 (August) to 67.01 (July) and they varied from 1.88 (January and April) to 6.,64 (February) in the four months of the low stage of the phreatic cycle..
During the period of decline, the percentage of area having 0.5 to 1 .Om-depth decreased from 51.87 (October) to 4..80 (December), and duriug the period of rise, the percentage increased from 1 ,,88 (April) to 59 ..43 (June)
..
A r e a s having 1.0 t o 1.5m-depth: Through the year, areas having 1.0 to 1.5m-depth occupied from 20.58 percent (July) to 68,,51 percent (December) of the study area, during
204 Tech Bull Fac Agr Kagawa Univ
the irrigation period, the percentage was from 20.58 (Ju1y)to 29.35 (June) and in the four months of the low stage i t was from 59.55 (March) to 64.57 (January). During the period of decline, the areas increased from 3527 percent (October) to 68.51 percent (December) whereas they decreased from 61.27 percent (April) to 29.35 percent (June) of the study area during the period of rise.
Areas havzng 1.5 to 2.0 m-depth: Areas having 1.5 to 2.0 m depth vaired from 2.46 percent (September) to 25.48 percent (March). D u ~ i n g the irrigation period, the areas occupied 2.46 percent (September) to 8.84 percent (June) whereas they occupied f rom 21.35 percent (Februar y) to 25.48 pencent (March) of the study area during the four months of the low stage. During the period of decline, the areas increased from 13.79 percent (October) to 23.70 percent (January) whereas they decreased from 24.06 percent (April) to 8.84 percent (June) during the period of rise.
A r e a s havzng 2.0 t o 2 . 5 ~ - d e p t h : Areas having 2.0 to 2.5m-depth occupied a small percentage of the study area through the year, they ranged from 0.41 percent (July) to 11.68 percent (April). During the irrigation period, they were frcm 0.41 percent (July) to 1.73 percent (August) whereas they increased from 7.36 percent (January) to 11.68 percent (April) during the four months of the low stage. During the period of decline, the areas increased from 1 .07 percent (October) to 7.36 percent (January) whereas they de- creased from 11.68 percent (April) to 1 .I2 percent (June) during the period of rise.
Areas havzng 2.5 to 3 . 0 m - d e p t h : Except for the three months of October, November, and August, areas having 2.5 to 3 . 0 ~ ~ - d e p t h appeared for nine months of the year, and they varied from 0.01 percent (July) to 1.90 percent (February) of the study area.
A r e a s having 3.0 to 3.582-depth: Areas having 3.0 to 3.5%~-depth appeared one month, in January but i t was only 0.67 percent of the study area.
T h e AY eas sn Per centage o f the Cumulated Seven- Classes Water -Table Depth
Table
4
shows the variation of the percentage of areas of the cumulated seven-classes of the water-table dept'h from October 1964 to September 1965 This table was made up from Table 3.Areas havzng 0.5m or. less to I.Om-depth: Areas having 0.5m or less to 1 ..Om-depth vary from 1.88 percent (,January and April) to 75.24 percent (July). These areas occupy frcm 60.57 percent (,June) to 75.24 percent (July) during the irrigation period whereas they occupy 1.88 percent (April and .January) to 6.64 percent (February) during the four months of the low stage. ]During the period of decline, the area decrease from 51.87 per- cent (0ctol;er) to 1.88 percent (January)
.
During the period of rise, these areas increased from 1 .,88 percent (April) to 75.24 percent (,July). Thus, during the irrigation period, over 60 percent of the study aIea had 1 .Om or less-depth water-table depth.Areas having 0.5% or. less to 1.5m-depth: During the period of decline, areas with 0 . 5 ~ or less to 1 . 5 ~ ~ - d e p t h decreased from 85.14 percent (October) to 73.31 percent (De- cember). During the four months of the low stage, these areas stayed in the 60 percents going from 61.87 percent (March) to 67.71 percent (February)
.
During the period of rise, they increased from 63,.15 percent (April) to 95.82 percent (July). During the irrigation period, they stayed around the 90 percents level going 89.71 percent (August) to 96.52Vol.. 18, No. 2 (1967) 205
Table 4 The area in pe~centage of the cumulated seven-classes water-table of the whole study area.
Area in percentage Month
DLO. 5m DL1 ..Om DL1 ..5m DL2..Om DL2..5m D d 3 . Om DL3.5m
October 1964 November December Januar y 1965 February March Apr il May .June July August September
D: The Water-table depth, m
percent (September)
.
Thus, 1 .5m or less -depth water-
table depth occupy the whole study area during the irrigation period whereas they occupy roughly half of the study area during the four months of the low stage.. During the four months of low stage, most of the study area is occupied with a 2.0m or less water-table depth.Summary
From the results of the field investigation on 738ha rice fields of the downstream basin of the Aya River, Kagawa Prefecture, we drew up 15 isobath maps for every month from October 1964 to September 1965, and for the periodical average, both irrigation and non,. irrigation, and the yearly average.
Using these 15 isobath maps, we carried out a study on the relationship between the water-table depth and its area through the year. The method we used and the results of the study are as follows;
1) To calculate the study area, we divided the study area into two regions, right side and left side region of the Aya River. And the area of the right region was calculated as 492.85 ha, and left region was 157.94 ha. The sum of 650.79 ha was ref ered to as the whole study area.
2) We calculated the depth of the water-table measured from the soil surface into seven-classes; 1) 0 0 5 m or less, 2) 0.5 to 1 ..0 m , 3) I ,0 to 1.5 m, 4) 1.5 to 2.0 m, 5) 2.0 to 2.5m, 6) 2.5 to 3 . 0 ~ 2 , and 7) 3.0 to 3 . 5 ~ .
Area having 0.5m or less-depth appeared only during the four months of the i~rigation period (,June, July, August, and September'), and it increased from 1 .I4 percent (June) to 11.22 percent (September) of the study area. Area having 0.5 to 1 .O m-depth varied from 1 .,88 percent (,January and April) to 67.01 percent (,July)
.
During the irrigation period, this area was around the 60 percents whereas it was only several percent during206 Tech Bull Fac Agr. Kagawa Univ the four months (January, Feb~uary, March, and April) of the low stage. Area having 1.0 to 1 5 m-depth appeared every month, and its value varied from 20 58 percent (July) to 68 51 percent (December) And this area was around the 20 percents during the irrigation period whereas i t was around the 60 percents during the low stage Area having 1.5 to 2 . 0 ~ ~ - d e p t h varied from 2.46 percent (September) to 25 48 percent (March) and i t was about 2-9 percent during the irrigation period whereas it was around the 20 percents in the low stage. Area having 2.0 to 2.5 m .depth varied from 0.41 percent (July) to 11.68 percent (April) and i t was only about one percent during the irrigation period whereas it was about 10 percent during the low stage.
Areas having 2.5 to 3.0m-depth varied from 0 01 percent (July) to 1.90 percent (Febru- ary). This area was zero percent in October, November, and August Areas having 3 0 to 3 5m-depth appeared in January, and its area was only 0.67 percent of the study area. During the irrigation period, around the 90 percents of the study area was occupied by the area having 1.5 m or less-depth.
On the other hand, during the low stage, about 90 percent of the study area was occupied by the areas having 2.0 m or less-depth.
During both the irrigation and non-irrigation period, relatively deep water -table depth appeared along the foot of the mountain, and along the right side of the Aya River. On the other hand, areas having relatively shallow wtear-table depth appeared in the central part of both regions
Acknowledgments
The writers wish to thank Professor Hitoshi FUKUDA and Assistant Professor Hiroyuki OGATA both of Tokyo University for their advice and encouragement. We also want to thank the people who observed the wells, and Mr Katashi KODERA, MI. Taizo SATO, and Mr Hachiro Aozu former students of Kagawa University for their help in carrying out the investigations The help of Mrs. Chieko MATSUBARA a member of our laboratory in making the calculations, charts, and figures is greatfully acknowledged. A part of ex- penditure was defrayed by the research fund donated by the Ministry of Education
References
(1) FUKUDA K
,
OCHI T,
MAEKAWA T,
KONO Y,
SHIIKI K,
NARUHIRO T , and SHIMONO S : Tech Bull Fac Agr,
Kagawa Univ , 17 29- 35 (1965)12) FUKUDA K
,
NAGANO T , and MAEKAWA T Tech Bull Fac Agr,
Kagawa Univ,
18 54- 69 (1966)(3) FUKUDA K
,
NAGANO T , and MAEKAWA T : Tech Bull Fac A g r . , 18 60 (1966)141 FUKUDA K , NAGANO T
,
and MAEKAWA T : Tech Bull Fac A g r,
Kagawa Unzv,
18 60(1 976)
(5) FUKUDA K
,
NAGANO T,
and MAEKAWA T : Tech Bull Fac Agr,
Kagawa Unzv,
18 60 (1966)(6) MEINZER 0 E : Outlzne o f Ground- Water Hydrology 34 Government P ~ i n t i n g Office Washington, U S A (1923)
(7) OCHI T
,
FUKUDA K,
and AOKI T : Tech Bull Fac A g r . , Kagawa Unzv,
17 42-49 (1 965)Vol 18, No 2 (1967)
@ ~ I I - F % R ~ K % W & E % R ~ B - F ~ ~
(4)
Isobath map 7 5 4 b
& ~ ~ ~ B ~ ~ A % Q I E R ~ ~ A - F ~ ~ Q I
~BdmgLlJB%
i J > / i i ~ i ~ \
.
@.7k3f.c%b\ T U, i 7 J R@iQ 1 @<
< 2B , @&X@iYJk, i J $ 9 S % k Z 2 T253 3:
?
z
T, 1964% 7 a fi % $ % ~ e ~ ~ a @ B u D % E c c 5 6, 1964FIOA-1965F9A
0 1+?&ID
data%%BL,
1 Z
~ € I ~ Y J K ? ~ T R & & ~ & ~f&7;7kB (ftiJgisa b a g & ) &O 5m ~ I J & E, ft&gfi~ b 3 5m 9 e 0 P d Q 7 tWi!k~EX53
L,
Isobath map%?f"FH
L kz
~ L B , & A 7$j.m
((7shAfiib1, SiJ./ii~ibl&q), %lr$2%??+30 Isobath map 2~3;h815!2!e&6~ Z f i b 0 Isobath map iJ3b7 @@c 2 DfIii%Bg& L, i37;7kBfit, ~ 0 ~ r f i ~ T 4 f ! % D i % % & % ~ k i@hi5k&E;hk7 T , f~ 7;7kB~s+?~7iYJ, SEtt'gkd$&~@&fiitTB b i s ~ ~ k - 3 k k % , Z 0 R % K Ufc%&RW%%B(%Zb7T%.
fi@>
0 % @ ? 2 9 K k L z E a B Q s b + o