JAIST Repository
https://dspace.jaist.ac.jp/
Title
On the Use of the Grants-in-Aid Classification System to Analyze the Department Level Scientific Publications of a University
Author(s) Gautam, Pitambar; Okada, Naosuke
Citation 年次学術大会講演要旨集, 32: 534-539
Issue Date 2017-10-28
Type Conference Paper
Text version publisher
URL http://hdl.handle.net/10119/14864
Rights
本著作物は研究・イノベーション学会の許可のもとに 掲載するものです。This material is posted here with permission of the Japan Society for Research Policy and Innovation Management.
2D05
On the Use of the Grants-in-Aid Classification System to Analyze the
Department Level Scientific Publications of a University
科研費分野分類を用いた大学の部局別研究論文業績の分析について
○Gautam Pitambar,Okada Naosuke(Hokkaido University)Abstract
This study explores the utility of the KAKEN-L3 schema, based on the Grants-in-Aid disciplinary classification available in InCitesTM analytical tool since 2015, using a subset of 13,519 core journal articles and reviews published during 2009-1013 by a comprehensive Japanese research university. A qualitative comparison of the findings using the new scheme with those derived from several others (ESI 22 fields, WoS 251 categories, OECD Frascati 38 fields) and SCOPUS (27 areas, ASJC 333 categories) using partial datasets for selected department has been also given. The KAKEN-L3 schema provides new insights into the disciplinary contributions, particularly by discriminating the fundamental versus applied research as well as cross-disciplinary research of the university. Its use results in comparatively large number of documents per disciplinary category, leading to large differences in interpretation depending on the mode of counting (whole and fractional). This fact requires due consideration while using the data for benchmarking/evaluation purposes.
Keywords: Bibliometry; KAKEN schema; Cross-disciplinarity; Web of Science; Scopus
1. Introduction
Grants-in-Aid or the KAKENHI - the largest competitive funding program in Japan accounting for more than 50% of all competitive funding by the government, support the research at universities and research institutions across Japan covering all fields from the humanities to the social sciences and natural sciences, and aim at creative, pioneering scientific research from basic to applied fields (MEXT, 2017). Until FY2017, submissions to KAKENHI were made in 321 fields subdivided into 432 screening divisions organized hierarchically into 4 levels. National Institution of Informatics (NII) and Thomson Reuters jointly developed the KAKEN (the KAKENHI awards articles database (https://kaken.nii.ac.jp/en/)) to Web of Science (WoS) category-to-category mapping system (Web of Science, 2017) using a bottom up approach of matching the KAKEN and the WoS core collection journal articles. The KAKEN Schema, with KAKEN-L2 10 categories and KAKEN-L3 66 categories (2007 version), is available in InCitesTM since 2015. In the latter, single WoS
Category can be assigned multiple KAKEN categories, and vice versa.
In order to exploit the benefits offered by the new KAKEN-L3 schema, this study analyses a representative set of peer-reviewed publications from a university for the whole university and its departments, dedicated to science, technology, engineering, mathematics, and medicine.
2. Publications Data and Methods of Analysis
This study uses a subset of 13,519 articles & reviews, published by researchers of a comprehensive and research-intensive university during 2009-2013, indexed in both WoS and SCOPUS databases. The subset was previously assigned to the department(s) (research unit(s) such as graduate school, research institute/center etc.), and disciplines using ESI 22 fields, OECD Frascati scheme and SCOPUS 27 subject area, and studied for the mutual relationships (Gautam 2015, 2016). It is newly analysed using KAKEN-L3 categories for university-level disciplinary profile, department level disciplinary profiles, and comparison with profiles obtained using other broader (such as ESI22, Scopus 27 and OECD Frascati) and newly derived
finer (WoS 251 and SCOPUS 333) disciplinary schemas. Document-level KAKEN-L3 schema and WoS 251 categories assignments and aggregation of bibliometric data involved the use of InCitesTM Benchmarking
module accessed on April 16, 2017. Document to article assignments for the SCOPUS SAC and ASJC categories used the Elsevier’s Scopus Source List (2016).
3. Results of Disciplinary Analysis
3.1. Frequency analysis for KAKEN-L3 schema
Simple frequency analysis of the 13,519 documents in terms of KAKEN- L3 schema for 44 categories, related to areas other than the social sciences, arts and humanities (in which the publications recorded in WoS and Scopus are too few), and yielding documents exceeding ca. 0.1% of the total are shown in Fig. 1.
Figure 1. Whole & fractional counting percent shares of publications by KAKEN-L3 category related to natural sciences, engineering and medicine, and the prolific categories with affinity of >5% documents by whole counting. Setting a threshold for prolific categories at 5% by whole counting, the dataset can be interpreted for category-wise strengths under 7 areas listed in the box (Fig. 1). Within the prolific groups, the order of publication volume is generally preserved also in fractional counting mode, except that ‘Earth and Planetary Science’ becomes more prolific than the ‘Environmental Science’ in the 5th group. The percentage value for a
particular category obtained by whole counting is 3 times higher, in average, than that obtained by fractional counting, and thus it reflects only a partial affinity of the documents to that category. In contrast, the fractional counting may underestimate the actual contribution of certain categories.
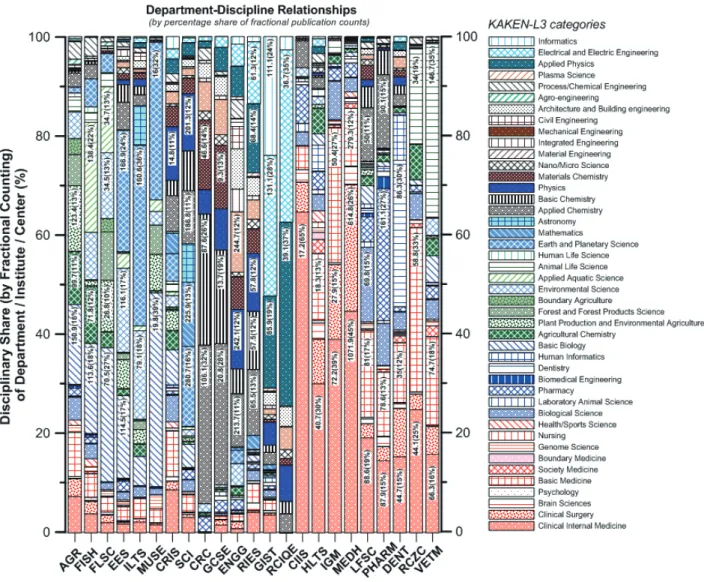
3.2. Department-discipline relationships and their visualization
The number of documents assigned to each KAKEN-L3 category was determined at the level of 23 departments producing at least 10 documents for further analysis. The percentage share of publications in each discipline was calculated for each department to obtain a contingency table of publication counts with row (disciplines) and column (departments) and analysed to reveal the following clusters.
Dpt 1: AGR (agriculture); FISH (fisheries); FLSC (field-based sciences)
Dpt 2: EES (environmental sciences); ILTS (low-T earth & environmental studies), MUSE (geo-biosciences) Dpt 3: CRIS (creative transdisciplinary sciences); SCI (natural sciences)
Dpt 4: CRC (catalytic chemistry); GCSE (chemical sciences & engineering); ENGG (engineering); RIES (electronic science)
Dpt 5: GIST (information science & technology); RCIQE (quantum electronics)
Dpt 6: CIIS (isotope science); HLTS (health sciences); IGM (genetic medicine); MEDH (medicine); LFSC (life sciences); PHARM (pharmacology & pharmacy), DENT (dentistry)
Dpt 7: RCZC (zoonotic infections); VETM (veterinary medicine)
Identical hierarchical clustering for the KAKEN-L3 categories as variables identified 7 clusters that were used with Dpt 1-7 to determine the relative positions of the variables (departments and disciplines) in the stacked bar diagram for better visualization of their relationships (Fig. 2).
3.3. Comparative analysis of disciplinary assignments by various schemas at department level
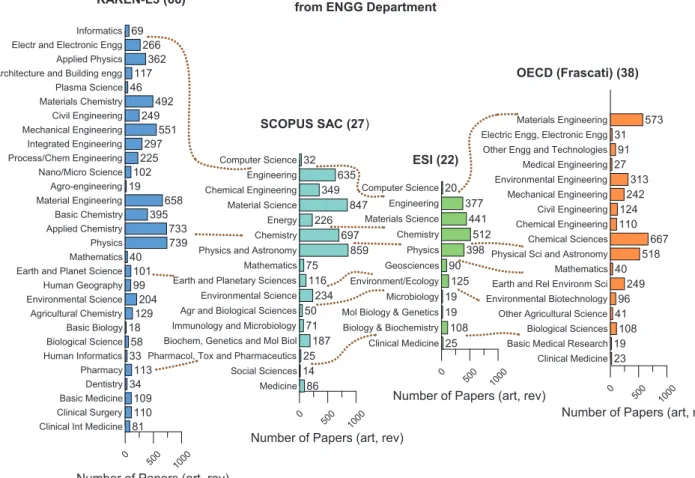
Different disciplinary profiles have been compiled for ENGG department as one of the largest document producers and promoters of cross-disciplinary research (Fig. 3). Four different disciplinary profiles and simple disciplinary correlations using whole counts are considered.
Due to the differences in the assignment modes (e.g., single discipline based on journal for ESI 22 but multiple disciplines for the others), varying numbers of disciplines (22 to 66) and therefore the scale of aggregation represented by each of them dependent of the schema, and the subjective nature of assignments and differing definitions of the disciplines even with identical names, straightforward comparison of the profiles is difficult. Nevertheless, joint considerations of these results from various schemas, even the visual assessment, provide insights on the overall nature of research at the level of different entities.
0 500 1000 Number of Papers (art, rev) Clinical Int Medicine
Clinical Surgery Basic Medicine Dentistry Pharmacy Human Informatics Biological Science Basic Biology Agricultural Chemistry Environmental Science Human Geography Earth and Planet Science Mathematics Physics Applied Chemistry Basic Chemistry Materials Chemistry Plasma Science Nano/Micro Science Material Engineering Agro-engineering Process/Chem Engineering Integrated Engineering Mechanical Engineering Civil Engineering Architecture and Building engg Applied Physics Electr and Electronic Engg Informatics 81110 109 34113 3358 18129 204 99 101 40 739 733 395 492 46 102 658 19 225297 551 249 117362 266 69 0 500 1000 Number of Papers (art, rev)
Medicine Social Sciences Pharmacol, Tox and Pharmaceutics Biochem, Genetics and Mol Biol Immunology and Microbiology Agr and Biological Sciences Environmental Science Earth and Planetary Sciences Mathematics Physics and Astronomy Chemistry Energy Material Science Chemical Engineering Engineering Computer Science 86 14 25 187 71 50234 116 75 859 697 226 847 349635 32 0 500 1000 Number of Papers (art, rev) Clinical Medicine
Biology & Biochemistry Mol Biology & Genetics Microbiology Environment/Ecology Geosciences Physics Chemistry Materials Science Engineering Computer Science 25 108 19 19125 90 398 512 441 377 20 0 500 1000 Number of Papers (art, rev) Clinical Medicine
Basic Medical Research Biological Sciences Other Agricultural Science Environmental Biotechnology Earth and Rel Environm Sci Mathematics Physical Sci and Astronomy Chemical Sciences Chemical Engineering Materials Engineering Civil Engineering Mechanical Engineering Environmental Engineering Medical Engineering Other Engg and Technologies Electric Engg, Electronic Engg
23 19108 4196 249 40 518 667 110 573 124242 313 2791 31 KAKEN-L3 (66) SCOPUS SAC (27) ESI (22) OECD (Frascati) (38) Distribution of Publications
from ENGG Department
Figure 3. Compilation of four different disciplinary profiles for the same department (ENGG) using the number of documents (in brackets) obtained by whole counting method. The disciplines (fields/subject areas or categories) shown have a minimum of 0.1% of the total (13,519) documents. The dotted lines separate broadly similar sectors comprising several disciplines in each scheme.
Mathematics is the discipline with exactly the same name in all 4 schemas (Fig. 4). It is absent in the ESI schema that assigns “only one discipline to one document based on journal” implying that ENGG researchers do not submit articles to purely mathematical journals. In contrast, the number of documents for mathematics in OECD (Frascati) and KAKEN-L3 is same (40), while it is nearly double (75) in the SCOPUS 27 schema owing to multiple disciplinary assignments such that documents related to mathematical theme as a part of cross-disciplinary research are captured by these schemas. Concerning categories related to materials science, ESI has the lowest number (441), OECD (Frascati) has 573 (in the Material Engineering category) but higher numbers characterize SCOPUS 27 (847) and KAKEN-L3 (658 in Material Chemistry, 492 in Material Engineering) schemas. Physics, chemistry and many engineering disciplines are comparatively more differentiated (e.g., into basic, applied etc.) in KAKEN-L3. When viewed several categories together,
KAKEN-L3 assignments are higher than in OECD (Frascati), SCOPUS, and ESI schemas. An anomalous feature seems to be the presence of clearly high number of documents in medical and health sciences categories (e.g., Clinical Internal Medicine, Clinical Surgery, Basic Medicine, Pharmacy) in KAKEN-L3 than in other schemas.
Although the number of documents in each disciplinary category seems logical, the number of disciplines/categories assigned to each document is very high. This is true for both the university and department as well. This reasoning is related to the average values, but in reality, several fields are more prolific than others, and their behavior may have unexpected effect on the whole dataset.
A strong feature of the KAKEN-L3 schema seems to be its ability to detect the presence of clearly defined applied fields such as applied physics, applied chemistry, applied aquatic science that are very useful in understanding their links to the departments particularly in the case of the university considered.
3.4. Comparative analysis using several schemes
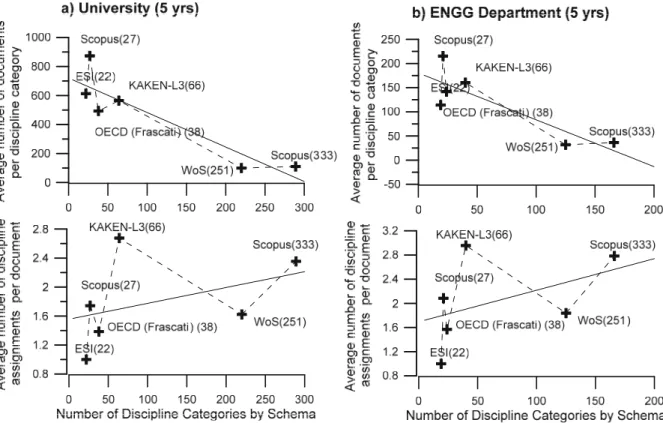
The present subset of documents has been tested for additional disciplinary profiles analysis using two popular finer-scale schemas: WoS 251 and SCOPUS 333. The scale (the number of disciplines and scope of each of them) and definition (subjective nature) mentioned earlier becomes more pronounced while comparing the results from 6 different schemes. Any comparative assessment spanning across these schemas is going to be largely descriptive justified only if such analysis has immediate practical relevance. At this point, therefore, only a general analysis based on the results for the university and a single department, i.e. ENGG is presented in Fig. 4.
Figure 4. Comparison of six different disciplinary schemas for the differences in the disciplinary assignments at university (left) and the ENGG department (right) levels. The vertical axes are the average number of discipline assignments per document (lower plots) and the average number of documents per discipline category (upper plots). The position of the schema along the horizontal axes is determined by the number of actual categories assigned to the university (left plots) and ENGG department (right plots). The solid lines are the linear fits showing the average tendencies obtained by line-fitting. The large deviation from the average tendency towards the higher number of disciplinary assignments per document in the KAKEN-L3 schema is noteworthy.
4. Concluding Remarks
Addition of functionality of the KAKEN-L3 schema for discipline-level bibliometric analysis in the InCitesTM (formerly owned by Thomson Reuters but now by Clarivate Analytics) analytical tool is an
important milestone. Because of the long history of usage of the Grants-in-Aid fields for screening the research grant proposals and building the research themes and large scale projects, whose contributions serve as the foundation for creating new research units (such as laboratories, research centers and cross-disciplinary departments), the research output of various research entities at the Japanese universities and institutions can naturally be better measured and interpreted with the KAKEN-L3 schema, and this study actually explored just that with real data. The new schema is capable to better differentiate the applied sciences from the fundamental ones and their relationship with the departments. However, the possibility of overestimation of the research volume based on the whole counting compared to the other schemas at the level of research entity involving a lower degree of aggregation across disciplines should be taken into account. Likewise, owing to the comparatively large average number of disciplinary categories per document, the possibility of false positives (i.e., disciplinary assignments not related to the actual content of the scientific publication) are possible but the extent to which this applies needs further investigation (Bartol et al., 2016; Glänzel, W. & Schubert, 2003). Finally, it is hoped that the NII and Clarivate AnalyticsTM will
consider revisions and further expansion of the existing KAKEN schema to align it with the FY2018 reform of the KAKENHI screening system that envisages 11 broad sections, 64 medium-sized sections, and 300+ basic sections (see: http://www.jsps.go.jp/j-grantsinaid/03_keikaku/data/h30/review_section_table.pdf).
References
Bartol, T., Budimir, G., Juznic, P. et al. (2016). Mapping and classification of agriculture in Web of Science: other subject categories and research fields may benefit. Scientometrics 109(2), 979–996. DOI: 10.1007/s11192-016-2071-6
Elsevier’s Scopus Source List. Retrieved December 11, 2016 from: https://www.elsevier.com/solutions/scopus/content
Gautam, P. (2015). Deciphering the Department-Discipline Relationships within a University through Bibliometric Analysis of Publications Aided with Multivariate Techniques. 2015 IIAI 4th International
Congress on Advanced Applied Informatics, Okayama, Japan, 468-471. DOI:10.1109/IIAI-AAI.2015.212
Gautam, P. (2016). Comparative analysis of scientific publications of research entities using multiple disciplinary classifications. Proceedings of the 2016 IIAI 5th International Congress on Advanced
Applied Informatics, Kumamoto, Japan, 524-528. DOI:10.1109/IIAI-AAI.2016.117
Glänzel, W. & Schubert, A. (2003). A new classification scheme of science fields and subfields designed for scientometric evaluation purposes. Scientometrics 56(3), 357-367. DOI:10.1023/A:1022378804087 MEXT (2017). KAKENHI Grants in Aid for Scientific Research 2016. Retrieved April 21, 2017 from:
http://www.jsps.go.jp/english/e-grants/data/kakenhi_pamph_e.pdf
Web of Science database. Retrieved April 16, 2017 from: http://apps.webofknowledge.com/