O R I G I N A L A R T I C L E – T R A N S L A T I O N A L R E S E A R C H A N D B I O M A R K E R S
TGFBI Expression in Cancer Stromal Cells is Associated with Poor Prognosis and Hematogenous Recurrence in Esophageal Squamous Cell Carcinoma
Daigo Ozawa, MD1, Takehiko Yokobori, MD, PhD1, Makoto Sohda, MD, PhD1, Makoto Sakai, MD, PhD1, Keigo Hara, MD1, Hiroaki Honjo, MD1, Hiroyuki Kato, MD, FACS2, Tatsuya Miyazaki, MD, FACS1, and Hiroyuki Kuwano, MD, FACS1
1Department of General Surgical Science, Graduate School of Medicine, Gunma University, Maebashi, Gunma, Japan;
2First Department of Surgery, Dokkyo Medical University, Mibu, Japan
ABSTRACT
Background. Esophageal squamous cell carcinoma (ESCC) is an important cause of cancer-related death worldwide. To improve prognoses in patients with ESCC, we evaluated the potential of transforming growth factor- beta-induced protein (TGFBI), which is overexpressed in ESCC, as a therapeutic candidate.
Methods. We examined the clinical significance ofTBFBI in 102 ESCC samples using real-time RT-PCR. Immuno- histochemical studies were conducted to examine the localization of TGFBI. Knockdown of TGFBI in cocul- tured fibroblasts was performed to determine the roles of TGFBIin migration and invasion.
Results. The level of TGFBIin ESCC tissues was higher than that in normal tissues. The high TGFBI expression group (n =16) had higher TGFB1 expression and more frequent hematogenous recurrence than the low-expression group (n=86). HighTGFBI expression was an indepen- dent prognostic factor in patients with ESCC. TGFBI was mainly localized in stromal cells of ESCC. Moreover, suppression ofTGFBIin fibroblasts inhibited the migration and invasion capacity of TE8 ESCC cells.
Conclusions. High TGFBI expression in ESCC tissues could be a powerful biomarker of poor prognosis and
hematogenous recurrence.TGFBIin stromal cells might be a promising molecular target for ESCC treatment.
Esophageal cancer is a common cancer worldwide, and is associated with a very poor prognosis.1,2In particular, esophageal squamous cell carcinoma (ESCC) is the most prevalent type of esophageal cancer, particularly in Asia.
Clinical indicators that predict progression and prognosis in ESCC are essential for improving patient survival. In a previous study, we found that expression of transforming growth factor-beta-induced protein (TGFBI) was higher in ESCC than in normal tissues, suggesting thatTGFBI may be a potential prognostic marker for ESCC.3
TGFBI is a secreted 683-amino acid extracellular matrix (ECM) protein with four evolutionarily conserved fasciclin-1 domains and a C-terminal Arg-Gly-Asp motif.4 TGFBI is induced by transforming growth factor-beta (TGF-b) in various human cell types.5,6 Moreover, TGFBI plays an important role in a wide range of cellular conditions, including tumorigenesis, corneal dystrophy, and diabetes.7–10 In tumor cells isolated from various types of cancers, TGFBI functions as a tumor suppressor, and hyperme- thylation ofTGFBIhas been observed in tumor cells.11–15 Moreover, TGFBI expression in the ECM has been shown to induce better responses to paclitaxel via microtubule stabilization in ovarian cancer cells.16 Additionally, in the ECM, TGFBI has been shown to facilitate cancer metastasis via promoting extravasation of colon cancer cells.17In renal clear cell carcinoma, TGFBI expression is a promising prognostic marker.18 Therefore, TGFBI has different functions in cancer progression, acting as an oncogenic protein or tumor suppressor, depending on the cell context.
Electronic supplementary material The online version of this article (doi:10.1245/s10434-014-4259-4) contains supplementary material, which is available to authorized users.
ÓSociety of Surgical Oncology 2014 First Received: 13 October 2014 D. Ozawa, MD
e-mail: [email protected] DOI 10.1245/s10434-014-4259-4
The purpose of this study was to clarify the function and clinical significance of TGFBI in ESCC. To this end, we used real-time RT-PCR to evaluate the relationships betweenTGFBIexpression and clinicopathological factors in clinical ESCC samples. Moreover, we examined whe- ther in vitro siRNA-mediated TGFBI suppression in KMST6 fibroblasts influenced the migration and invasion capacity in cocultured human TE8 ESCC cells.
MATERIALS AND METHODS
Patients and Tissues
Ninety men and 12 women diagnosed with ESCC were included in the study. Cancerous and corresponding normal esophageal tissues were obtained from the patients who had undergone curative surgery at the Department of General Surgical Science, Gunma University, between 1997 and 2009 (Table1). Tissue samples were immedi- ately frozen in liquid nitrogen and stored at-80°C until RNA isolation. These samples were used after obtaining written informed consent in accordance with institutional guidelines and the Declaration of Helsinki.
Pretreatment clinical tumor stage was classified using the seventh edition of the International Union Against Cancer (UICC) TNM classification. The mean postoperative follow- up period for the 102 patients was 37.3 (range 0.7–126.4) months. None of the patients had received irradiation or chemotherapy before surgery, and none had presented with hematogenic metastases at the time of surgery. Postoperative recurrence was diagnosed by diagnostic imaging [computed tomography (CT), fludeoxyglucose-positron emission tomography/CT, endoscopy], pathological diagnosis, and/or clinical progress.
RNA Isolation and Quantitative RT-PCR
Total RNA was extracted using a miRNeasy mini kit (Qiagen, Venlo, Netherlands). RNA was quantified using a Nanodrop 1000 (Thermo Scientific, Wilmington, DE, USA). Each cDNA was synthesized from 10 ng of total RNA using an Omniscript RT kit (Qiagen) according to the manufacturer’s protocol. For TGFBI and TGFB1 mRNA evaluation, quantitative real-time RT-PCR was performed from 10 ng total RNA from each of 108 ESCC patients by using the GoTaqÒ 1-Step RT-qPCR System (Promega, Madison, WI) according to the manufacturer’s protocols.
The mRNA levels of these target genes were then quanti- fied using a LightCycler 480 instrument (Roche Applied Science) with specific TGFBI primers (forward, 50-GTGT GTGCTGTGCAGAAGGT-30 and reverse, 50-TTGAGAG
TGGTAGGGCTGCT-30) and TGFB1 primers (forward, 50-CAGCAACAATTCCTGGCGATA-30and reverse, 50-A AGGCGAAAGCCCTCAATTT-30). The expression levels were normalized to those ofb-actin, amplified using spe- cific primers (forward, 50-CTCCTCCTGAGCGCAAGTA CTC-30and reverse, 50-TCCTGCTTGCTGATCCACATC-30).
TABLE 1 TGFBIexpression and clinicopathological factors in 102 ESCC patients
Factors TGFBI/p-actin
Low expression High expression
n=86 n=16 Pvalue
Age (year) 64.6?7.9 63.4?5.7 0.59
Gender
Male 75 15 0.69
Female 11 1
T factor
T1, 2 30 6 1
T3, 4 56 10
N factor
Absent 30 4 0.57
Present 56 12
M factor
Absent 69 14 0.73
Present 17 2
Lymphatic invasion
Absent 8 1 1
Present 78 15
Venous invasion
Absent 16 5 0.31
Present 70 11
Stage
I 12 2 0.83
II 27 6
III 28 6
IV 19 2
TGF-ftt expression
Low 49 2 0.0019*
High 37 14
Recurrence
Absent 59 8 0.16
Present 27 8
Recurrence of lymph node metastasis (f)
Absent 71 11 0.3
Present 15 5
Recurrence of hematogenous metastasis (f)
Absent 75 10 0.025*
Present 11 6
*P\0.05, f site of first recurrence
Immunohistochemistry
Four-micron sections were cut from paraffin blocks of ESCC samples. Each section was mounted on a silane- coated glass slide, deparaffinized, and soaked for 30 min at room temperature in 0.3 % H2O2/methanol to block endogenous peroxidases. The sections were then heated in boiled water and Immunosaver (Nishin EM; Tokyo, Japan) at 98°C for 45 min. Nonspecific binding sites were blocked by incubation with Protein Block Serum-Free (DAKO, CA, USA) for 30 min. An anti-TGFBI specific antibody (Proteintech, Chicago, IL, USA) was applied at a dilution of 1:100 for 24 h at 4°C. The primary antibody was visualized using the Histofine Simple Stain MAX-PO (Multi) Kit (Nichirei, Tokyo, Japan) according to the instruction manual. The chromogen 3,30-diaminobenzidine tetrahydrochloride was applied as a 0.02 % solution con- taining 0.005 % H2O2in 50 mM ammonium acetate-citrate acid buffer. The sections were lightly counterstained with Mayer’s hematoxylin and mounted. Negative controls were established by omitting the primary antibody, and no detectable staining was evident.
Cell Lines
The cell lines Het1A, TE1, TE8, TE15, KYSE70, and KMST6 were obtained from the American Type Culture Collection (ATCC), the Cell Resource Center of Bio- chemical Research, Institute of Development, Aging and Cancer, Tohoku University, and JCRB cell bank. These cell lines were maintained in Roswell Park Memorial Institute (RPMI-1640) medium (Wako Pure Chemical Industries) containing 10 % fetal bovine serum (FBS) and antibiotics (100 U/mL penicillin and 100lg/mL streptomycin) and were cultured in a humidified 5 % CO2incubator at 37°C.
RNA Interference of TGFBI
For TGFBI silencing, SMARTpool siRNAs consisting of four pools of short-interfering RNA (siRNA) were purchased from Dharmacon (CO, USA). Lipofectamine RNAi MAX (Invitrogen, CA, USA) and TGFBI-specific siRNA were incubated in 6-well microtiter plates. After incubation, KMST-6 cells were seeded in the plates at 2.09105cells/well in a volume of 2 mL and incubated in a humidified atmosphere (37°C and 5 % CO2). Scrambled siRNA was used as a negative control. The cells were collected after 72 h for subsequent experiments.
Western Blot Analysis
Total protein was extracted from Het1A, TE1, TE8, TE15, KYSE70, and KMST6 cells using PROPREP protein
extraction solution (Intron Biotechnology, Inc.). Total pro- tein (10lg) was electrophoresed through Nu-PAGE 4–12 % Bis–Tris gels (Invitrogen) and then electrotransferred to PVDF membranes using an iBlot Gel Transfer Device. The membrane was blocked with 5 % skim milk, and anti-TGFBI polyclonal antibodies (1:1,000) were used for TGFBI protein detection (Proteintech). Anti-b-actin mouse monoclonal antibodies (clone AC-74; Sigma) diluted 1:1,000 served as a control. Bands were detected using ECL Prime Western Blotting Detection Reagents, and band intensities were cal- culated using an Image Quant LAS 4000.
Wound Healing Assay
TE8 (2.59106) and KMST-6 (19106) cells were plated using a coculture model. TE8 cells were seeded in 24-well plates, and KMST6 cells transfected with TGFBI siRNA were seeded in the upper chamber. After the growing TE8 cell layers had reached confluence, a wound was made by scratching a straight line using a pipette tip.
The cells were then washed twice and incubated with 10 % FBS containing RPMI. We subsequently evaluated the closure or filling in of the wound at 24 h after wounding using bright-field microscopy at 409magnification. All experiments were performed in quadruplicate.
Matrigel Invasion Assay
Invasion of TE8 cells was analyzed using Matrigel-coated invasion chambers (BD Biosciences, Japan). KMST6 cells were seeded in 24-well plates in RPMI containing 10 % FBS, and TE8 cells were seeded in serum free media in the Matrigel upper chamber. After incubation for 24 h, cham- bers were removed, washed with phosphate-buffered saline, and cleaned using cotton swab. The cells were then fixed in methanol and stained with Diff-Quik stain (Sysmex, Japan).
The membranes were cut and observed under 409magni- fication using bright-field microscopy.
Statistical Analysis
Statistically significant differences were analyzed with Student’sttest for continuous variables and the Chi square test for categorical variables. Survival curves were generated according to the Kaplan–Meier method. The differences between overall survival curves were examined using the log-rank test. Univariate and multivariate survival analyses were performed using Cox’s proportional hazards model.
Analysis of variance (ANOVA) was used to assess the sta- tistical significance of in vitro assays. A probability value of less than 0.05 was considered significant. All statistical analyses were performed using JMP5.0 software (SAS Institute Inc., Cary, NC, USA).
RESULTS
Expression of TGFBI in Clinical ESCC Samples
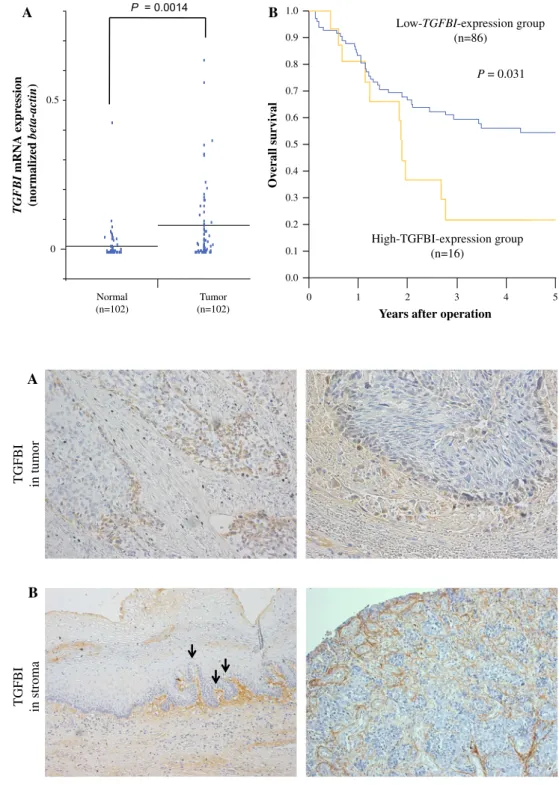
TGFBI expression was examined by quantitative RT- PCR in 102 curative resected ESCC tissues and corre- sponding normal tissues. The expression of TGFBI in tumor tissues was significantly higher than that of normal tissues (P =0.0014; Fig.1a).
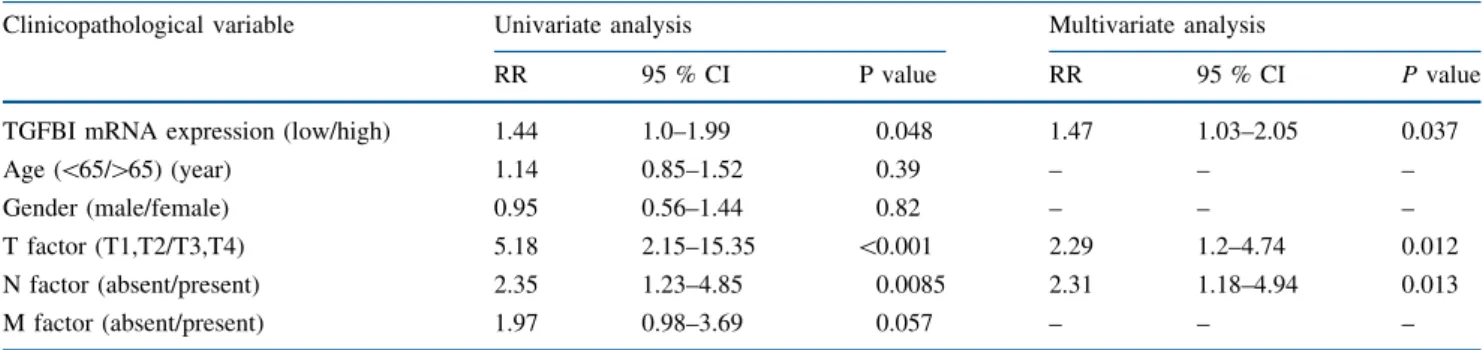
To investigate protein localization of TGFBI in ESCC tissues, immunohistochemical analysis was performed on 41 available clinical ESCC samples. Expression of TGFBI was localized to the cytoplasm in ESCC (Fig.2a). In five cases (12.2 %, 5/41), expression of TGFBI in marginal regions of primary ESCC was stronger than in the central regions of ESCC and normal tissues (Fig. 2a). However, most cases (87.8 %, 36/41) did not show TGFBI expres- sion in squamous epithelial cells, including ESCC cells,
B
A P = 0.0014
0 Normal
(n=102) 0
0.5
Tumor (n=102)
0.0 0.1 0.2 0.3 0.4 0.5 0.6 0.7 0.8 0.9 1.0
1 2
High-TGFBI-expression group (n=16)
Low-TGFBI-expression group (n=86)
P = 0.031
Years after operation
Overall survival
TGFBI mRNA expression (normalized beta-actin)
3 4 5
FIG. 1 Clinical significance of TGFBI mRNA expression in clinical ESCC samples.
aTGFBImRNA expression in tumor and normal tissues from ESCC patients by real-time RT- PCR (n=102).Horizontal linesindicate means (P=0.014).bKaplan–Meier overall survival curves of ESCC patients according to the level of TGFBImRNA. For the high TGFBIexpression group (n=16),TGFBIexpression in the tumor was 0.15 or higher.
For the lowTGFBIexpression group (n=86),TGFBI expression in the tumor was less than 0.15 (P=0.031)
TGFBI in tumor A
B
TGFBI in stroma FIG. 2 Representative
immunohistochemical staining of TGFBI in ESCC samples.
aTGFBI protein expression was stronger in the marginal region of ESCC than in the center region (original magnification:
left panel, 1009;right panel, 2009).bTGFBI protein expression was strong in the stroma and ECM of ESCC, and intratumoral neovascularity was observed (original
magnification; 1009).Black arrowsindicate intratumoral neovascularity
and TGFBI was mainly expressed in stromal cells and the ECM (Fig.2b). Therefore, we examined the correlation with TGFBI mRNA expression and TGFBI protein expression in cancer cells and stromal cells. We found that TGFBI mRNA expression in ESCC samples was not sig- nificantly associated with TGFBI protein expression in cancer cells of ESCC tissues (P=0.45). However,TGFBI mRNA expression in ESCC samples was significantly higher in ESCC samples with positive expression of TGFBI protein in stromal cells of ESCC tissues (P=0.038; Supplementary Fig. 1). On the other hand, TGFBI expression in stromal cells and the ECM was higher in stromal tissues of noncancerous squamous epi- thelium and ESCC with intratumoral vascularity than in stromal tissues without intra-tumoral vascularity (Fig.2b left panel; Supplementary Fig. 2).
Clinical Significance of TGFBI Expression in Patients with ESCC
Clinicopathological factors differed significantly in the high TGFBI expression group (n=16). There was more recurrence of hematogenous metastasis (P=0.025) than in the low TGFBI expression group (n =86; Table1).
TGF-b1 expression was positively correlated withTGFBI expression in this clinical ESCC sample set (P=0.0019;
Table1). With regard to overall survival (Fig.1b), patients in the highTGFBI expression group (n=16) had a sig- nificantly poorer prognoses than those in the lowTGFBI expression group (n =86;P=0.031).
Univariate analysis showed that T factor (P\0.001), N factor (P=0.0085), and TGFBI expression (P= 0.048) were significantly correlated with overall survival (Table2). The multivariate regression analysis revealed that inclusion in the TGFBI high-expression group [rela- tive risk (RR), 1.47; 95 % confidence interval (CI), 1.03–2.05; P=0.037] was an independent predictor, of overall survival (Table2).
Expression of TGFBI in Squamous Cell Lines and KMST6 Fibroblasts
Next, we evaluated TGFBI expression levels in Het1A, TE1, TE8, TE15, KYSE70, and KMST6 cells by Western blotting (Fig. 3a). TGFBI expression was detected in only KMST6 cells. Therefore, we used KMST6 cells to analyze whether TGFBI suppression in fibroblast cells influenced the migration and invasion capacities of human TE8 ESCC cells during coculture.
TGFBI Knockdown in KMST6 Cells Suppressed the Migration and Invasion Abilities of Cocultured TE8 Cells
To determine whether TGFBI expression in KMST6 cells regulated cell migration and invasion abilities in cocultured TE8 cells, we performed wound healing and invasion assays. TGFBI knockdown in KMST6 cells was validated by western blotting (Fig.3a). We found that the migration and invasion abilities of TE8 cells were sup- pressed by TGFBI-dependent regulation of cocultured fibroblasts (Fig.3b and c).
DISCUSSION
In this study, we clarified that the expression level of TGFBI in primary ESCC was higher than that in corre- sponding normal tissues, which was consistent with the results of a previous expression microarray study. We also showed that the high expression level of TGFBI was an independent prognostic factor in ESCC. Moreover,TGFBI knockdown in fibroblasts suppressed migration and inva- sion capacity in cocultured TE8 cells in vitro.
In this study,TGFBImRNA expression in ESCC samples was associated with hematogenous recurrence and poor prognosis. To elucidate which cells were responsible for the observed TGFBI mRNA expression, we examined the
TABLE 2 Results of univariate and multivariate analyses of clinicopathological factors affecting overall survival rates following surgery
Clinicopathological variable Univariate analysis Multivariate analysis
RR 95 % CI P value RR 95 % CI Pvalue
TGFBI mRNA expression (low/high) 1.44 1.0–1.99 0.048 1.47 1.03–2.05 0.037
Age (\65/[65) (year) 1.14 0.85–1.52 0.39 – – –
Gender (male/female) 0.95 0.56–1.44 0.82 – – –
T factor (T1,T2/T3,T4) 5.18 2.15–15.35 \0.001 2.29 1.2–4.74 0.012
N factor (absent/present) 2.35 1.23–4.85 0.0085 2.31 1.18–4.94 0.013
M factor (absent/present) 1.97 0.98–3.69 0.057 – – –
RRrelative risk,CIconfidence interval
relationship betweenTGFBImRNA expression and locali- zation of TGFBI in clinical ESCC samples. Our data suggested that TGFBI mRNA expression was derived from stromal cells of ESCC tissues (Supplementary Fig. 1).
Expression of the ECM-secreted protein TGFBI has been shown to be induced by TGF-b, and the expression of this protein in cancer cells can be upregulated in response to several treatments, including common chemotherapeutic agents, UV irradiation, heat shock, desferrioxamine, hydrogen peroxide, and gamma irradiation.19,20Moreover, cellular stress, including reactive oxygen species (ROS), induces the expression and secretion of TGF-b1 and TGF- b2, and abundant ROS in cancer cells and cancer-associated fibroblasts promote tumor initiation, progression, and metastasis.21Therefore, the expression and localization of TGFBIin cancer cells and stromal cells may be regulated by cellular stress-induced TGF-bsignaling in ESCC tissues.22
Importantly, our data suggested that TGFBI may be a promising prognostic marker and new candidate for tar- geted therapy in ESCC. TGFBI has been shown to have dual functions as a tumor suppressor and tumor promoter.23 Interestingly, hypermethylation of the TGFBI promoter is induced by mutant hepatitis B virus, conferring noncan- cerous NIH3T3 cells with tumorigenic properties.24 Moreover, TGFBI administration to model mice induces antitumor and anti-angiogenic effects in the subcutaneous tumor grafts.25 On the other hand, suppression of mela- noma cell-secreted TGFBI proteins has been shown to reduce metastatic potential and prolong the survival time of mice bearing tumors derived from human melanoma cells;
therefore, ECM-localized TGFBI may be required for metastatic outgrowth.26 Moreover, high expression of cytoplasmic TGFBI in clear cell renal cell carcinoma is associated with cancer progression and poor prognosis.18 Het1A
Migration assay TE8
+ KMST-6 0 hr
24 hr
60 100
75 50 25 0
Invasion cell number/fields
40
% of wound disclosure
20
0
TE8 + KMST-6
TE8 + KMST-6 TE8
+ KMST6- control siRNA
TE8 + KMST6- control siRNA
TE8 + KMST-6 TGFBI siRNA P = 0.003 P = 0.005
TE8 + KMST-6 TGFBI siRNA
Invasion assay TE8
+ KMST-6 TE8
+ KMST6- control siRNA
TE8 + KMST6- TGFBI siRNA
TE8 + KMST6- TGFBI siRNA TE8
+ KMST6- control siRNA TGFBI
β-actin
TE1 TE8 TE15 KYSE70 KMST6
KMST6- control siRNA
KMST6- TGFBI siRNA
A
B C
FIG. 3 TGFBI suppression in KMST6 fibroblasts reduced migration and invasion abilities in cocultured TE8 cells.aExpression of TGFBI protein was detected in Het1A, TE1, TE8, TE15, KYSE70, and KMST6 cells by western blotting. TGFBI expression was suppressed in KMST6 cells transfected with TGFBI siRNA.b-actin was used as the loading control.b, cMigration assay and invasion assay. The
migration and invasion abilities of TE8 cells were suppressed by cocultured KMST6 cells transfected with TGFBI siRNA compared with that of control siRNA and parent KMST6 cells. The data represent the mean±SD (P=0.005 and P=0.003 vs. control siRNA and parental KMST6 cells, respectively)
Thus, TGFBI expression in cancer may be a powerful prognostic marker and a new therapeutic target in several tumor types, despite some data demonstrating that TGFBI acts as a tumor suppressor.
In this study, we found that most (90 %) ESCC samples and all ESCC cell lines did not express TGFBI. Moreover, TGFBImRNA was mainly derived from stromal cells and the ECM of ESCC tissues and was associated with hema- togenous recurrence in ESCC. Hematogenous metastasis is required to promote the metastatic cascade, including angiogenesis and extravasation; however, it is unclear whether the ECM-secreted TGFBI facilitates or suppresses angiogenesis.25,27,28 In our study, we found that TGFBI protein was expressed in stromal tissues of noncancerous squamous epithelium and ESCC with intratumoral vascu- larity. Additionally, TGFBI knockdown in fibroblasts reduced migration and invasive abilities in cocultured TE8 cells. From these observations, at least in ESCC, we expect that ECM-localized TGFBI may be a promising target for therapeutic intervention against ESCC-inducing stromal cells and for regulating the recurrence of distant metastases thorough inhibition of the anti-angiogenic effects and migration and invasion abilities of ESCC cells.
CONCLUSIONS
The expression ofTGFBIin cancer tissues correlated with poor prognosis and recurrence by hematogenous metastasis in ESCC patients. In addition, the invasion and migration abilities in ESCC cells were regulated through TGFBI in fibroblasts in vitro. Therefore, TGFBI expression could be a useful predictor for poor prognosis and recurrence in ESCC patients. Moreover, with respect to developing new molec- ular cancer therapies, TGFBI expression in cancer stromal cells may be a promising candidate to regulate recurrence of distant metastasis in ESCC.
ACKNOWLEDGMENT The authors thank Ms. Yukie Saito, Ms.
Tomoko Yano, Ms. Yuka Matsui, Ms. Ayaka Ishida, and Ms. Ayaka Ishikubo for their assistance. This work was supported in part by Grants- in-Aid for Scientific Research from the Japan Society for the Promotion of Science (JSPS), Grant Numbers 21591690, 22591450, and 23591857.
REFERENCES
1. Ferlay J, Shin HR, Bray F, et al. Estimates of Worldwide Burden of Cancer in 2008: GLOBOCAN 2008.Int J Cancer.2010;127:2893–
917.
2. Parkin DM, Bray FI, Devesa SS. Cancer Burden in the Year 2000. The Global Picture.Eur J Cancer.2001;37 Suppl 8:S4–66.
3. Wong FH, Huang CY, Su LJ, et al. Combination of Microarray Profiling and Protein-Protein Interaction Databases Delineates the Minimal Discriminators as a Metastasis Network for Esophageal Squamous Cell Carcinoma.Int J Oncol. 2009;34:117–128.
4. Kawamoto T, Noshiro M, Shen M, et al. Structural and phylo- genetic analyses of RGD-CAP/Beta ig-h3, a Fasciclin-like adhesion protein expressed in chick chondrocytes.Biochim Bio- phys Acta. 1998;1395:288–92.
5. Schneider D, Kleeff J, Berberat PO, et al. Induction and Expression of Betaig-h3 in Pancreatic Cancer Cells. Biochim Biophys Acta. 2002;1588:1–6.
6. Nabokikh A, Ilhan A, Bilban M, et al. Reduced TGF-Beta1 expression and its target genes in human insulinomas.Exp Clin Endocrinol Diabetes. 2007;115:674–82.
7. Buckhaults P, Rago C, St Croix B, et al. Secreted and cell surface genes expressed in benign and malignant colorectal tumors.
Cancer Res. 2001;61:6996–7001.
8. Tomioka H, Morita K, Hasegawa S, Omura K. Gene Expression Analysis by cDNA Microarray in Oral Squamous Cell Carci- noma.J Oral Pathol Med.2006;35:206–11.
9. Fujiki K, Nakayasu K, Kanai A. Corneal Dystrophies in Japan.J Hum Genet.2001;46:431–5.
10. Han B, Luo H, Raelson J, et al. TGFBI (BetaIG-H3) is a diabetes- risk gene based on mouse and human genetic studies.Hum Mol Genet. 2014; 23:4597–611.
11. Li B, Wen G, Zhao Y, et al. The role of TGFBI in mesothelioma and breast cancer: association with tumor suppression. BMC Cancer.2012;12:239.
12. Wen G, Hong M, Li B, et al. Transforming growth factor-beta- induced protein (TGFBI) suppresses mesothelioma progression through the Akt/mTOR pathway.Int J Oncol. 2011;39:1001–9.
13. Kang S, Dong SM, Park NH. Frequent promoter hypermethyla- tion of TGFBI in epithelial ovarian cancer. Gynecol Oncol.
2010;118:58–63.
14. Shah JN, Shao G, Hei TK, Zhao Y. Methylation screening of the TGFBI promoter in human lung and prostate cancer by methyl- ation-specific PCR.BMC Cancer. 2008;8:284.
15. Caren H, Djos A, Nethander M, et al. Identification of epige- netically regulated genes that predict patient outcome in neuroblastoma.BMC Cancer. 2011;11:66.
16. Ahmed AA, Mills AD, Ibrahim AE, et al. The extracellular matrix protein TGFBI induces microtubule stabilization and sensitizes ovarian cancers to Paclitaxel.Cancer Cell. 2007;12:514–27.
17. Ma C, Rong Y, Radiloff DR, et al. Extracellular matrix protein Betaig-h3/TGFBI promotes metastasis of colon cancer by enhancing cell extravasation.Genes Dev. 2008;22:308–21.
18. Lebdai S, Verhoest G, Parikh H, et al. Identification and vali- dation of TGFBI as a promising prognosis marker of clear cell renal cell carcinoma. Urol Oncol. 2014. doi:10.1016/j.urolonc.
2014.06.005
19. Skonier J, Neubauer M, Madisen L, et al. cDNA cloning and sequence analysis of Beta ig-h3, a novel gene induced in a human adenocarcinoma cell line after treatment with transforming growth factor-Beta.DNA Cell Biol.1992;11:511–22.
20. Ivanov SV, Ivanova AV, Salnikow K, et al. Two novel VHL targets, TGFBI (BIGH3) and its transactivator KLF10, are up- regulated in renal clear cell carcinoma and other tumors.Biochem Biophys Res Commun.2008;370:536–40.
21. Montorfano I, Becerra A, Cerro R, et al. Oxidative stress medi- ates the conversion of endothelial cells into myofibroblasts via a TGF-Beta1 and TGF-Beta2-dependent pathway. Lab Invest 2014;94:1068–1082.
22. Costa A, Scholer-Dahirel A, Mechta-Grigoriou F. The role of reactive oxygen species and metabolism on cancer cells and their microenvironment.Sem Cancer Biol.2014;25:23–32.
23. Ween MP, Oehler MK, Ricciardelli C. Transforming growth factor-beta-induced protein (TGFBI)/(Betaig-H3): a matrix pro- tein with dual functions in ovarian cancer. Int J Mol Sci.
2012;13:10461–77.
24. Jiang SS, Huang SF, Huang MS, et al. Dysregulation of the TGFBI gene is involved in the oncogenic activity of the nonsense mutation of hepatitis B virus surface gene sW182*. Biochim Biophys Acta. 2014;1842:1080–7.
25. Son HN, Nam JO, Kim S, Kim IS. Multiple FAS1 domains and the RGD motif of TGFBI act cooperatively to bind alphavbeta3 integrin, leading to anti-angiogenic and anti-tumor effects. Bio- chim Biophys Acta. 2013;1833:2378–88.
26. Lauden L, Siewiera J, Boukouaci W, et al. TGF-beta-induced (TGFBI) protein in melanoma: a signature of high metastatic potential.J Invest Dermatol. 2014;134:1675–85.
27. Klein CA. Cancer. The metastasis cascade. Science. 2008;321:
1785–7.
28. Buga AM, Margaritescu C, Scholz CJ, et al. Transcriptomics of post-stroke angiogenesis in the aged brain.Front Again Neurosci.
2014;6:44.