On Labor Complementarity, Cultural Frictions and Strategic Immigration Policies
著者 Fujita Masahisa, Weber Shlomo
権利 Copyrights 日本貿易振興機構(ジェトロ)アジア
経済研究所 / Institute of Developing
Economies, Japan External Trade Organization (IDE‑JETRO) http://www.ide.go.jp
journal or
publication title
IDE Discussion Paper
volume 8
year 2004‑09‑01
URL http://hdl.handle.net/2344/198
INSTITUTE OF DEVELOPING ECONOMIES
Discussion Papers are preliminary materials circulated to stimulate discussions and critical comments
DISCUSSION PAPER No. 8
On Labor Complementarity, Cultural Frictions and Strategic Immigration Policies*
Masahisa Fujita† and Shlomo Weber‡
September 2004
Abstract
In this paper we consider a model with two industrialized countries that face a flow of
immigration from the “rest of the world.” The countries differ in three characteristics: the labor complementarity between the “native” population and immigrants, the population size, and the magnitude of the cultural friction between the natives and immigrants. We consider a
non-cooperative game between two countries’ when their strategic instrument is the choice of an immigration quota and the world immigrant wages introduce the spill-over effect between two countries. We first show that the quota game admits unique pure strategies Nash equilibrium.
We then compare the equilibrium choices of two countries and show that even though the larger country attracts more immigrants, it chooses lower quota than its smaller counterpart. It also turns out that higher degree of labor complementarity between natives and immigrants and a lower degree of cultural friction between two groups yield higher immigration quota. We also examine the welfare implications of countries choices’ and argue that coordinated and
harmonized immigration policies may improve the welfare of both countries.
Keywords: Intra-Country Heterogeneity, Labor Complementarity, Immigration Quota, Policy Harmonization.
JEL classification: C72, F22, O3, R1.
*We wish to thank Jacques Thisse for useful comments.
† Institute of Economic Research, Kyoto University, Kyoto, Japan, and Institute of Developing Economies, JETRO, Japan.
The Institute of Developing Economies (IDE) is a semigovernmental, nonpartisan, nonprofit research institute, founded in 1958. The Institute merged with the Japan External Trade Organization (JETRO) on July 1, 1998.
The Institute conducts basic and comprehensive studies on economic and related affairs in all developing countries and regions, including Asia, Middle East, Africa, Latin America, Oceania, and East Europe.
The views expressed in this publication are those of the author(s). Publication does not imply endorsement by the Institute of Developing Economies of any of the views expressed.
INSTITUTE OF DEVELOPING ECONOMIES (IDE), JETRO 3-2-2, WAKABA,MIHAMA-KU,CHIBA-SHI
CHIBA 261-8545, JAPAN
1 Introduction
In describing an array of industries across countries, one can immediately come to the conclusion that different production technologies impose distinct requirements on the level and distribution of labor skills and the way workers in those industries interact with each other. For example, over the years Japan has achieved a very high level of performance in the industries (cars, sophisticated consumer goods) that require a high level of precision and consistent quality control. These industries are characterized by a large number of production stages where technological progress is usually achieved through the series of small but incessant improvements, called “kaizen” (see, e.g., Imai (1989)). This type of production requires not only highly educated and able workers, but also a consistent and extensive level of interaction between them. These demands result in emergence of a labor force that is relatively homogeneous in its educational, cultural, and linguistic background.
On the other hand, the United States specialize in “knowledge”, and especially, software industries that rely on talents and abilities of individuals coming from a wide range of vastly different educational and cultural environments. The success of Silicon Valley in the late nineties is often attributed to the diverse backgrounds of scientists, engineers and entrepreneurs who arrived from all corners of the world, such as India, China, Taiwan, and Israel. In fact, Saxenian (1999) points out more than thirty percent of new businesses in Silicon Valley had an Asian-born co-founder.1 However, the diversity did not prevent, and, in fact, even reinforced the commonality of workers’ purpose and goals. Saxenian (1996) describes how workers in Silicon Valley enjoyed frequent and intensive exchange of information through variety of formal and informal contacts. The exchange was facilitated by frequent moves of workers from one firm to another (the average time spent by an individual in one firm was about two years), and flexible industry structure (it has been often claimed that in Silicon Valley “a firm is simply a vehicle allowing an individual to work.”)
The nature of knowledge production indicates the importance of interaction between different workers and, especially, complementarity of their talents and skills, that is quite different from the multi-stage technological process in high-precision manufacturing (see Milgrom and Roberts (1990)
1Historically, the openness to immigrants is a relatively new phenomena. Chinese immigration (forbidden in the U.S. in 1880) and Japanese immigration (forbidden in 1905) were considered incompatible with American cultural foundations and unwarranted from the economic point of view (Maignan et al (2003)).
and Kremer (1993)). In general, the labor complementarity is based on two sources, internal het- erogeneity, that describes the diversity of talents within the existing group of workers engaged in a given industry, and external heterogeneity, that captures the diversity between the existing group of workers and “newcomers” to the industry. The first type of heterogeneity has been the focus of the Grossman and Maggi (2000) two-country analysis, which introduced a model with a diverse talent pool within each country and examined, among other issues, an assignment of different individuals to complementary tasks, and its impact on trade patterns between two countries. Our goal is to examine an external labor complementarity between “native” population and immigrant workers in a given industry.
We consider citizens of two countries, A and B, and immigrants, denoted by I. Since our focus is on intra-country heterogeneity between A and B in terms of their labor complementarities with the immigrant population, we assume that each of the three groups, A, B, and I is homogeneous in nature and consists of identical individuals. Using the language of Esteban and Ray (1994) in their study of polarization, we focus on heterogeneity across three clusters of individuals and assume complete homogeneity within each of them.
In our model there are three parameters that represent the intra-country heterogeneity between countries A and B: (i) degree of labor complementarity between countries’ native population and immigrants; (ii) countries’ population size; (iii) the magnitude of cultural friction between natives and immigrants. The cultural friction may manifest itself in language barriers caused by a difficulty of learning a local language, natives’ bias towards to immigrants, distinct cultural, religious and behavioral attitudes exhibited by natives and immigrants. Different attitudes towards immigrants across various countries can be explained by the web of historical, cultural, linguistic, ethnic, religious, geographic, and economic reasons that are not examined here. We simply accept the fact that various countries exhibit different degrees of cultural friction between natives and immigrant population.
We consider a non-cooperative game between two countries that strategically choose their immi- gration quotas, where the spill-over effect is introduced through the world immigrant wages. Wefirst prove that for any set of parameters of our model there exists a unique pure strategies Nash equilib- rium. We further investigate the equilibrium immigration quotas and show that the country with a
higher labor complementarity and lower cultural friction admits a larger number of immigrants than its counterpart. It turns out that while the more populous country would attract a larger number of immigrants, its relative immigration quota would nevertheless be lower than in the smaller country.
We also examine the welfare implications of countries’ decisions and demonstrate that, in particu- lar, the country with higher labor complementarity and lower cultural friction attains higher level of welfare than the other country. Thus, the implementation of concrete measures for reducing the degree of cultural friction between natives and immigrant would be an important step in enhancing country’s welfare.
We also discuss a possible coordination and harmonization of immigration policies that may im- prove the welfare of both countries. Even though the coordinated reduction of immigration quotas may be beneficial for both countries, one should realize that this conclusion has been stated with respect to equilibrium levels of immigration. In terms of empirical implications, one can justifiably ar- gue that immigration quotas in industrialized countries are far away from the equilibrium levels, and, therefore, a raise of quotas, rather than their reduction, could be a prudent policy recommendation.
The paper is organized as follows. In the next section we introduce the model and provide examples that illuminate our assumptions. In Section 3 we describe the immigration game and state our result on the existence and uniqueness of Nash equilibrium. In Section 4 we compare the levels of the immigration quotas chosen by the countries in equilibrium and examine the welfare implications of their choices. Section 5 is devoted to discussion on harmonization of immigration policies aimed at the welfare improvement of two countries. Finally, we provide the concluding remarks. All the proofs of our results are relegated to the Appendix.
2 The Model
There are two “industrialized” countries, A and B, and unlimited source of immigration from the “rest of the world”. One of the main features of our model is that we allow for intra-country heterogeneity of levels of labor complementarity between native population (natives) and immigrants in two countries. Thus, two countries may face different effects of immigrants’ contribution towards its production capabilities. More specifically, the production function of country j = A, B is given
by
Qj = (Njαj +Ijαj)
1 αj,
whereNj is the country population of natives andIj is the number of immigrants to countryj. The parameter αj represents the reverse measure of labor complementarity between natives and immi- grants in j. We assume that 0 < αj < 1, and within this range, the smaller values of αj reflect a higher degree of labor complementarity.
To further comment on our choice of the range of αj’s, note that when αj ≤0, the complemen- tarity is so strong that the output Qj tends to zero when the number of immigrants Ij approaches zero. This would imply that the country is unable to survive without the influx of immigrants. In order to avoid this unrealistic situation, we rule out all non-positive values ofαj. On the other hand, when αj exceeds 1, the iso-quant curves of country j are strictly concave, so that the mix of natives and immigrants is actually harmful for production purposes. This may happen if the cultural gap between two populations is too wide to allow a successful integration of the heterogeneous population into production process. In the case when αj = 1, the mix of two populations has the neutral effect and has neither positive nor negative benefit in production. Summarizing all these arguments, our analysis is focused on interesting and meaningful case of 0<αj <1, where natives and immigrants posses a sufficient degree of diversity to enhance the productivity of the industry they engage in.
At the same time, the degree of diversity is sufficiently small to allow beneficial integration of two populations into the production process.
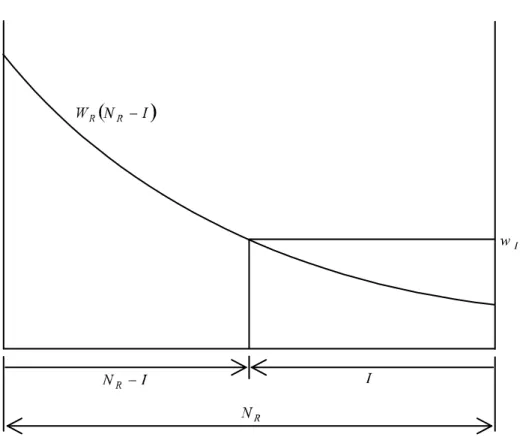
The real immigrant wage, wI, is the same in both countries. It is determined via supply function given by
wI =c+γI,
wherecandγare positive constants, andI =IA+IB is the total number of immigrants in countriesA andB. The fact that the world wages are increasing in the number of immigrantsI follows from the decreasing marginal productivity in the immigrants’ country of origin. Indeed, a larger immigration
flow to countriesA B leads to a smaller number of workers employed in the country of their origin,
and, consequently raises their world wagewI. (See Figure 1).
Insert Figure 1.
As we alluded above, in addition to their size and labor complementarity parameters, two countries differ in the magnitude of cultural friction between their native populations and immigrants. This type of the intra-country heterogeneity plays an important role in our analysis. In spite of the fact that the immigrant real wages are identical in both countries, the actual wages should take into account different cultural environments in two countries. Indeed, if the linguistic, cultural or religious obstacles faced by immigrants in countryB are substantially higher than in countryA, then the actual wages that are necessary to attract immigrants into countryB should be higher than those needed in country A. Formally, we introduce a degree of cultural friction in both countries, fA and fB, such that the actual wages to be paid to immigrants in country j =A, B are given by
wj =wI +fj. Then the welfare of country j =A, B is2
Wj =Qj −wjIj =Qj−wIIj−fjIj. The immigration quota of countryj =A, B, given by
xj = Ij
Nj
,
represents the ratio of immigrants and the native population. The production levels in two countries are determined by
QA=NA(1 +xαA)α1, QB =NB(1 +xβB)1β,
where, for simplicity of notation, the degrees of complementarity,αA and αB, are replaced by α and β, respectively. It is convenient to express the real immigrant wage and the country j’s welfare level
2Here we implicitly assume a circularflow of migration between country j and the rest of the world (called “tem- porary migration” (Wong (1995)), when immigrants do not stay inj for “too long”. Thus, the welfare of country j is that of its natives only. More generally, we may replace the termwIIj byθjwIIj, whereθj ∈[0,1] is a parameter reflecting the degree of integration of immigrants in country j’s society. θ = 1 corresponds to our model whereas other extreme caseθ= 0 represents the case of the complete integration of immigrants where their earnings are fully accounted in the country welfare.
in terms of immigration quotas:
wI =c+γ(NAxA+NBxB), and
Wj =Qj −wINjxj −fjNjxj.
To illustrate the features of our model, consider the following examples:
Example 2.1: Let country A be the United States and B Japan. Suppose that all immigrants are from China. Given the common cultural heritage of Buddhism and Confucianism, Japanese and Chinese have similar nature, and thus they are rather substitutable. Thus, the degree of labor complementarity of Chinese immigrants in Japan is relatively low. The situation is different in the U.S., where, after receiving an appropriate education, Chinese immigrants exhibit a relatively high degree of labor complementarity. Thus, the reverse degree of complementarity of “natives” and immigrants in the U.S.,α, is lower thanβ, the corresponding value in Japan.
As far as cultural friction is concerned, it is commonly recognized that the U.S. are more open to immigration than Japan. In addition, there are also linguistic and historical challenges for Chinese immigrants in Japan. Even though Chinese characters are used in both China and Japan, their pronunciation in two countries is completely different. More importantly, the Chinese language structure is very similar to that of English, while being quite distinct from Japanese. In addition, the lingering memories of painful historical events and relationship between the two countries, one may assume a higher degree of cultural friction faced by Chinese immigrants in Japan than in the U.S., implyingfA< fB.
Finally, since a larger population in the U.S. yields NA > NB. To summarize, this example satisfies the following relationship between the parameters of the model:
α <β, fA< fB, NA> NB. (1) Example 2.2: The relationship indicated by (1) can be derived from a slightly different story, where the degree of complementarity of two populations in production depends not only on their cul- tural heterogeneity but also on the industry they are employed. As in Example 2.1, let country
A be the United States and B Japan, but now suppose that all immigrants come from India.
One can assume that while Japan specializes in the production of high-quality manufacturing, the U.S. specialization lies in software development. Then the mix of heterogeneous popula- tions of Japanese and Indians may be rather harmful in refining the high-quality manufacturing through incessant “kaizen” in the production process. In contrast, mixing appropriately hetero- geneous populations of Americans and Indians generates higher complementarity in software development. Thus, thereversed degree of complementarity α in the U.S. would be lower than the corresponding valueβ in Japan. We may also assume that, in terms of cultural differences, Hindu is equally distant from Christianity and Buddhism. But, given the Indian colonial past, a large number of educated people in India speak English, so that the degree of cultural friction in the U.S. is lower than in Japan. Thus, inequalities (1) hold in this example as well.
As it is commonly known, the number of immigrants in the U.S. is larger than that in Japan. In Section 3 we shall re-examine the relationship described in (1) and demonstrate that our theoretical conclusions are consistent with the existing immigration gap between two countries.
In the next section we examine strategic interaction between two countries in determining their immigration. We then show the existence and uniqueness of a pure strategies Nash equilibrium in the non-cooperative quota game.
3 The Quota Game
To proceed with the formal framework, we consider a multidimensional parameter spaceP, where each pointpinP represents degrees of labor complementarity, population size, and cultural frictions in two countries. That is,
P ≡{p= (α,β, NA, NB, fA, fB)|0<α,β <1, NA, NB, fA, fB >0}.
Let vector p ∈ P, that describes the state of the “world economy”, be given. We consider a game Γ(p) between two countries, A and B, whose strategic choices are their relative immigration quotas, xA and xB, respectively. The payoff of countryj =A, B, is represented by its welfare level,
Wj(xA, xB), that depend on their production, immigrant wages, and the cultural friction between the native population and immigrants in countryj, i.e.,:
Wj(xA, xB) =Qj−wINjxj −fjNjxj.
Thus, we have the following expressions for countries’ payoffs in terms of immigration quotas:3 WA(xA, xB) =NA(1 +xαA)α1 −[c+γ(NAxA+NBxB)]NAxA−fANAxA, (2) WB(xA, xB) =NB(1 +xαB)α1 −[c+γ(NAxA+NBxB)]NBxB−fBNBxB. (3) Since the payoff functions of country A is continuously differentiable and concave in xA for any xB, we determine the best response of country A to the immigration quota xB of country B by solving the first order condition:
∂WA(xA, xB)
∂xA
= 0.
Similar equation holds for the best responses of country B:
∂WB(xA, xB)
∂xB
= 0.
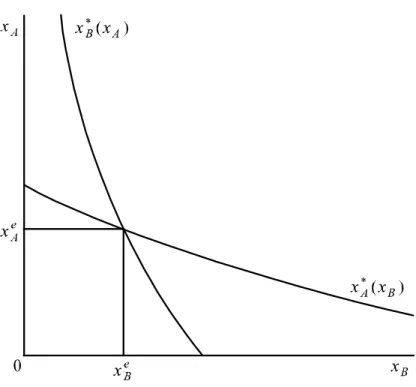
We will demonstrate that the solution of the first order conditions, x?A(xB) andx?B(xA), are well- defined, positive-valued, continuous, strictly decreasing in the other country’ choice, and approaches zero when the immigration quota of the other country tends to infinity (see Figure 2).
Insert Figure 2.
We obtain our first result:
Proposition 3.1: For every p ∈ P, the immigration game Γ(p) admits a pure strategies Nash equilibrium.
Our next result shows the uniqueness of Nash equilibrium:
3Since the welfare of each country is decreasing in immigration quota of the other, it follows that the immigration quotas are, in fact,strategic substitutes(Bulow, Geanakoplos and Klemperer (1985).
Proposition 3.2: For every p ∈ P, the immigration game Γ(p) admits the unique pure strategies Nash equilibrium, denoted by (xeA(p), xeB(p)). Moreover, in equilibrium, both countries choose strictly positive immigration quotas.
The proof of this proposition is relegated to the Appendix. We would like to point out that the reason for uniqueness of the equilibrium is based on the fact that the slope of the reaction curves, x?A(xB) and x?B(xA), on the xB and xA axes, respectively, is between 0 and −1.4 That is, a raise by
² of an immigration quota in country A would trigger a decline in immigration quota in B by the amount which is less than ² (see Figure 3).
Insert Figure 3.
Thus, two reaction curves do not intersect more than once, which, together with Proposition 3.1, guarantees the uniqueness of an equilibrium.
In the next section we examine how differences in population size, degree of complementarity and cultural friction impact the variance in the equilibrium immigration quotas and welfare levels in two countries.
4 Cross-Country Comparison of Immigration Quotas and Welfare
Before proceeding with the examination of quotas and welfare, it would be useful to introduce the function g : (0,1)× <++ →<, where
g(δ, x)≡(1 +xδ)1δ−1xδ−1 = (1 +x−δ)1−δδ. for every δ∈(0,1) andx >0. It is easy to see that
g(α, xA) = 1 NA
∂QA
∂xA
and
g(β, xB) = 1 NB
∂QB
∂xB
.
4A similar argument is often used in the study of uniqueness of a Cournot equilibrium, see Tirole (1988), Chapter 5.
That is, the value of the function g(δ, x) for δ = α, x = xA and δ = β, x = xBx represents the per capita marginal product induced by changing an immigration quota in countries A and B, respectively.
The following lemma summarizes some properties of the function g that will be utilized to prove our results. Assertion (i) states that the marginal product declines in the number of immigrants. (ii) implies, however, that the rate of decline is not “very steep.” Assertion (iii)) states that the marginal product is positively correlated with the value of labor complementarity. (iv) and (v) describe the limit value of marginal product at corner points, zero and infinity. Formally,
Lemma A: (i) For every δ ∈(0,1), the functiong(δ,·) is decreasing on<++ . (ii) For every δ∈(0,1), the functiong(δ, x)·x is increasing in x on<++ . (iii) For every positive x, the functiong(·, x) is decreasing on (0,1).
(iv) For everyδ ∈(0,1), limx→0g(δ, x) = +∞. (v) For everyδ ∈(0,1), limx→+∞g(δ, x) = 1.
Note that the introduction of the functiongallows us to rewrite thefirst order conditions presented in the last section in a more convenient form:
g(α, xA)−γNAxA =c+γ(NAxA+NBxB) +fA=wI+fA=wj (4) g(β, xB)−γNBxB =c+γ(NAxA+NBxB) +fB =wI+fB =wB. (5) That is, the difference between the per capita marginal product and the weighted number of immi- grants is equal to the actual immigrant wages paid in the country.
Now let us turn to the comparison of the equilibrium immigration quotas. In thefirst proposition we examine the countries with the same population and consider two cases. One is where two countries have an identical degree of labor complementarity but differ with respect to the magnitude of the friction between natives and immigrants. The second case deals with two countries that are distinguished only on the basis of the labor complementarity between the native and immigrant population.
Proposition 4.1: Letp= (α,β, NA, NB, fA, fB)∈P, where NA=NB, be given.
(i) Let fA=fB,but α<β, i.e., the degree labor complementarity in country A is higher than
in country B. (Recall that α and β are the reverse measures of complementarity in countries A and B, respectively.) Then xeA(p)> xeB(p).
(ii) Let α = β, but fA < fB, i.e., country A exhibits a lower degree of cultural friction than countryB. Then country A would accept more immigrants, i.e., xeA(p)> xeB(p).
The intuition here is quite clear. If the countries are distinguished only on the basis of labor complementarity, they both pay identical wages to immigrants. However, since the marginal produc- tivity is higher in the country with higher degree of labor complementarity, assertion (i) states that country A would choose a higher immigration quota than country B. In the case where countries differ with respect to the degree of cultural friction, the gross wages paid to immigrants are lower in A. Since the marginal productivity is declining, it follows that the countryA should accept a larger number of immigrants.
If the population of two countries is the same, there is no need, as in Proposition 4.1, to distin- guish between the relative and absolute number of immigrants in A and B. For the countries with heterogeneous population sizes, the distinction between absolute and relative number of immigrants is essential. In Proposition 4.2, we consider two countries with identical degrees of labor complemen- tarity and cultural friction, but different population sizes. We will compare both the immigration quotas (the relative number of immigrants with respect to the native population) and (absolute) the number of immigrants in two countries:
Proposition 4.2: Let p = (α,β, NA, NB, fA, fB) ∈ P, where α = β, NA > NB, fA = fB, be given.
Then
(i) The immigration quota is lower in the more populous countryA, i.e., xeA(p)< xeB(p).
(ii) However, the larger country would accept a larger number of immigrants, i.e.,IA > IB, or NAxeA(p)> NBxeB(p).
Indeed, consider countryA. Under identical degree of labor complementarity in two countries, the higher population size and declining marginal product imply, according to (4) and (5), that country A will have a lower immigration quota. In the same time, a lower immigration quota in A yields a higher value of the per capita marginal productivity in that country. Since the difference between
the per capita marginal product and the weighted number of immigrants is equal in both countries, it immediately implies that the number of immigrants into A is larger than into B.
The next corollary examines the aggregate effect of differences in population size, degree of com- plementarity and cultural friction. We consider the case where, as in Examples 2.1 and 2.2, country Ais more populous, has higher degree of labor complementarity and lower degree of cultural friction than country B. Then the number of immigrants to country A exceeds the number of immigrants to country B, which is consistent with the fact that the number of immigrants in the U.S. is larger than in Japan.
Corollary 4.3: Letp∈P be such that α<β,fA< fB and NA> NB. Then IA> IB.
Now let us turn to the welfare comparison between the countries that are distinct in their labor complementarity, population size and degree of cultural friction. Consider a pointp∈P. The welfare levels of two countries in the equilibrium of the gameΓ(p),WA(xeA(p), xeB(p)) and WB(xeA(p), xeB(p)), will be denoted simply by WAe(p) and WBe(p), respectively.
Proposition 4.4: (i) Assume that p = (α,β, NA, NB, fA, fB) ∈ P is such that α < β, NA = NB, and fA=fB. Then the country with higher degree of complementarity attains higher level of welfare, i.e.,WAe(p)> WBe(p).
(ii) Let p ∈P be such that α =β, NA > NB, and fA =fB. That is, the countries differ only with respect to their population size. Then the more populous country is better off relatively to its smaller counterpart: WAe(p)> WBe(p).
(iii) Assume that p ∈ P is such that α = β, NA = NB but fA < fB. Then the country with lower cultural friction attains higher level of welfare, i.e, WAe(p)> WBe(p).
Proposition 4.4 allows us to examine some possible policy implications on the results stated here.
Among three parameters, labor complementarity, the size of native population, and the degree of cultural friction between natives and immigrants, it seems that thefirst two parameters are unlikely to be altered in short or medium run. However, the last aspect, that of cultural friction, should be
become a subject of active public policy debate and action. Indeed, in order to enhance the national welfare, it is important to undertake concrete measures aimed at reducing the value of cultural frictions between natives and immigrants.
5 Harmonization of Immigration Policies
In this section we address the question of whether coordinated and harmonized immigration policies of countries A and B may improve their welfare. We consider the first best outcome when countries jointly choose their immigration quotas. It turns out that the equilibrium immigration levels yield an excessive number of immigrants. This result clearly calls for a need for coordinated immigration policies that might be beneficial for both countries. To reinforce this point, we show that a harmonized reduction of equilibrium immigration levels, both in relative and absolute terms, would raise the welfare in both countries.
For every point pin the parameter space P, we consider the cooperative outcome (xcA(p), xcB(p)) that maximizes the joint welfare of two countries. That is, for a givenp∈P, the countries attempt tofind:
max
(xA,xB)∈<2++
{WA(xA, xB) +WB(xA, xB)}.
The first result of this section states that, regardless of degree of heterogeneity in size, cultural friction and labor complementarity between natives and immigrants, the total number of immigrants into two countries in equilibrium is always “excessive.”
Proposition 5.1: For every point p ∈ P the total number of immigrants in the non-cooperative equilibrium is larger than under joint welfare maximization:
NAxcA(p) +NBxcB(p)< NAxeA(p) +NBxeB(p).
It is important to point out that Proposition 5.1 does not imply that the equilibrium immigration quota is excessive for each country. It claims only that that the total number of immigrants in two countries is excessive. Indeed, it is possible that if the countries possess sharply distinct character- istics, one of the countries should raise its immigration quota under cooperative outcome. It is not
the case for two countries with similar characteristics,5 where the immigration quota of each country is excessive with respect to the cooperative solution:
Proposition 5.2: Let point p = (α,α, N, N, f, f) ∈ P represent two countries with identical char- acteristics. Then there exists a positive number ² such that for every point p0 ∈ P, satisfying kp−p0k< ², the inequalityxcj(p0)< xej(p0) holds for every j =A, B.
We complete this section by analyzing how the countries can increase their welfare by implement- ing harmonized immigration policies. We consider two approaches, harmonized relative reduction and harmonized absolute reduction. Under thefirst policy, both countries reduce their immigration levels by the same percentage point. Alternatively, they may agree on the same number of immigrants eliminated from their respective equilibrium quotas.
Proposition 5.3: Let pointp∈P be given.
(i) - Relative Reduction. There is a numberλ,0<λ<1 such that for allλ0 ∈(λ,1):
WA(λ0xeA(p),λ0xeB(p))> WAe(p), and WB(λ0xeA(p),λ0xeB(p))> WBe(p).
(ii) - Absolute Reduction. There is µ >0 such that for allµ0 ∈(0, µ):
WA(xeA(p)−µ0, xeB(p)−µ0)> WAe(p), and WB(xeA(p)−µ0, xeB(p)−µ0)> WBe(p).
6 Concluding Remarks
In this paper we consider a model with two industrialized countries and a homogeneous mass of immigrants. The countries’ characteristics may vary with respect to their population size, degree of cultural friction toward immigrants, and labor complementarity between native population and immigrants. The latter is an outcome of distinctive production processes in two countries: one (e.g., software industry) is rooted in a heterogeneous labor force with a wide range of cultural, ethnic and
5In general, in symmetric games, where strategies are strategic complements, each player chooses a larger value of her strategic variable than that compatible with the joint welfare maximization.
educational backgrounds, and the other (e.g., high-precision manufacturing) is based on homogeneity and a high degree of interaction between workers.
We consider a non-cooperative game between two countries where each of them makes a strategic decision by choosing its immigration quota. We first show that our game admits a unique pure strategies Nash equilibrium and then study the welfare implications of countries’ choices. It turns out that a country with a higher degree of production basis and a higher level of tolerance towards immigrants would allow a larger immigration quota. In addition, we show that while a more populous country allows more immigrants, it would establish a lower ratio between immigrants and natives.
We also argue that both countries can benefit by coordinating their strategies, and our results call for harmonized immigration policies aimed at improving the welfare of both countries.
To focus our analysis on difference in labor complementarity between the native population in countries A and B, we assumed a complete homogeneity within each of the three groups, natives in A and B, and immigrants. The next natural step, left for the future research, is to generalize this model by allowing heterogeneity, both across countries and within the immigrant population. It is especially important in analysis of high-tech knowledge industries, where ethnic, cultural, and social diversity plays even more important role. Indeed, as Florida and Gates (2001) and Florida (2002) show in their studies of metropolitan areas in the U.S., the population diversity is a strong indicator of metropolitan areas’ high-technology success. These papers argue that a high percentage of gay population, number of artists and “bohemians”, a high concentration of foreign-born residents are closely linked with the area’s high-technology concentration and growth (see also Saxenian (1999)).
Another important direction of future research is an investigation of international trade consequences between countries as a function of their distinct industrial specialization and distribution of skills and talents within their working force (for the latter see Grossman and Maggi (2000), Grossman (2002), Das (2004)).
7 Appendix
Proof of Lemma A: (i), (iv) and (v) are straightforward. For (ii) note that
∂[g(δ, x)x]
∂x = (1 +x−δ)1δ−2[−(1−δ)x−δ+ 1 +x−δ] = (1 +x−δ)δ1−2[δx−δ+ 1]>0.
Finally, to prove (iii), we have
g(δ, x) =e(1δ−1) log(1+x−δ). Then
∂g(δ, x)
∂δ =g(δ, x)
∙
−1
δ2 log(1 +x−δ)−(1δ −1)x−δlogx 1 +x−δ
¸ .
This expression is, obviously, negative whenx≥1. If 0< x <1, we have
∂g(δ, x)
∂δ =− g(δ, x)x−δ δ2(1 +x−δ)
£xδlog(1 +x−δ) + log(1 +x−δ) +δlogx−δ2logx¤
=− g(δ, x)x−δ δ2(1 +x−δ)
£xδlog(1 +x−δ) + log(1 +xδ)−δ2logx¤
<0.2
Proof of Proposition 3.2: Equation (4) implies that the best response of country A is given by
dx?A dxB
=− γNB
(1−α)x−Aα−1(1 +xA−α)1−α2α + 2γNA
. (6)
Similarly, the best response of country B, given by (5), is determined by dx?B
dxA
=− γNA
(1−β)x−Bβ−1(1 +xB−β)1−β2β + 2γNB
. (7)
Note that the inverse of the right side of equation (6)
−(1−α)x−Aα−1(1 +x−Aα)1−2αα + 2γNA
γNB
(8) represents the slope of the reaction curve of countryA with respect toxAaxis. However, the expres- sion in (7) is greater than −2NNAB, whereas the expression in (8) is smaller than −2NNBA. That is, the reaction curve of country B on the xA axis is everywhere flatter than that of country A. Thus, two
reaction curves do not intersect more than once, which, together with Proposition 3.1, implies the existence of a unique equilibrium.2
Proof of Proposition 4.1: (i) Let α<β,NA =NB, fA=fB. From (9), [g(α, xeA(p))−γNAxeA(p)]−[g(β, xeB(p))−γNAxeB(p)] = 0.
Since, by Lemma A, g(α, xeA(p))> g(β, xeA(p)), we have
[g(β, xeA(p))−γNAxeA(p)]−[g(β, xeB(p))−γNAxeB(p)]<0.
Invoking Lemma A again, we conclude that the function g(β, x)−γN x is declining in x, yielding xeA(p)> xeB(p).
(ii) Let α = β, NA = NB, fA < fB. Note that the substraction of (5) from (4) implies that for everyp∈P
[g(α, xeA(p))−γNAxeA(p)]−[g(β, xBe(p))−γNBxeB(p)] = fA−fB. (9) Letα=β, NA=NB and fA < fB. Then (9) yields:
[g(α, xeA(p))−γNAxeA(p)]−[g(α, xeB(p))−γNAxeB(p)]<0.
Since, by LemmaA, the functiong(α, x)−γNAx is declining in x, it follows that xeA(p)> xeB(p). 2
Proof of Proposition 4.2: Letα =β, NA> NB and fA =fB.
(i) Invoking (9), we obtain
[g(α, xeA(p))−γNAxeA(p)]−[g(α, xeB(p))−γNBxeB(p)] = 0, (10) and, since NA> NB,
[g(α, xeA(p))−γNAxeA(p)]−[g(α, xeB(p))−γNAxeB(p)]>0.
Since, by Lemma A, the function g(α, x)−γNAx is decreasing in x, it immediately follows that xeA(p)< xeB(p).
(ii) Since xeA(p)< xeB(p), by Lemma A and (10), we have
[g(α, xeA(p))−g(α, xeB(p))] = [γNAxeA(p)−γNBxeB(p)]>0.
Moreover, since, by Lemma A, g(α, xeA(p))> g(α, xeB(p)), it follows that NAxeA(p)> NBxeB(p).2
Proof of Corollary 4.3: Let α <β, NA > NB and fA < fB. If xeA(p) ≥ xeB(p), the statement is straightforward. LetxeA(p)< xeB(p), SincefA< fB, (9) implies that
[g(α, xeA(p))−γNAxeA(p)]−[g(β, xeB(p))−γNBxeB(p)]<0.
By Lemma A, g(α, xeA(p))> g(β, xeA(p)), and we have
[g(β, xeA(p))−g(β, xeB(p))]−[γNAxeA(p)−γNBxeB(p)]<0.
Since, by Lemma A, g(β, xeA(p))> g(β, xeB(p)), it immediately yieldsNAxeA(p)> NBxeB(p).2
Proof of Proposition 4.4: Equations (2) and (3) imply that the equilibrium welfare levels of two countries, WAe(p) and WAe(p), respectively, are given by:
WAe(p) =NA(1 + (xeA(p))α)α1−1+γNA2(xeA(p))2 =NAg µ
α, 1 xeA(p)
¶
+γNA2(xeA(p))2 (11) WBe(p) =NB(1 + (xeB(p))β)1β−1+γNB2(xeB(p))2 =NB g
µ β, 1
xeB(p)
¶
+γNB2(xeB(p))2 (12) (i) Letα<β, NA=NB, and fA=fB. By assertion (i) of Proposition 4.1,xeA(p)> xeB(p). Since, by LemmaA, the function g(α,x1) is increasing in x, equations (11)-(12) imply that WAe(p)> WBe(p).
(ii) Let α = β, NA > NB and fA = fB. By assertion (i) of Proposition 4.2, xeA(p)< xeB(p). By LemmaA, the function g(α, x)x is increasing in x. Thus
g µ
α, 1 xeA(p)
¶ 1
xeA(p) > g µ
α, 1 xeB(p)
¶ 1 xeB(p)
or
g³ α,xe1
A(p)
´ g³
α,xe1 B(p)
´ > xeA(p) xeB(p). Since, by assertion (ii) of Proposition 4.2, xxeAe(p)
B(p) > NNB
A, (11)-(12) imply that WAe(p)> WBe(p).
(iii) Let α = β, NA = NB and fA < fB. By assertion (ii) of Proposition 4.1, xeA(p) > xeB(p).
Thus,NAxeA(p)> NBxBe(p), and (11)-(12) guarantee that WAe(p)> WBe(p). 2
Proof of Proposition 5.1: Take a point p = (α,β, NA, NB, fA, fB) ∈ P. The cooperative outcome, (xcA(p), xcB(p)) satisfies the following first order conditions:
∂(WA+WB)
∂xA
= 0 and ∂(WA+WB)
∂xB
= 0.
Expressions (4) and (5) imply that the cooperative outcome satisfies the following:
g(α, xA)−2γNAxA=c+ 2γNBxB+fA, (13) g(β, xB)−2γNBxB =c+ 2γNAxA+fB. (14) Notice that (13) and (4) are the special cases of the following equation
g(α, xA)−2γNAxA−c−qNBxB−fA= 0. (15) Indeed, if q =γ, (15) becomes (4), and ifq = 2γ, (15) it turns into (13). Similarly, (14) and (5) are the special cases of the equation:
g(β, xB)−2γNBxB−c−qNAxA−fB = 0. (16) Denote the solutions of (15)-(16) by xqA and xqB, respectively. It suffices to show that the function NAxqA+NBxqB declines in q on the interval [γ,2γ].
By the Implicit Functions Theorem we have:
dxqA
dq =−−NBxqB(g2(β, xBq)−2γNB)−qNANBxqA
∆ ,
where
∆= (g2(α, xqA)−2γNA)(g2(β, xBq)−2γNB)−q2NANB,
and g2 is the derivative of the function g with respect to the second argument. Since this derivative is negative and q≤2γ, it follows that ∆>0.
Similarly,
dxqB
dq =−−NAxqA(g2(α, xAq)−2γNA)−qNANBxqB
∆ .
Finally,
d(NAxqA+NBxqB)
dq =−NANB{[−g2(α, xqA)xqB−g2(β, xqB)xqA] + (2γ−q)[NAxqA+NBxqB]}
∆ .
Again, since the values of g2 are negative, the inequality 2γ−q ≥0 implies that the last expression is negative. 2
Proof of Proposition 5.2: Let ¯p = (α,α, NA, NA, fA, fA) ∈ P. Proposition 5.1 implies that xcA(¯p) = xcB(¯p) < xeA(¯p) = xcB(¯p). By the continuity argument, these relations will be preserved around the point ¯p. That is, there is a neighborhood U(¯p) ⊂ P such that xcA(p) < xeA(p) and xcB(p)< xeB(p) for every p∈U(¯p).2
Proof of Proposition 5.3: (i) Consider the function WA(λxA,λxB), where λ is a positive number. By (2),
WA(λxA,λxB) =NA(1 +xαA)1α −[c+γ(NAxA+NBxB)]NAxA−fANAxA. By differentiating with respect to λ we have:
dWA(λxA,λxB)
dλ =NA(1 + (λxA)α)α1−1xαAλα−1−[c+ 2λγ(NBxB+NAxA)]λNAxA−λfANAxA. The value of the last expression at λ= 1 and (xeA(p), xeB(p)) is:
xeA(p)(g(α, xeA(p))−2γNAxeA(p)−2γNBxeB(p)−c−fA,
which, by (4), is negative. Thus, a sufficiently small increase inλ would raise the welfare of country A. The argument for countryB proceeds along the same lines.
(ii) Consider the function WA(xA+ε, xB+ε), whereε is a real number. By (2), we have
WA(xA+ε, xB+ε) =NA(1+(xA+ε)α)α1 −[c+γ(NA(xA+ε)+NB(xB+ε)]NA(xA+ε)−fANA(xA+ε).
By taking the derivative of this welfare function with respect toε at ε= 0, we obtain:
NA(1 +xαA)α1−1xαA−1−[c+ 2γ(NBxB+NAxA)]NAxA−fANA.
Equation (4) implies that the last expression is negative at the point (xeA(p), xeB(p)). Thus, a suffi- ciently small increase inεwould raise the welfare of countryA. The argument for countryB proceeds along the same lines.2
8 References
Bulow, J., Geanakoplos, J, and P. Klemperer (1985), “Multimarket oligopoly: strategic substitutes and complements”, Journal of Political Economy93, 488-511.
Das, S. P. (2004) “Vertical diversity and equilibrium growth”, Indian Statistical Institute Discus- sion Paper, New Delhi, June 2004.
Esteban, J.M. and D. Ray (1994) “On the measurement of polarization”, Econometrica 62 (4), 819-851.
Florida, R. (2002), “Bohemia and economic geography”,Journal of Economic Geography2, 55-71.
Florida, R. and G. Gates (2001), “Technology and tolerance: the importance of diversity to high-tech growth”, Brookings Institute Discussion Paper, Washington, DC.
Fujita, M. and J.-F. Thisse (2003), “Does economic agglomeration foster economic growth? And who gains and looses from it?” Japanese Economic Review, forthcoming.
Grossman, G. and G. Maggi (2000), “Diversity and growth”, American Economic Review90 (5), 1255-1275.
Grossman, G. (2002), “The distribution of talent and the pattern and consequences in interna- tional trade”, CESifo Working Paper #745.
Imai, M. (1989), Kaizen: the key to Japan’s competitive success, McGraw-Hill, New York, NY.
Kremer, M. (1993), “O-Ring theory of economic development”, Quarterly Journal of Economics 108, 551-575.
Lucas, R.E. (1988), “On the mechanics of economic development”, Journal of Monetary Eco- nomics22, 3-42.
Maignan, C., Ottaviano, G. and D. Pinelli (2003), Economic growth, innovation, cultural diversity.
What are we all talking about? A critical survey of the state-of-the-art, The Fondazione Eni Enrico Mattei Working Paper #12.2003.
Milgrom, P. and J. Roberts (1990), “The economics of modern manufacturing: technology, strat- egy, and organization”American Economic Review 71, 845-858.
Saxenian, A. (1996), Regional advantage: culture and competition in Silicon Valley and Route 128, Harvard University Press, Cambridge, MA.
Saxenian, A. (1999), Silicon Valley’s New Immigrant Entrepreneurs, Public Policy Institute of California, San Francisco, CA.
Tirole, J. (1988), The Theory of Industrial Organization, The MIT Press, Cambridge, Massa- chusetts.
Wong, K. (1995), International trade in goods and factor mobility, MIT University Press, Cam- bridge, MA.
Figure 1: The labor productivity in the ”rest of the world,” WR(NR−I), and the real immigration wI.
Figure 2: The determination of the best response functionx∗A(xB).
Figure 3: The uniqueness of the equilibrium.