Chapter 2 Made in Brazil: Industrial Competitiveness Ten Years after Economic Liberalisation
権利 Copyrights 日本貿易振興機構(ジェトロ)アジア
経済研究所 / Institute of Developing
Economies, Japan External Trade Organization (IDE‑JETRO) http://www.ide.go.jp
シリーズタイトル(英 )
Latin America Studies Series
シリーズ番号 4
journal or
publication title
A Study on the Impact of Economic Liberalization in Brazil: 1995‑2002 page range 32‑85
year 2003
URL http://hdl.handle.net/2344/00010934
Chapter 2
Made in Brazil:
Industrial Competitiveness Ten Years after Economic Liberalisation
*João Carlos Ferraz, David Kupfer and Mariana Iootty
1. INTRODUCTION
In 1996, we published, in Portuguese, with Lia Haguenauer, the book “Made in Brazil: competitive challenges for the industry” (Ed. Campus). This was a major work where, departing from an analytical framework we developed at the Instituto de Economia, Universidade Federal do Rio de Janeiro, we analysed a massive amount of original data and articles produced by a large number of sectoral specialists, in a major research project, co-ordinated our partners from UNICAMP, headed by Prof. Luciano Coutinho, and us. This was an analysis of the competitiveness of the Brazilian industry in the turn of the decade.
Made in Brazil had a major impact on specialised circles because of its wideness and thoroughness.
Since then we have been willing to follow the lead of the 1996 book, to further improve the analytical framework and to update the analysis of competitiveness. Now we have an unique chance to get close to our wishes, but relying, once more, on a major research co-ordinated in 2001/2 by our partner, Luciano Coutinho, and produced for the Brazilian Ministry of Development, Industry and International Trade (MDIC), with funding from FINEP, an agency from the Brazilian Science and Technology Ministry.
Sectoral reports for the project “Estudo da Competitividade de Cadeias Integradas no Brasil” were used, once again, as the basic input for the present analysis. We used data and information on sectoral reports to provide our interpretation on the competitive changes in the Brazilian industry, between 1990 and 2003. The following sectors were analysed: in the commodity industrial group, steel, pulp and paper and citrus; in durable, consumer electronics and automotive; in traditional industries, shoe and textile and garments, in innovation carriers: mechanical engineering capital goods, telequipment and the computer industry. 1
During this period the Brazilian economy went through a major institutional change: rules governing relations among economic agents changed in tow respects. First, and structurally most important, economic liberalisation is the central feature of the national regime of incentives and regulations. Secondly, price stabilisation has been, as never before, a major target of macroeconomic policies. To what extent institutional changes implied corresponding structural changes in industry? Are competitive pressures greater? The relative importance among industrial groups has changed? New activities emerged? Which ones cease to exist? Are firms more competitive? Which ones? Are they relying on those competences –i.e.
innovation capabilities- that are widely known as conforming the basis for sustained or expanded market shares?
These are the questions guiding us in this article. In the first section we will update the 19996 discussion on patterns of competition and competitiveness. It will be seen that we still rely, strongly, on the very same analytical framework. Still, we believe that around the space of competition is where the dynamics of the
* This article is dedicated to our late partner, Lia Haguenauer. We will always miss her companionship, professionalism and personal integrity. Our writings will never again be so sharp and clear.
1 We must thank Achyles Barcelos da Costa, Fábio Erber, Fernando Sarti, Germano Mendes de Paula, José Rubens Dória Porto, Márcia Azanha Ferraz Dias de Moraes, Marcos Fava Neves, Maria Graça Derengowsky Fonseca, Matheus Kfouri Marino, Mauro Thury de Vieira Sá, Rafael Oliva, Roberto Vermulm, Victor Prochnik for producing such a high quality material.
capitalist machine is fully revealed. The second section provides an account of the most important institutional changes and an aggregate overview of the industry’s evolution between 1990 and the early 2000s. Following from there the next four sections analyse competitiveness in each of the four industrial groups of the early 1990s: commodities, durable goods industries, traditional industries and innovation carriers industries. The last section provides an overall balance, indicating commonalities and differences among them.
2. METHODOLOGICAL REMARKS: PATTERNS OF COMPETITON AS A TOOL FOR ANALYZING COMPETITIVENESS
2.1. ON THE NOTION OF COMPETITIVENESS
Traditional analysis of competitiveness can be classified into macro and micro approaches. The macro approach focuses on allocative efficiency: if an economy has the right prices, it would automatically produce the correct investment, leading to best advantageous specialisation. From a microeconomic approach, competitiveness is associated to technical efficiency: the adoption of best practices implies adequate productivity levels, which are automatically transferred into better market shares. As argued by Haguenauer (1989), these approaches are not sufficient; they assume automatic transmission mechanisms and lack of information failures, which are seldom found in the daily operations of businesses.
Market shares are conquered as a result of a productive performance that incorporates efficiency in product and process developments. These, in turn, are derived from accumulated resources mobilised by past strategic decisions. These are based on anticipating demand expansion and other economic expectations as well as similar actions taken by competitors. Thus, to overcome the weaknesses of traditional approaches while, at the same time, drawing on specific contributions that are valuable, such as the notion of efficiency and market shares, it is necessary to develop an approach closer to what is known as structural approach, where competitiveness is perceived as an interactive process between firm, industry and macro determinants. (Kupfer, 1993)
In this text, competitive firms are those capable of formulating and implementing strategies leading to sustained or expanded market position in the segment of industry where it operates. A couple of remarks on this basic definition are necessary.
Firstly, it is necessary to distinguish different aggregation levels of analysis. Competitiveness must be defined at firm level, referring to specific markets, which could be associated to segments of industries. A firm is competitive if its strategies, capabilities and performance are coherent with the critical factors of success in the activity it operates. Nonetheless, it is necessary to emphasise the notion of the space of competition. If the competitive process is fully revealed in specific markets, the aggregation proxy for segments of industrial sectors is formed by a set of firms operating in similar markets. This group of firms conforms an industrial segment and standardised sectoral industrial classifications aggregate them in a number of segments or sub-sectors. By aggregation, in a given moment of time, it is possible to consider a sector competitive if the majority of its production is derived from competitive firms, operating in the sector’s various segments. At this level firms are aggregated by market similarity.
Secondly, competitiveness must be viewed as a dynamic concept in a double dimension. In the first dimension, competitiveness is related to a firm’s accumulated capacity, in itself a dynamic notion, since present capacity results from past strategic decisions on where financial resources should have been allocated. The ex-post performance of a firm – higher or lower market-share – reveals whether past strategies and capacities were competitively adequate or not. Thus present market position does not necessarily ensure future competitiveness. The second dimension is related to changing market conditions, derived from strategies adopted by other firms that cause changes in relevant competitive drivers in that industry. This consideration leads to another central concept – patterns of competition or a set of competitive drivers. Competitiveness stems out of the adequacy of individual firms’ strategies to the specific drivers prevailing in each market.
2.2. PATTERNS OF COMPETITION
Patterns of competition are defined as the collection of key factors (drivers) required for competitive success in each industry. Given the large number of possible intervening drivers, it is necessary to organise them under some type of criteria. A simple and operational criteria is one in which factors are organised according to the capacity of a single firm to influence their direction and evolution.
Thus, a collection of determinant factors, representing the results of its past and present strategies, lay within the boundaries of the firm (internal factors), where it has complete control. Another collection of factors is industry specific (structural factors). They have equal importance to firms operating in similar market segments. In general, individual firms have only limited and indirect control over structural factors.
Finally, there is a collection of drivers (macro factors) that are associated to the political and economic environment of a country and placed well beyond the influences of individual firms. Thus, a competitive process has a systemic character, determined not only by individual firm’s efforts, but also by the nature of the industry in which it operates and by economic/institutional aspects.
Internal factors refer to decisions, accumulated capacities and performance in the areas of management (entrepreneurship, strategic planning, finance), sales efforts (marketing), production (equipment and process technologies, organisational techniques, quality management), and innovation (product and process innovation, technology flows). In all these areas human resources are essential, requiring skills corresponding to specific functions. Firms must be efficient in most areas to be competitive but, in different patterns of competition, necessary skills, competences and specific drivers, critical for competitiveness, may differ.
Structural factors are those that shape competition rules and conditions under which every firm has to operate, within the same industrial segment. They can be divided into three categories: market and demand, industrial configuration and regimes of incentives and regulation. As in the case of internal factors, different industries define different competitive drivers at the structural level.
Demand/market drivers can be described according to volume and growth rates of demand; access to national and international markets; geographical and income descriptors of a market; price, quality, technological level and other attributes of products. Generically, growing markets and diversified consumer requirements in terms of price, quality, sophistication, technology and other attributes allow for greater market segmentation and lower tolerance against less competitive products.
An industrial configuration can be described in terms of technical and firm level economies of scale and scope; technological trajectories of products and processes; access conditions to equipment, inputs, services and technology, including the nature of relations between firms, clients and suppliers, services and infrastructure. Again, generically, an industrial configuration may contribute to competitiveness if size of firms and productive integration are sufficiently high, where horizontal and vertical clusters abound and where the available infrastructure and services allow for minimum external down time.
The regime of incentives and regulation defines specific institutional rules under which firms of a certain industry must operate. Incentives are those associated with lowering the cost of investments and running production (credit, taxes, fiscal incentives, etc). Regulations are related to rules that define for economic agents the degree of freedom of operations, including legislation on property consumer, environment, competition, etc. Generically a pro-competitive regime induces high levels of rivalry among competitors and is capable of lowering capital costs to levels similar to those prevailing in other markets.
The third level where competitive drivers are located refers to framework conditions. They can be divided into:
- political-institutional: political stability, institutional development;
- economic: exchange, interest and wage; tax and tariff policies, supply of credit, and other variables related to overall performance of the economy;
- infrastructure: availability, quality and cost of energy, transport, telecommunications, - social: education and vocational training system, social security;
- international: capital, technology and trade flows.
Economic and institutional determinants of investment and production are a sine qua non condition of competitiveness; they define the contours within which firms are able to compete in markets for goods, services and capital. The potential competitiveness of a country’s firms relies on its macroeconomic performance, on its institutional framework, on its insertion into international trade and finance, on the availability of adequate human resources.
Successful economies have combined a certain degree of openness with policies that are conducive to investment, macroeconomic stability and strong institutional arrangements. Stability facilitates the emergence of clusters of capabilities that are necessary to bring about coherence and consistency of pro- competitive actions by the private sector, in the long run. Likewise, competitive economies are likely to be those where public authorities have implemented a whole set of policies not only well but also simultaneously.
When the macroeconomic environment is unstable, usually firms and institutions follow adaptive strategies not conducive to competitiveness and sustained development. Unstable paths of fundamental macroeconomic variables, as for instance, low investment during long periods of time, influence the structure of production through the election of activities, technologies and assets by firms, operating in condition of limited valuation of economic risk and low capital efficiency. In such context, considerations about industrial linkages, technological opportunities, organisational practices and the introduction of new products and processes are left behind due to the burden of short-term economic instability and the unpredictability of future economic policies.
2.3. DEFINING PATTERNs OF COMPETITION AND COMPETITIVE DRIVERS
The analysis of competition requires the identification of competitive drivers in different market segments.
Porter (1980), drawing on classical industrial organisation literature proposes two generic business strategies –cost and differentiation- with two other corresponding strategies for more focused business orientations. Drawing on the literature on industrial organisation and market structures, and on empirical evaluation undertaken in Brazil, it is possible to suggest the existence of four different orientations for competitive strategies, each associated with specific sources of advantages, at the level of the firm and the industrial structure.
Firms can be successful by offering: (i) cost advantages, (ii) product differentiation, (iii) responsiveness or, (iv) technologically sophisticated products. Very few firms can achieve excellence, simultaneously, in every source of competitive advantage. Competitive firms are those that focus and develop coherent strategies, capabilities and performance on the relevant factors concerning the pattern of competition that prevails in the specific industry they intend to operate.
As shown in Table 1, as firms focus specific strategies, they are bound to develop and rely on corresponding sources of competitive strategies.2
Price/cost competition is typically the case of standard commodity market segments. Since these commodities are intrinsically undifferentiated, competitive firms are those which manage to have low unit costs and high production volume, ensuring production efficiency, mainly by operating capital intensive plants that yield high economies of scale, as well as developing efficient logistics systems, thus reducing inputs and distribution costs.
Product differentiation can be achieved by technology, quality, price and marketing activities. It requires a wide span of capacities and resources. Most advanced firms try to concentrate in design and marketing functions while production is extensively sub-contracted. Thus the mobilisation and supervision of partners is an essential source of competitive advantage.
Responsiveness is a strategy strongly associated with production flexibility. Firms target market niches aiming at specific consumers, stratified by income, age, peculiar interests, customs, etc. Others direct their
2 Macro determinants, being generic, were not considered in this classification, although it is possible to suggest that the impact of macro determinants is differentiated by sectors.
efforts toward delivery, taking advantage of their proximity to clients and/or suppliers and adopting techniques like quick response. Capacity requirements are less strict than in other patterns, but it is important to have management and supervisory skills, as well as product quality levels acceptable to a particular market niche.
Innovation is the source of competitiveness in technologically sophisticated market segments, like precision instruments or aeronautical equipment. Firms must have strong technological capacities, highly skilled R&D technicians and access to updated science and technology laboratories.
In summary, a pattern of competition arises from competitive rivalry, from efforts by competing firms.
Once a pattern of competition and competitive drivers are established as standards, strategies of all firms must follow suit. In most industries a very finite or only one pattern of competition prevail. However, where geography and income differences abound or in industries where families of similar products may co-exist, firms pursuing different patterns of competition can survive and prosper.
TABLE 1
PATTERNS OF COMPETITION: STRATEGIES AND SOURCES OF COMPETITIVE ADVANTAGES
SOURCES OF COMPETITIVE ADVANTAGES
COMMODITIES (COST STRATEGY)
DURÁBLES
(DIFFERENTIATION STRATEGY)
TRADITIONALS (RESPONSIVENESS STRATEGY)
INNOVATION CARRIERS (INNOVATION STRATEGY) INTERNAL FACTORS
MANAGEMENT process control organisational flexibility workers and entrepreneurial skills R&D-production-marketing integration PRODUCTION mass flow & energy efficiency assembly and supply-chain co-ordination
capabilities quality control design for manufacturing
SALES access to distribution channels brand image market information market creation & business to business marketing
INNOVATION process technology product & components design embodied technology, learning by doing R&D + design STRUCTURAL FACTORS
standardisation segmentation by quality and marketing segmentation by levels of income & type
of product segmentation by technical needs
MARKET price, technical conformity price, brand, technological content, technical assistance
price, brand, delivery times, customer
orientation attendance to client specifications access to international trade regional & global trade local & international trade local & regional trade
plant level economies of scale firm and plant level economies of scale
& scope
economies of agglomeration and
networking economies of specialisation
CONFIGURATION OF INDUSTRYaccess to raw materials & transport logistics
articulation assembler-supplier,
distribution horizontal & vertical networks interaction with users
specialised technical services metrology & standardisation
metrology, standardisation, certification
& accreditation; market & technical information; training
science & technology systems anti-dumping & commercial policy property rights anti-dumping intellectual property rights REGIME OF REGULATION
AND environmental protection consumer legislation competition & consumer policies selective protection
INCENTIVES cost of capital consumer credit support for SME risk support
fiscal incentives tax system credit for users
state purchasing power
3. 10 YEARS OF INSTITUTIONAL CHANGE AND INDUSTRIAL PERFORMANCE
3.1. A BRIEF SKETCH OF THE MAIN INSTITUTIONAL REFORMS: THE BRAZILIAN INDUSTRY UNDER
TRADE LIBERALIZATION PRESSURE
The 1980s were a period of great technological advance on the industrialised countries in general, and on the newly industrialised countries (NICs) in South East Asia in particular. Inversely, during the same period the Brazilian industry underwent significant tensions due to the macroeconomic instability and the institutional transition derived from the exhaustion of the import substitution model as the basic reference for its national development. As a result, the technological gap, once reduced by the catch-up of the 1970’s, was again expanded. Although the Brazilian industry survived the lost decade, maintaining a complete and integrated industrial structure, by the end of 80s it presented significant deficiencies in terms of process and product technologies, and production organisation.
In the 1990s, the global context was delineated by a strong competition between firms and countries, by the commercial and cross-borders capital flows, and by the diffusion of new technologies, specially information technologies. The USA and Europe have both consolidated the liberalisation process of their foreign exchange policy and financial sector regulation, thereby enhancing the capital mobility between different economies.
In Brazil, the first years of the 1990s were a period depicted by two consecutive shocks on the competitive context – the economic liberalisation in 1990 and the monetary stabilisation resulted from the Real Plan in 1994. The subsequent changes were induced by structural reforms on the external sector, the international financial sector integration, and the state owned firms which implied the development of new growth strategies from the leading firms, and by a redefinition of the inter and intra relationship between those firms and the State.
The most relevant microeconomic features of these reforms were: (i) the economic deregulating process, which included the exclusion of price control mechanisms for goods and services and the removal of
“protected market zones” and other regulatory requirements for investments in Brazil; ii) the trade and financial liberalisation process, trough the reduction of tariffs and non-tariffs barriers and the deregulation of the foreign capital flows; iii) the privatisation process, in order to redefine the State role in the economy.
The Brazilian privatisation process had a double bottom line, the national industry modernisation, and the reduction of the fiscal debts.
The commercial liberalisation process of the 1990s was surely the most consistent of all the economic and institutional policies promoted in Brazil since the 1980s. Following a significant tariff reduction schedule, the mean value of the nominal tariff was diminished from 32,2% (with interval 0-105% and standard deviation of 19,5) to 14,9% (with interval 0-40% and standard deviation of 10,7) in July 1993 (Kume, 1996).
Although not so widely discussed, the measures concerning the patrimonial structure were also important to define a new institutional regime. The main target of these measures was to equalise the rules of the game between foreign and national firms, thereby stimulating the inflow of foreign capital. As a counterpart, it was expected that the foreign capital would increase the competitive pressure on the national scenario, and would ease the access to new technologies and open new investment financing sources.
Among the measures that equalised the rules between foreign and locally owned firms, the most outstanding are: extinction, in 1991, of the restrictions to the foreign firms entry in the technologies of information sector; elimination, in October 1993, on the imposed limits to the foreign capital participation in the privatisation process; elimination, by a constitutional emend of 1994, of the established legal differentiation between national and foreign firms, that made possible the access to official credit agencies, subsidies and incentives to foreign firms; exemption of income tax for profit and dividends remittances by the foreign affiliates in the country; elimination, decided by Congress vote in 1995, of several restrictions to industrial property, mainly the prohibition of patents registration of drugs and biotechnology based
products; extinction by an act, of the prohibition in remitting royalties payment for brands and patents in multinational firms; removal, by the constitutional reform of 1995, of the sector restrictions to the foreign capital participation in the services sector (more notably in the financial sector), extractive activities (end of the State monopoly over petroleum) and telecommunications; and financial liberalisation that created more favourable conditions for the transnational firms established in the country, eliminating the restrictions to the use of national financial system and thus access to the BNDES funding.
The macroeconomic changes were intimately associated with the monetary reform issued by the Real Plan in 1994 and also with the subsequent return of capital inflows. The Real Plan successfully decreased the inflation spiral3, and promoted a significant increase of demand due to the growth of real wages and the renascence of consumption-credit of durable goods. On the other hand, the return of capital inflows was important to cover current account deficits and to finance fixed capital investment. The overvaluation of the national currency during the 1994-1999 period was a natural consequence, which was pushed even further by a set of specific policies defined by the Central Bank to reinforce it.
In fact, with the Real Plan in 1994, a new phase in the industry path began. Appreciated exchange rate and high interest rates, the two pillars of the macroeconomic stabilisation plan, together with bringing forward the end of the initial schedule of the tariff reduction to December 1994 and the adoption of the Mercosur External Tariff were the main characteristics of the new competitive environment established in the country. In practice, these measures are responsible to the deepening of the international exposure of the Brazilian industry, where began the effective openness of the economy, that continue up to the exchange rate devaluation in the early 1999. The impacts of the local currency evaluation and tariff reduction after the Plano Real exacerbate the competition with the imported goods, resulting in a rapid deterioration of the trade balance, in deficit from 1995. The resume of the external capital influx permitted the financing of the trade deficit, however, of short breath regarding the risk of vulnerability of the external accounts. The current trade maintained its expansion until 1997, where suffers a sudden reverse, indicating that the competitive regime implemented during this period become exhausted.
This internal and external environment posed new challenges to Brazil: the need to preserve the solvency of the financial system and to maintain sound macroeconomic foundations. During the 1990s, the Brazilian economy faced a positive net capital inflow, of unprecedented magnitude, which was extremely dependent on a particular set of favourable external circumstances. As a result, the foreign expenditure and the current account deficits increased to levels not compatible with macroeconomic stability. Actually, the abundant entry of financial resources exerted negative effects on monetary supply and on exchange rates. Exports were affected; imports expanded significantly and Brazilian economy became very vulnerable to possible changes in the international context. Therefore, the government was forced to sterilise the monetary effects of foreign capital, by increasing interest rates. Consequently, the counter face of external financial dependence was revealed not only in a weak growth of expansion-related investments, but also in an insufficient GDP growth during all the 1990s.
In this context, the next section analyse the Brazilian industry performance in the 1990s, focusing on four main dimensions: industrial production and employment; productive and ownership structures; external trade pattern; and fixed capital and R&D investments strategies.
3.2. THE EFFECTS OF LIBERALIZATION AND DEREGULATION DURING THE 90’S
3.2.1. More production with less workers
In the 1980s, the employment level experienced fluctuations following the path of erratic production level changes. However, from the beginning of the 1990s, the productions and employment series start to follow opposite trends. The Figure 1 shows a clear divergence between these series, particularly after 1993.
3 Inflation rates decreased from more than 1000% in 1993 to 20% in 1995 and 5% in 1997.
FIGURE 1
OUTPUT AND EMPLOYMENT IN BRAZILIAN MANUFACTUTING INDUSTRY, 1985-1999
60 70 80 90 100 110 120
1985 1986 1987 1988 1989 1990 1991 1992 1993 1994 1995 1996 1997 1998 1999
Ano
1985 =100
Output Employment
Source: IBGE – Monthly Industrial Survey and Monthly Employment Survey
Many economists, as Gonzaga (1996), identify the beginning of the 1990s as a structural break point on the relation between production level and employment. Today, this interpretation is well accepted, but this subject was vastly debated after 1991. For authors as Gonzaga (1996), Amadeo and Soares (1996), Bonelli (1996), the clear divergence between product and employment series in the 90s could be regarded as evidence that significant technological changes – in production process and/or in production organisation – were carried out. This explanation tries to shed light on the microeconomic transformations developed inside the firms. The commercial liberalisation and the economic deregulation would have bring about new parameters on decision process of firms which was trying to achieve productive efficiency.
Other authors, such as Silva et alli (1994), sustained the interpretation that there was no evidence that the economy was coming through a general structural adjustment. For these analysts, the economy was simply facing a recessive adjustment.
It is important to remark that a significant part of the satisfactory performance of production must not be taken as a clear effect of a modernisation process, but as a statistical effect concerning the data, which was based on series of production value, not on ideal series of value added4.
Nevertheless, though there was not a consensual interpretation among the analysts on this point, all of them have recognised a clear trend of productivity growth, at least in the beginning of the 1990s. The growth of the industrial production level in 1993 was followed by an acceleration of productivity indexes. This productivity performance was regarded as a clear indication that a fast and general modernisation process
4 About the difficulties to compute productivity data in this period see, for instance, Salm, Sabóia and Carvalho (1997) or Amadeo and Soares (1996)
was being developed. At a first sight, it was these new facts, not new analysis that have finished the debate.
3.2.2. The same productive structure but with different owners
Several studies (e.g. Kupfer, 1998) conclude that no important change had ocuured in the sector distribution of the industrial production during the 1990s. Considering all production activities, the participation of the industrial sector to the GDP remained unchanged from 1991 to 2001 (Table 2). The manufacturing industry, after the initial expansion during the first phase of the trade openness (until 1993) started a fast falling trajectory just after 1994, when the effects of the Real appreciation due to Real Plan deepened the degree of the real openness of the Brazilian economy.
TABLE 2
GDP STRUCTURAL COMPOSITION, 1991 A 2001, SELECTED YEARS, (%)
Sector 1991 1992 1993 1994 1995 1996 1997 1998 1999 2000 2001
Agriculture 7,8 7,7 7,6 9,9 9,0 8,3 8,0 8,2 8,2 7,7 8,0
Industry 36,2 38,7 41,6 40,0 36,7 34,7 35,2 34,6 35,6 37,5 35,8
Manufacturing 24,9 26,4 29,0 26,8 23,9 21,5 21,6 21,0 21,5 22,5 21,1
Services 56,0 53,6 50,8 50,1 54,3 57,0 56,8 57,1 56,2 55,0 56,2
Total 100,0 100,0 100,0 100,0 100,0 100,0 100,0 100,0 100,1 100,3 100,0 Source: IBGE/DECNA
From the data on the evolution of the different industrial groups output, showed in Table 3, can be evaluated the differences in the intra-industrial dynamics. Industrial commodities, durable goods industries, and food and beverages were the sectors that revealed a superior evolution to the mean of industry, and agricultural commodities, traditional industries except food/beverages and innovation carriers industries maintained almost the same production level through 1991 to 2000.
TABLE 3
INDEX NUMBER OF INDUSTRIAL OUTPUT (1991 = 100), 1991 A 2000
1991 1992 1993 1994 1995 1996 1997 1998 1999 2000
Industrial Commodities 100,0 99,7 103,7 109,5 109,6 115,9 122,8 126,8 130,3 138,2 Agriculture Commodities 100,0 101,9 98,4 94,4 97,2 100,6 104,0 101,2 105,4 98,9 Traditional industry except
Food/beverages 100,0 93,4 101,4 105,3 104,8 103,6 104,1 101,3 100,0 104,3
Food/beverages 100,0 95,7 98,9 107,2 121,6 127,0 127,3 128,9 128,9 130,5
Innovation Carriers 100,0 94,7 102,0 123,3 120,0 107,8 105,2 105,6 98,3 108,2
Durable Goods 100,0 89,8 115,2 133,0 147,6 153,4 165,8 133,9 123,1 148,6
Manufacturing Industry 100,0 96,3 103,5 111,4 113,4 115,4 119,9 117,4 116,7 124,2
Source: IBGE - Industrial Monthly Survey (Special Tabulation)
Contrary to sector distribution, the composition of the firms’ revenue per capital origin suffered a deep transformation in the period under analysis. According to Rocha and Kupfer (2002), in a study with the 300 biggest Brazilian firms (in liquid revenue), the market-share of the leading state owned, multinational and private national firms evolve during the 1990s, as follows:
• State owned firms – reduce the participation from 44.6 per cent in 1991 to 24.3% in 1999, where the major part of that fall (15.2 per cent) occurred between 1991 and 1996 and a minor part (5.3 per cent) between 1996 and 1999.
• Multinationals - grew its participation from 14.8 per cent to 36.4 per cent between 1991 and 1999, homogeneously through the two periods (11.6 and 10 per cent, respectively).
• Private nationals – maintained the share without big changes between 1991 and 1999 (40.6 and 39.3 per cent respectively) albeit the small share increase of 3.5 per cent between 1991 and 1996 and a little higher through 1996 to 1999 (4.8 per cent).
Data suggests that changes in the ownership structure of the leading firms occurred in a two phase process.
During first phase, corresponding to 1991-1996 period, there was transference of the revenues of the state owned firms to the private firms, independently from their nationality. This was the of privatisation phase.
In the second phase, corresponding to 1996-1999 period, occurred revenue transference from national firms, independently if they were private or public run, to multinational firms. This was the denationalisation phase.
The analysis of the mergers and acquisitions processes and of the role of the foreign capital investments and the privatisation permit a better understanding of the extension of the changes that occurred during the decade.
Operations involving changes in the corporate control of firms increased through this period. According to KPMG Consulting, 2353 M&A transactions occurred between 1991 and 2000, where ¾ were concentrated after 1996. A significant part of these transactions, especially concerning the values involved, was associated to the selling of state owned firms. According to BNDES, the revenues from the privatisation process surpassed US$100 billions from the beginning of 1991 through 2002, 2/3 of which were federal government run firms and the rest state run firms. In the first phase of the privatisation process (1991- 1995) the steelworks, mining and petrochemical sectors were exceptionally relevant and later the electrical power, finance services and telecommunications sectors. The last sector was, alone, responsible for US$ 30 billions in government revenues.
At the same time, inward foreign direct investments, that were minimal since the late 1980s, assist to an exponential growth from 1995 to 2000, as a result of a higher international liquidity and of the country attractiveness just after the stabilisation of the economy. A considerable part of this capital was re-directed to the acquisition of state owned assets, as shown in Table 4. Figure 2 shows the same trend. From 1996 on, the privatisation program had a new role with the entering of multinational firms, being responsible for an increase of the share of the take in operations.
TABLE 4
FLOW OF EXTERNAL CAPITAL FOR PRIVATISATION AND OTHER USES Inflow
Year Privatisation Others Total Outflow Net Flow
1995 ... 5.475 5.475 1.237 4.238
1996 2.645 7.851 10.496 603 9.893
1997 5.249 13.512 18.761 1.944 16.817
1998 6.121 22.359 28.480 3.002 25.478
1999 8.786 22.586 31.372 1.389 29.983
2000 6.677 26.726 33.403 3.387 30.016
2001 1.079 20.193 21.272 2.328 18.944
Source: BNDES (www.bndes.gov.br)
FIGURE 2
MERGERS AND ACQUISITIONS, PRIVATIZATION, AND SHARE OF EXTERNAL DIRECT INVESTMENT – US$ MILLIONS AND %
0 5000 10000 15000 20000 25000 30000 35000 40000
1991 1992 1993 1994 1995 1996 1997 1998
0,0 20,0 40,0 60,0 80,0 100,0
Valor Privatiz Valor Fusões e Aquis Particip. Privatiz. Estrangeiros Privat.
Source: Sieffert Filho and Silva (1999) and KPMG in Diniz and Boschi (2001)
As a result of the privatisation program implemented by the Brazilian government in early 1990s, particularly for the commodities industry, there was a significant change of ownership of the leading firms.
According to Rocha and Kupfer (2002), state owned firms, responsible for 42 per cent of the 1991 revenues, decreased their participation to 22.6 per cent in 1996, that is from the twelve state owned firms remained only Petrobras. This decline was followed by an increase of the share of the national firms that from 36.5 per cent share in the revenues were responsible for almost half of the total revenues for 1996.
However, this share was not sustained after 1996. At the same time, is interesting to see that multinational firms move forward in the commodities production arriving to 1999 with a market share very close to that of national firms.
During the 1990s we assist to a confirmation of the considerable role of foreign capital to the industry responsible for technological diffusion. Multinational firms, that controlled 60 per cent of the total revenue in 1991, continue to growth its importance and achieved 86 per cent market share by 1999. National firms suffered a reverse tendency decreasing its participation from 40 per cent in 1991 to 13.1 per cent in 1999, revealing loss of competitiveness. State owned firms, through Embraer were responsible for a mere 1 per cent to total revenues in 1991, left this market completely.
Also in the traditional industry, the multinational firms grew its role, from half of the national firms’
revenues in 1991 to achieving almost the same market share by the end of the decade.
As final statement, the observed pattern of changes suggests that the loss of competitiveness of national firms started in the period 1996-1999. Contrary some analysts’ arguments, this was truth for the whole industry and not only for technologically intensive industries. In this period, we assist to transference of the activities of the leading national firms to infra-structure services activities. Certainly, the privatisation of that sector opened a new space and opportunities for those firms exit industrial activities.
3.2.3. Regressive specialisation trend in the trade pattern
The external insertion of the Brazilian economy during the 1990s was characterised by a raise in the exports and imports. The imports rose faster than the exports provoking a reduction in the trade balance. Figure 3, shows the evolution of exports, imports, trade balance and trade flow for Brazil from 1980 to 2002, and permits to clearly verify the effects of the different competitive regimes on the trade balance, during the 1990s.
Between 1990 and 1993 the trade flow and the trade balance remained unchanged. This behaviour suggests that the tariff reform had had small impact in the international insertion of the industry (Kupfer, 1998).
Immediately after the Real Plan in 1994, as has been said, went together with an acute overvaluation of the Real, comes into our attention the raise of the trade flow due to the rapid expansion of the imports. As the
exports rose at moderate levels, most of the times at a lower level than the world exports, the imports duplicate from 1993 to 1995 (or triplicate from 1990 to 1997). As result the trade balance deteriorate to deficit levels by 1995, after 14 years of superavit results, being in the red by US$ 8.2 billions in 1997. Only after the predictable exchange rate crisis in January 1999, that result in a depreciation of the Real and the return to a fluctuate exchange rate system, started the reversion of this trade balance deficit. However, the trade flow remained stable, suggesting that the openness of the trade system achieve its limits.
FIGURE 3
BRAZILIAN FOREIGN TRADE: 1980-2002*
-20.000 0 20.000 40.000 60.000 80.000 100.000 120.000
1990 1991 1992 1993 1994 1995 1996 1997 1998 1999 2000 2001 2002*
Year
1000 Us$
Exports Imports Trade Balance Trade Flow
* Annualised from data until october/2002 Source: Alice Database
The changes in the external insertion of the industry were shown in different dimensions. First the increase of the Mercosul participation in the trade flow, but only until 1998. Table 5 shows the destination of the exports and the origin of the Brazilian imports for selected years during the 1990s. The growth of Mercosul role in the share of Brazilian exports is due to: (i) a certain diversification of export markets with the reduction of the EU weight in the exports and inversely (ii) a concentration of the imports from US and EU.
TABLE 5
DESTINATION AND SOURCE OF BRAZILIAN EXTERNAL TRADE 1990-2002 – SELECTED YEARS –%
Exports Destiny Imports Source
USA Mercosul EU Japan Others USA Mercosul EU Japan Others
1990 24,6 4,2 32,5 7,5 31,2 20,4 11,2 22,6 7,2 38,7
1993 20,7 14,0 26,4 6,0 32,9 20,4 13,4 23,5 7,6 35,0
1996 19,5 15,3 26,9 6,4 31,9 22,4 15,6 26,7 5,2 30,1
1998 19,3 17,4 28,8 4,3 30,2 23,7 16,3 29,2 5,7 25,1
1999 22,6 14,1 28,6 4,6 30,1 24,1 13,6 30,5 5,2 26,5
2000 24,3 14,0 26,8 4,5 30,4 23,3 14,0 25,2 5,3 32,2
2001 24,7 10,9 25,5 3,4 35,4 23,5 12,6 26,7 5,5 31,7
2002 25,7 5,5 25,0 3,5 40,3 22,1 11,9 27,7 5,0 33,3
Source: Alice Database
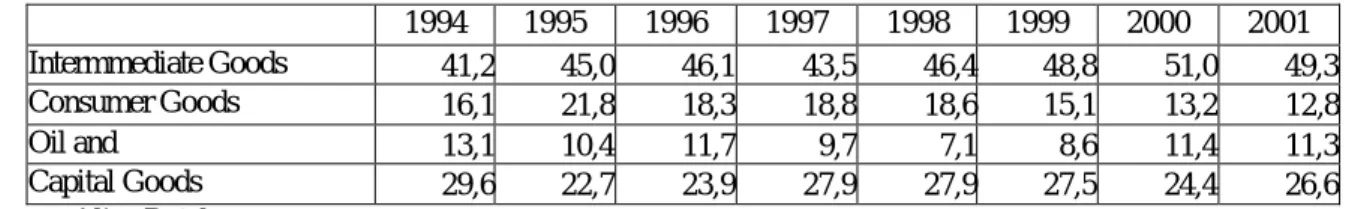
Also, there was a divergent tendency in the evolution of the mix of export and import goods. From the exports side (Table 6) between 1990 and 2000 we can see a small reduction on the participation of basic products (e.g. iron, soya flour, row coffee beans, triturated soya and tobacco leaves) and semi-manufacture products (e.g. pulp, row steel, row aluminium, soya oil, iron steel, crystal sugar) and to an increase of the manufactured products. After 2000, there was a reverse in this tendency, returning to the 1990 values.
From the imports side (Table 7) there was a consistent increase of the intermediary products participation, as a consequence of natural adjustment in the productive processes (subcontracting, outsourcing) implemented by the a large number of firms almost in all industrial sectors. Regarding the other imported items, the weight of imports oscillated cyclically. The contraction of participation in the consumption goods in the imports share after 1999 reflects the change in the exchange rate regime.
TABLE 6
COMPOSITION OF EXPORTS 1990-2002 – SELECTED YEARS - %
1990 1993 1996 1998 1999 2000 2001 2002
Basic Goods 27,8 24,3 24,9 25,4 24,6 22,8 26,4 28,1
Semi-manufacture Goods 16,3 14,1 18 15,9 16,6 15,4 14,2 14,8 Manufacture Goods 54,2 60,8 55,3 57,5 56,9 59,0 56,5 54,7 Source: Alice Database
TABLE 7
COMPOSITION OF IMPORTS 1994-2001 – SELECTED YEARS - %
1994 1995 1996 1997 1998 1999 2000 2001
Intermmediate Goods 41,2 45,0 46,1 43,5 46,4 48,8 51,0 49,3
Consumer Goods 16,1 21,8 18,3 18,8 18,6 15,1 13,2 12,8
Oil and 13,1 10,4 11,7 9,7 7,1 8,6 11,4 11,3
Capital Goods 29,6 22,7 23,9 27,9 27,9 27,5 24,4 26,6
Source: Alice Database
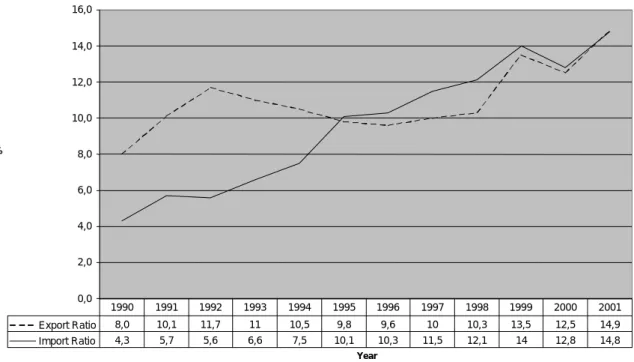
A more accurate measure of the change in the pattern of international insertion of the Brazilian industry is the relation between trade flow and the variables associated to the country’ size, such as production output.
Two measures are defined: exports coefficient (ratio of value of exports to gross output) and imports coefficient (ratio of value of imports to gross output).
Figure 4 shows the evolution of the exports and imports coefficients during the 1990s, for transformation industry. The values confirm the previous analysis. Table 8 shows both coefficients for selected sectors, those of more business volume. Two features claim our attention: the rapid evolution of the imports coefficient for those sectors of more value added and technologically more advanced, as electronic and electrical equipment, auto-parts and pharmaceuticals; and of the exports coefficient in those sectors of low added-value and low technological incorporation as shoes and leather, sugar, wood and furniture, and vegetal oils, however, automobiles and auto-parts are also responsible for a rapid increase of the exports coefficient.
FIGURE 4
MANUFACTURING INDUSTRY: EXPORT AND IMPORT RATIOS (%), 1990-2001
0,0 2,0 4,0 6,0 8,0 10,0 12,0 14,0 16,0
Year
%
Export Ratio 8,0 10,1 11,7 11 10,5 9,8 9,6 10 10,3 13,5 12,5 14,9
Import Ratio 4,3 5,7 5,6 6,6 7,5 10,1 10,3 11,5 12,1 14 12,8 14,8
1990 1991 1992 1993 1994 1995 1996 1997 1998 1999 2000 2001
Note: Export Ratio – export / gross output Import Ratio – import / gross output Source: Ribeiro e Pourchet (2002)
TABLE 8
MANUFACTURING INDUSTRY: EXPORT AND IMPORT RATIOS (%), 1990-2001
Industries 1990 1993 1996 1998 1999 2000 2001
Export Ratio
Calçados, couros e peles 23,8 43,3 38,5 42,9 53,8 61,0 74,9
Açúcar 13,8 20,1 27,1 31,2 44,0 24,1 46,0
Peças e outros veículos 16,2 21,1 18,6 26,5 39,5 41,0 45,0
Equipamentos eletrônicos 5,7 8,9 5,9 9,4 20,8 29,2 38,5
Óleos vegetais 29,2 26,8 25,9 20,5 23,7 20,9 27,6
Madeira e mobiliário 4,4 12,1 10,5 11,8 19,5 19,6 24,1
Veículos automotores 9,3 15,8 7,2 17,2 18,5 18,9 23,1
Import ratio
Equipamentos eletrônicos 13,9 31,0 40,1 57,5 98,6 103,8 122,7
Material elétrico 9,0 11,7 18,4 24,1 33,9 28,5 40,3
Peças e outros veículos 8,9 13,7 18,9 28,5 39,2 31,6 34,5 Farmacêutica e perfumaria 7,9 9,5 17,0 18,1 27,6 22,9 30,1
Máquinas e tratores 11,3 12,9 26,1 31,4 36,0 23,3 28,4
Note: Export Ratio – export / gross output Import Ratio – import / gross output Source: Ribeiro e Pourchet (2002)
The data presented in this section suggest that the international insertion of the Brazilian industry changed a lot after the post-openness period. The decisive years for this imports “explosive” trajectory were 1994 and 1995, concurrent with the transition period and the post- Real Plan. By the end of 1998, the financing model of the Brazilian balance of payments become unsustainable, inaugurating a new recession phase and successive local currency devaluation. After 2001 the balance trade recovered and presented positive values, reflecting a period of moderate exports increase and a contraction on the imports.
The depreciation of the Real occurred by the beginning of the 1999, brought expectations on a rapid growth returning of the Brazilian exports. However, after three years this did not occur. To some specialists, the feeble performance of the exports in recent years can be explained by the international unfavourable cycle of the prices of mining and agricultural commodities, establish in the international markets. To others, the explanations are less related to conjuncture factors but more with the trade restrictions to Brazilian products, as well issues related with the commercial policy, emphasising the importance of the negotiation strategies adopted by Brazil in the multilateral and regional efforts to a better positioning of country’ exports.
Although the above listed causes are pertinent, some structural factors should be incorporated to the analysis. The exports and imports dynamics of a country depend on two conjugated effects: the competitiveness effect that explains part of the variation of the trade flow which is related with the change in the market share of a country to the total of world trade flows; and the positioning effect, that explains the part of the variation of the trade flow which is related to the relative share of a sector in the world trade flows. Kupfer (2002) calculated the contribution of these effects in the EU and US markets, the more relevant markets for Brazilian exports for 1995-1999. In the case of US, only a third of the exports value presents competitiveness and positioning positive effects. For the EU market this number decreases to only 18 per cent.
The 2002 US$ 10 billions trade balance was close to the values of the 1984-1987 period. Although based on a similar list of exported products, the imported products list was quite different, and more intensive in dynamic products. So the commercial reforms were not capable of changing the competitiveness of Brazilian industry. By the way, the relative participation of Brazil in the international trade flows decreased from 1.4 per cent in the mid 1980s to the current 0.7 per cent.
3.2.4. Capital and R&D investment strategy are still the same:
One of the most critical conditions to the sustainable evolution of industrial competitiveness is the investments in fixed capital. These investments can congregate new productive capacity, and become an important factor of generating economies of scale and scope and incorporation of new technologies.
However, during the 1990s this was not the case for the Brazilian economy. The period is characterised by a lack of any tendency of expansion of the gross fixed capital accumulation, as we can see in Figure 5.
FIGURE 5
GROSS CAPITAL ACCUMULATION IN BRAZILIAN ECONOMY INDEX NUMBER 1990=100
0 20 40 60 80 100 120 140 160 180
1990 1991 1992 1993 1994 1995 1996 1997 1998 1999 2000 2001 trimestre/ano
Source: IBGE/DECNA
Albeit this general tendency, from the mid 1990s it is possible to observe some recovery in the rates of investment in the Brazilian industry to the GDP, surpassing the rates of the early 1990s, that were the lower of the last decade, as we can see in Table 9.
TABLE 9
INDUSTRIAL INVESTMENT / GDP RATIO CONSTANT PRICES OF 1980
1972-1980 4,5
1981-1988 3,2
1988-1993 2,2
1995-1997 3,2
Source: Bielschowsky (1998)
According to Bielschowsky (1998) forecast, the yearly investment level for 1995-97 would be, in absolute terms, 82 per cent above the mean for 1992-93. Nevertheless, these rates are far below those registered for the investment peak reached in the 1970s and are closer to the values observed during the 1980s. These comparatively low investments can show a resume on the investments in the industry, during the 1990s.
Bielschowsky (1998) presents a basic argument to justify the superior quality of the recent investments in the industry. According to a research conducted by CNI/ECLAC with 730 firms (see Table 10), the goals of the firms fixed investments planned and that took place during the 1990s, besides being related with the productive modernisation (especially concerned with costs reduction) was possible to detect an expressive growth of the expansion investments (particularly those related with new products launch in the market).
TABLE 10
MAIN GOALS OF FIRMS’ CAPITAL INVESTMENT 1992-94, 1995-96 E 1997-98 (% OF FIRMS BY GOAL INDICATED AS DOMINANT)
Goal 1992-94 1995-96 1997-99
Cost reduction 52,2 61,9 54,0
Equipment substitution 57,3 55,2 49,0
Unbottlenecks 30,2 43,4 32,9
Plant expansion 33,3 41,7 47,4
New products 27,1 39,2 57,3
New plants 11,4 20,4 32,9
Source: Bielschowsky (1998)
The tendency related with the resume of the pace of investment in the industry observed in the past years, must be, however, better defined regarding industrial sector specificities. The industry has been having a different reaction to the impacts of these investments in the transformation of the competitive environment.
The second issue to be analysed is the technological behaviour of the Brazilian firms during the 1990s.
Even if working with aggregated data, it is possible to characterise quite precisely the local innovative efforts achieved by the industry (PINTEC/IBGE – Industrial Survey on Technological Innovation, 2000).
This recent research, scrutinise the innovation efforts of the Brazilian firms as: (a) external acquisition of R&D and other knowledge; (b) launch of technological innovations in the market; (c) internal activities of R&D; (d) development of industrial projects or other technical procedures; (e) training of its members and (f) acquisition of machinery and equipments.
In this enlarged view, the Brazilian firms showed an active but budding innovation effort. By the end of 1990s, as shows Figure 6, only a third of the industrial Brazilian firms implemented some type of innovation. From a total of 70 thousand firms (with ten or more employees) for the period 1998-2000, merely 31.5 per cent implemented product and/or process innovations - 22.7 thousand firms. This 31.5 per cent innovation rate can be divided as: 6.3 per cent of firms only introduced product innovations, 13.9 per cent process innovations and 11.3 per cent both product and process innovations.
.
FIGURE 6
SHARE OF INNOVATING COMPANIES IN THE TOTAL SAMPLE, 1998/2000
Source: IBGE, Industrial Survey on Technological Innovation, 2000
Figure 7 shows firms’ perception of the scale of importance of several types of innovation efforts. Clearly, the majority perceives innovation through acquisition of machinery and equipment as the most innovative activity (76.63 per cent) and through training (59.06 per cent). The first category is associated to
technologies incorporated in the machinery thus, a sign of process modernisation. The second category of innovation efforts - training – can only be considered indirectly. Although, workers competencies improve by training, not all training activities end up in innovation activities. The most important fact is that a third of the Brazilian industrial firms consider vital the engagement in internal R&D activities.
FIGURE 7
DEGREE OF IMPORTANCE OF INNOVATIVE ACTIVITIES EFFORTS, 1998/2000
Source: IBGE, Industrial Survey on Technological Innovation, 2000
Table 11 shows of what is been said. From the 72 thousands industrial firms, with total sales of R$ 582 billions in 2003, just 19 thousand spent R$22 billions on innovation expenditures, that is 3.8 per cent of total income. From this value, 2 per cent was allocated to machinery and equipment by 15 thousand firms.
In 2000, this value corresponded to R$ 11.6 billions, which is half of the innovation expenditure. As for R&D expenditure, merely 7.412 firms spend 0.64 per cent of its liquid income, R$ 3.7 billions. In these R&D activities, 31.4 thousand professionals work full time and another 32.9 thousand professionals work part-time.
TABLE 11
NET REVENUE AND EXPENDITURE IN INNOVATIVES ACTIVITIES, 2000 Expenditure in Innovative Activities
Total Internal R&D Activities Acquisition of Equipment Number of
Firms
Net Revenue (R$ 106)
(1) Number of Firms
Value (R$ 106)
Number of Firms
Value (R$ 106)
Number of Firms
Value (R$ 106) 72.005 582.406,1 19.165 22.343,8 7.412 3.741,6 15. 540 11.667,3 Source: IBGE, Industrial Survey on Technological Innovation, 2000
Even among the restrict group of firms that are engaged in innovation efforts, prevail important differences.
Table 12 clearly shows that the bigger the firm, the greater is its innovation engagement. Less than half of the firms that have R&D expenditures do it in a regular base. However, this group is responsible for 90 per
cent of national expenditure in R&D. In the same way, the bigger the firm, the bigger are its efforts in R&D, only 27.78 per cent of the small firms showed R&D expenditures against 79.88 per cent for firms with more than 500 employees.
TABLE 12
DISTRIBUITION OF NUMBER OF FIRMS AND EXPENDITURES IN PERMANERT AND EPISODIC R&D ACTIVITIES BY SIZE, 2000
Permanent R&D Activities
Episodic R&D Activities Size
(in Number of Employees) No. of Firms
% Expenditures % No. of Firms
% Expenditures %
Total 42,87 90,04 57,13 9,96
10 to 29 27,78 31,96 72,22 68,04
30 to 49 31,56 53,9 68,44 46,1
50 to 99 45,26 65,67 54,74 34,33
100 to 249 55,31 78,47 44,69 21,53
250 to 499 65,56 86,95 34,44 13,05
500 or more 79,88 96,12 20,12 3,88
Source: IBGE, Industrial Survey on Technological Innovation, 2000
The innovation efforts have been incipient and of low qualification and besides that, firms do not consider partnerships to increase their technological efforts intensity. Table 13 shows that only 11.04 per cent of the Brazilian firms co-operate with other firms. Again, the collaboration intensity increases with firm’s size:
from 7.43 per cent of firms with 10 to 29 employees to 37.80 per cent for bigger firms.
TABLE 13
SHARE OF NUMBER OF FIRMS WITH COOPERATIVE R&D EFFORTS IN THE TOTAL NUMBER OF INNIVATIVE FIRMS BY SIZE, 1998/2000
Size
(in Number of Employees) Share of Firms with Co-operative R&D Efforts (%)
Total 11,04
10 to 29 7,43
30 to 49 8,78
50 to 99 11,19
100 to 249 16,52
250 to 499 20,25
500 or more 37,80
Source: IBGE, Industrial Survey on Technological Innovation, 2000
3.3. SHIFTS IN THE PATTERNS OF COMPETITION DURING DE 90’S: SOME STYLISED FACTS
The institutional transition towards a new paradigm “lead by the market” – trade liberalisation, deregulation and privatisation - was very difficult, taking in account the low credibility of the role of government and absence or inappropriate use of the structural and systemic pre-conditions (technological and physic infra-structure, loans, etc). Probably, the most important source of uncertainty was the unknown effects of the open market regarding the potential of penetration of imported goods into the Brazilian market. The result of this uncertainty, is the loss of capacity by firms to forecast the real size for its current markets, leading to a reduction on the pre-existent microeconomic degree of confidence.
The environment structurally hostile to competitive restructuration faced additional constraints due to the recession trend experienced in the Brazilian economy that restricted the investment decisions. It is not clear the extension of the openness effects in promoting an acceleration of the investments in expansion or
industrial modernisation. However, conjoined with the recession effects we could not expect a lot from the response capacity of firms.
Looking forward, some stylised facts can be derived from the Brazilian recent institutional transition, each of them implying important changes in the patterns of competition of the local industry. There are:
• Trade liberalisation in an unstable macroeconomic environment led the Brazilian industrial sector to a regressive specialisation, that is, the adjustment was concentrated on downsizing and out- sourcing products and services.
• There was a once-for-all increase in productivity indexes instead of an increase in productivity growth. The lack of favourable structural conditions for long-run investment in R&D and output expansion led to a concentration on cost-minimising strategies and mergers and acquisitions.
• Trade liberalisation without efficient export-promoting policies resulted in structural trade deficit, which in its turn tended to intensify the foreign-exchange constraint on economic growth.
• Multinational enterprises increased their market share in industrial sectors of high technological content. As a consequence, intra-firm trade and sub-contracting increased in importance in these sectors and the degree of domestic competition decreased.
The next sections will explore this implication trough a more detailed analysis of the restructuration of some of the main branches of the Brazilian industrial structure.
4. COMMODITIES: A DUAL TRACK STRATEGY: LOW COST FOR EXPORTS, DIFFERENTIATION FOR THE LOCAL MARKET
4.1. PATTERN OF COMPETITION NOW AND THEN: WIDENING AND DEEPENING THE SEARCH FOR LOW COSTS
Commodity related industries are engaged in producing intermediate inputs to industrial or final consumption, through large-scale production processes. The reference driver for commodity-based industries is cost competition. Cost minimisation strategies mattered in 1990 and are still prevalent in 2003.
(See first two columns in Table 14) The search for and exploration minimisation drivers at company level, as well as in markets and industrial configurations was enhanced. This is most noticeable on regimes of incentives and regulations of developed nations, where markets were defended for local firms by means of explicit protectionist measures.
Since commodity products are intrinsically undifferentiated, competitive firms sustain and expand access to all sources of low unit costs and high production volume. Production efficiency and economies of scale are still ensured by three different but complementary sources: high capital intensive plants, preferential access to inputs –raw materials and energy sources- and transport logistics. In such a context, large, multi- plant, companies, operating internationally are capable of expanding the frontiers of low cost. During the last decade, simultaneously with similar operations in other sectors, more aggressive firms have deepened up their leadership positions, becoming larger and more internationalised by means of mergers and acquisitions transactions.
At the level of the firm, core competences are still related to four sources of competitive advantages:
knowledge to effectively manage, acquire or access process technology, inputs, transportation, product distribution networks and preferential clients. The diffusion of information systems based on microelectronics technologies has provided the technical base for co-ordinating large-scale operations and logistics.
The pattern of competition among firms has remained closely associated with homogenous oligopoly;
firms have knowledge on market perspectives and the behaviour of competing firms on a global basis.
Thus, for competitive success, it is of fundamental importance to anticipate demand growth or to effectively respond to changes in price and quantity demanded from local and international markets.
Aggressive firms are those implementing two types of investment strategies –through green field but preferably M&A operations: expanding capacity ahead of demand growth of current products and virtualisation. Virtualisation expands the frontiers of cost minimisation, through economies of scale, and provides complementary sources of revenue. Revenue possibilities have expanded significantly in the past 10 years, by means of widening product portfolio (product grading in petrochemicals), exploring transportation assets for third parties or selling-off energy surplus.
The preferential access to capital markets is of vital importance for the competitiveness of investment- driven strategies. On this matter, large and internationalised companies have considerable advantages over firms operating single plants or in a limited number of national markets.
International competition in a context of liberalised national economies has strengthened a particular and historical trend: although prices of most commodities fluctuate along world economic cycles, relative prices have showed a declining trend, imposing problematic terms of trade for commodity dependent exporting nations.