53
Copyright@SPSD Press from 2010, SPSD Press, Kanazawa
3D Laser Scanning Technology-based Historic Building Mapping for Historic Preservation
A Case Study of Shang Shu Di in Fujian Province, China
Yuanyi Zhang
1,2, Ying Zhang
1*, Zhenjiang Shen
2*Tatsuya Nishino
2and Xiaojuan Chen
11 School of Architecture, Fuzhou University
2 School of Environmental Design, Kanazawa University
* Corresponding Authors, Email: [email protected];[email protected] Received 14 March, 2014; Accepted 27 September, 2014
Keywords: Historic preservation, Sustainable urban development, 3D laser scanning technology, Mapping, Historic building, Database
Abstract: Historic preservation, adaptive reuse, and sustainable urban design that considers the full range of social, environmental, and economic factors is an essential component of sustainable urban development, while the mapping of historic buildings which can be archived and extracted for application, is the basic work on the protection of historic buildings and adaptive reuse.
Traditional mapping methods need more time and more workers, and there are measured omissions, mistakes and other issues which go against the protection of the measured objects. 3D laser scanning technology is a new technique for quickly getting three-dimensional information. This paper introduced a measurement principle for 3D laser scanning technology and took Shang Shu Di, a Ming Dynasty building which is an officially protected heritage site of China in Taining County of Fujian Province, as a case study, and studied the application of mapping historic buildings based on 3D laser scanning technology. Then, a comparison of 3D laser scanning technology with the traditional method of detailed components mapping has been illustrated to indicate the advantage of 3D laser scanning technology in historic building mapping. Finally, aimed at the technical problems of the huge amount of data generated in the application process and the software defects of Cyclone, this paper presented two specific coping strategies which are “reasonable data collection and processing” and “construction of historic building components database”.
1. INTRODUCTION
As stated by Boquet (2014), sustainable development has become a
buzzword for many sets of policies at various spatial levels. Many planning
concepts such as ‘new urbanism’ and ‘compact city’ are all claiming to
promote the development of sustainability (Wang, 2014). Historic
preservation, adaptive reuse, and sustainable urban design that considers the
full range of social, environmental, and economic factors is an essential
component of sustainable urban development (Lewin et al., 2013). A
growing number of developers, preservationists and design professionals are
demonstrating that historic preservation and sustainable development are a
natural alliance (Hammersmith Group, 2008). Mapping of historic buildings
which can be archived and extracted for application is the basic work on the
preservation of historic buildings and adaptive reuse. The traditional tools for mapping the historic buildings are ruler, tape measures, benchmarks and so on. Interpretation of records is done by the human eyes and most of the measuring is of “a part taken from the whole”, that is, a small component is deduced from the whole and the mapping is based on assumptions of similarity (Zang, 2006). Such mapping results in a considerable extent being dependent on personal experience and temporary judgement, which cannot accurately depict specific components, especially in shaped and complex components with detailed spatial characteristics. Such results have many problems in terms of completeness and accuracy. Compared with traditional surveying methods, laser scanning technology has particular superiority as follows (Cheng and Jin, 2006):
• is a sort of untouched measure system;
• gains the 3D coordinates, reflecting intensity etc. on object surface;
• rapidity of data acquisition, great quantity of data and high accuracy;
• works in all kinds of environments;
• extensive application.
As a new technique for quickly getting three-dimensional information, 3D laser scanning technology has been widely used in many fields; for example, Jia-Chong et al. (2007) used 3D laser scanning and a global positioning system (GPS) to acquire landslide data and to compute earthwork volume. Lin et al. (2010) used a 3D laser scanner to obtain precise measurements from experimental lithic reduction sets. Armesto-González et al. (2010) presented a methodology to combine the technology of the terrestrial laser scanner with the techniques of digital image processing to study damage on stony materials that constitute historical buildings.
Kuzminsky et al. (2012) provided a simple and straightforward overview of using 3D scanning methods to preserve and document osteological material in museums, develop research ideas in the subfields of biological anthropology, and increase the potential for scholarly collaboration.
Holopainen et al. (2013) used airborne (ALS), terrestrial (TLS) and mobile laser-scanning (MLS) methods in urban tree mapping and monitoring. Chen et al. (2013) proposed a method that combines SAR data with a cloud of point data (data point cloud) obtained by 3D laser scanning to improve the gradient of deformation detection. Mahdjoubi et al. (2013) established the case and rationale for the adoption of BIM and laser scanning technologies in the real-estate services sector.
This paper will take Shang Shu Di, a Ming Dynasty building which is an officially protected heritage site of China in Taining County of Fujian Province, as a case study, and study the application of mapping in historic buildings based on 3D laser scanning technology. Then the paper will verify the advantages of 3D laser scanning technology in historic building mapping through a comparison of 3D laser scanning technology with traditional methods in detailed components mapping. Finally, specific coping strategies for the huge amount of data generated in the process of the application of 3D laser scanning technology will be studied and presented.
2. MEASUREMENT PRINCIPLE OF 3D LASER SCANNING TECHNOLOGY
The 3D laser scanner targets physical objects to be scanned and the laser
beam is directed over the object in a closely spaced grid of points. First, the
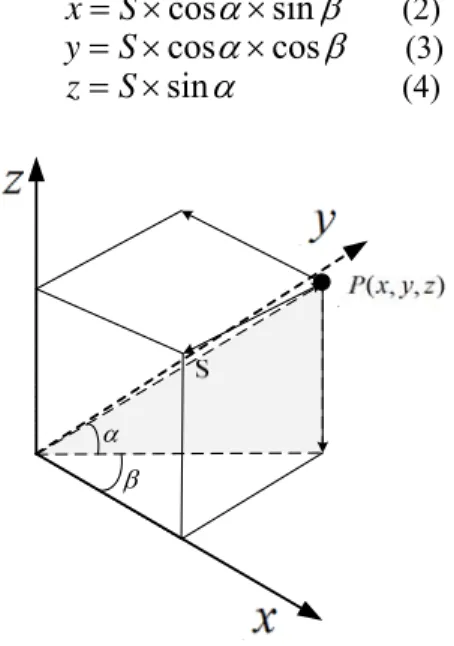
scanner emits a laser flight to the surface of the physical object for each measuring point P ( x , y , z ) , then the laser flight will reflect back to the scanner, so the 3D laser scanner will measure the time of laser flight, which is the time of travel of the laser from the scanner to the physical object and back to the scanner. Since the speed of light is: c 3 10
8m / s , thus the scanner can calculate the distance S , which is from the surface of the physical object to the 3D laser scanner:
t c S
2
1 (1)
Suppose is the angle between the laser flight and the vertical direction, and is the angle between the laser flight and the horizontal direction, as illustrated in Figure 1. Thus, the 3D spatial coordinates of
) , , ( x y z
P are:
sin cos
S
x (2)
cos cos
S
y (3)
sin
S
z (4)
Figure 1. Coordinate calculation of measuring point
P ( x , y , z )
The result is a “cloud of points”, or data point cloud, which consists of thousands of points in a 3-dimensional space that are a dimensionally accurate representation of the existing object (Arayici, 2007).
3. APPLICATION OF 3D LASER SCANNING TECHNOLOGY IN HISTORIC BUILDING MAPPING
3D laser scanning technology, which is used in the mapping of irregular and complex buildings, can effectively improve the deficiency of traditional mapping methods (Boulaassal et al., 2009; Cardaci et al., 2011; Hudson et al., 2012). In this paper, the 3D laser scanner “Scanstation C10”, which was produced by Leica Company, was used in the mapping of Shang Shu Di.
The scanner has many merits, such as high accuracy, works in all kinds of
environments, is multidimensional, has easy operation and so on, so it has
the strong superiority of being able to rapidly obtain 3D data and create a 3D
model (Fan et al., 2012). The application of 3D laser scanning technology in
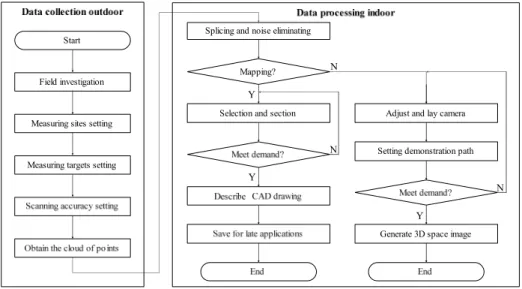
historic building mapping is mainly composed of data collection outdoors
and data processing indoors. Figure 2, below, illustrates the flow chart of 3D laser scanning technology used in historic building mapping.
Y N
N
N Splicing and noise eliminating
Selection and section Mapping?
Y
Y Field investigation
Measuring sites setting
Measuring targets setting Start
Adjust and lay camera
Setting demonstration path
Generate 3D space image
Figure 2. The flow chart of 3D laser scanning technology used in historic building mapping
3.1 Data collection outdoors
Data collection outdoors mainly includes field investigation, setting of measuring sites, targets and scanning accuracy, and obtaining the cloud of data points. For most historic buildings, they have larger and more complex angles, so to avoid excluding sections due to an excess of cloud points, it is reasonable to set multiple measuring sites and measurement targets through multi-station, multi-directional scanning.
Figure 3 illustrates 16 measuring sites and 8 measuring targets which have been set in this mapping of the historic building. In order to have multiple stations scanning different coordinates of points within the cloud together into the same coordinate system, and to obtain the complete surface information of the object shape, a reasonable target arrangement is particularly important. The basic methods or principles are: Firstly, three targets, which are not in the same straight line, should be placed between every two stations. Secondly, the position of the measurement target should follow the principle of "Service for the next station", which means setting the target in a coordinated location where it can be scanned as much as possible by multiple scanners in order to reduce the number of targets and any resulting error of points in clouds during multiple site splicing processing. Thirdly, setting up should avoid omitting set targets.
Scanning accuracy settings directly affect the final results of the mapping
of historic buildings, thus for group buildings’ positioning measurement, and
a single-building’s integral measurement, medium or low-resolution
scanning is commonly used. However, for specific detail components of
historic buildings, such as specific plaques, fonts or painting patterns, which
require scanning of detailed components, high or ultra-high resolution
scanning is used. Adjustments for degrees of exposure must be made
according to the environment and weather conditions. The degree of
exposure needs to be increased when the data point cloud occurs in a dark
area, or decreased in a bright area.
Figure 3. The measuring sites and measuring targets
3.2 Data processing indoors
Data processing indoors mainly includes splicing and noise eliminating for the data point cloud selection and section, the generation of CAD graphics, the generation of 3D space image, data storage and extraction for use. Splicing primarily used the method of “group positioning system”, to position single-buildings and the detail components into the historic building’s settlement group, namely multiple stations’ point clouds, were spliced into the same coordinate system in order to obtain the target entity’s complete spatial data. Noise elimination is conducted to remove the invalid data points, reducing the overhead of computer data processing, and to improve the ability of computer data processing. The noise of this mapping of historic buildings is relatively obvious, so this paper used naked eye judgment to segment the cloud of points, then delete directly by a human- computer method to eliminate the noise.
Due to the impact of the scanning mode to obtain the cloud of points, and
the initialization of the instrument, the cloud model that has been acquired
has no accurate coordinate axis. Therefore, it is necessary to determine the
coordinates using Cyclone software first, to unify the cloud of points, and to
optimize the cloud model, then to put the cloud model into AutoCAD to
slice the plane, vertical face and profile using the Cloudworx plugin. Finally,
the plane drawing, vertical face drawing and profile drawing is described
according to the section feature and cloud of points in AutoCAD. Figures 4,
5 and 6 illustrate the drawing of the section from the cloud of points.
Figure 4. The drawing of the entrance plane section from the cloud of points
Figure 5. The drawing of the entrance vertical face section from the cloud of points
Figure 6. The drawing of the entrance profile section from the cloud of points
Figures 7, 8 and 9 illustrate the plane drawing, vertical face drawing and profile drawing of the entrance utilizing the hidden data points.
In order to express the 3D virtual reality of Shang Shu Di more
intuitively, the authors constructed a 3D video to show the results of the
mapping and a live-action 3D image. This was enabled by fitting the data point cloud and the images captured from the built-in camera, and setting the demonstration path. Figure 10 illustrates the 3D space image of Shang Shu Di.
Figure 7. The plane drawing of the entrance
Figure 8. The vertical face drawing of the entrance
Figure 9. The profile drawing of the entrance
Figure 10. 3D space image of Shang Shu Di
4. COMPARISON OF 3D LASER SCANNING
TECHNOLOGY WITH TRADITIONAL METHOD IN DETAILED COMPONENTS MAPPING
The detailed components of historic buildings and their decoration are important contents in historic building mapping. The traditional method is to orthographically shoot the various parts of the components and decorations of historic buildings, and to record their sizes by manually mapping them.
Researchers are required to climb scaffolding, prostrate or squat, and there are measured omissions, mistakes and other issues to be taken into consideration. The application of 3D laser scanning technology can overcome these disadvantages of the traditional method.
To begin with, focus can be placed on the detailed components that need to be mapped, using an appropriate resolution to scan and collect data. In order to decrease the volume of the data point cloud, it is necessary to adjust the vision angle according to the physical objects which need mapping, then to use a “partial selection method” to extract the desired cloud of points accurately. Figure 11 illustrates the extracted data points of the Dougong beams above the Gold Pillar.
Figure 11. Extracted data points of the Dougong beams above Gold Pillar
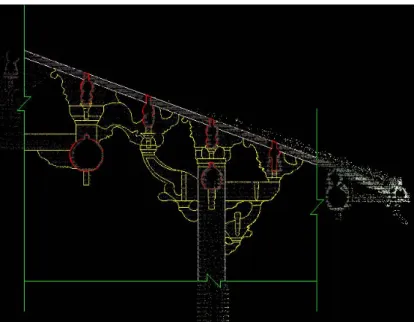
Secondly, the data points are unified to reduce their density, then imported into AutoCAD to slice their profile using the Cloudworx plugin, the profile drawing is then described according to the section feature and data point cloud in AutoCAD. Figure 12 illustrates the drawing of the Dougong beams above the Gold Pillar using the cloud of points.
Figure 12. The drawing of the Dougong beams above the Gold Pillar using the cloud of points
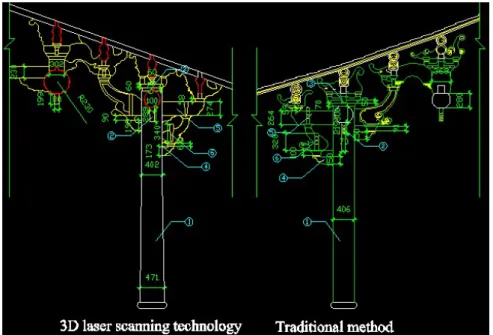
Finally, the hidden data points were used to obtain the profile drawing of the Dougong beams above the Gold Pillar, as Figure 13 illustrates. The accuracy of the mapping drawing has improved significantly compared with the original manual mapping drawing. Figure 14 and Table 1 illustrate the mapping results of the 3D laser scanning technology compared with the traditional method.
Figure 13. The profile drawing of the Dougong beams above the Gold Pillar
Figure 14. Comparison of mapping results of 3D laser scanning technology and traditional method using the same key points
Table 1. Comparison results of the two methods corresponding to Figure 14 Key points. Traditional
mapping method
3D laser scanning technology
The comparison results (The problems of the traditional method)
①The diameters of the Gold Pillar
The same diameters from top to bottom, 406mm
Small top and big bottom, the diameter is 471mm at 300mm, and 406mm at 2400mm from the bottom.
The traditional method often misunderstands the diameter of the Gold Pillar. So there are measurement omissions.
②The high- aspect ratio of intermediate Dougong.
Width is 70mm and height is 219mm. So the ratio is 3.13.
Width is 100mm and height is 289mm. So the ratio is 2.89.
The ratio of the traditional method is higher than the 3D laser scanning technology, so there is a measurement error.
③Tablet Square Absent Present There are measurement
mistakes or omissions.
④Trunk Gong 150mm 173mm There is a measurement
error.
⑤Er Pi Gong 264 mm 274 mm There is a measurement error.
⑥Hua Ya Zi 328 mm 340 mm There is a measurement
error.
5. SPECIFIC COPING STRATEGIES FOR THE HUGE AMOUNT OF DATA
Due to the sizes of historic buildings, the complexity of detailed
components, the number of sites and the accuracy of scanning, a huge
amount of data will be generated in the process of the application of 3D laser
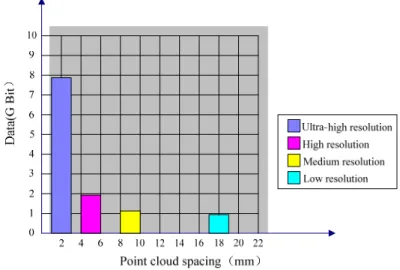
scanning technology. Figure 15 illustrates the spacing and data of one site’s
data point cloud at different scanning resolutions. When the scanning
resolution is fine, ultra-high, the amount of data from panorama scanning
reaches 7.78Gigabytes. This affects not only the processing speed of the computer, but also the post-data processing, CAD graphics conversion and the efficiency of data extraction. Therefore, reasonable data collection and processing, as well as the construction of a historic building components database are two important strategies to solve problems due to there being a huge amount of data.
Figure 15. The spacing and data of one site’s data point cloud at different scanning resolutions
5.1 Reasonable data collection and processing
Reasonable data collection and processing needs to be done in two stages: First, setting a reasonable scanning accuracy and vision angle when in the data collection stage. Second, noise elimination and saving the data as
*.Ptx or *.Pts format files in the data processing stage. The scanning accuracy and vision angle should be set according to the mapping of different objects, as shown in Table 2.
Table 2. Scanning accuracy and vision angle in different mapping objects
Mapping
objects Scanning accuracy Scanning vision angle
The distances between two clouds of points within 100 meters.
Data size
Group
buildings Low resolution panoramic
scanning 20mm 0.98GB
Single-
building Medium resolution panoramic
scanning 10mm 1.16GB
Detailed components (such as Dougong, beams, windows, doors.)
High resolution partial scanning 5mm
1.99GB of panoramic scanning.
Graphic
patterns Ultra-high resolution partial scanning 2mm
7.78GB of panoramic scanning.
Noise generally comes from two sources: one is the passing vehicles or pedestrians while the 3D laser scanner was in operation. Figure 16 illustrates the noise caused by the passing vehicles or pedestrians; Another is some invalid data point clouds, for example, some modern buildings appear that are adjacent to the historic buildings, or there are some debris of the historic buildings, etc. The invalid data not only affects the accuracy of mapping, but also takes up storage and system resources, as well as affecting the ability of computer data processing. Therefore, for the obvious noise, just using the
"Fence Mode" marquee method is sufficient, while for complex noise, it is necessary to separate the noise area from the cloud of points, then combine with the "Fence Mode" marquee method to eliminate the noises. Figure 17 illustrates the cloud of points after noise elimination.
Figure 16. Noise caused by the passing vehicles or pedestrians
Figure 17. The cloud of points after noise elimination
The data saved for later use is very important since the data can be extracted for later use after finishing the noise elimination, so it is necessary to export the data point cloud as *.Ptx or *.Pts format files for saving as stored resources. In this project, the scanning area of Shang Shu Di was about 900m
2, there were 16 measuring sites and 8 measurement targets set, the scanning accuracy was medium resolution, and the actual volume of data generated was 18.6GB. After eliminated noises were exported and the data were saved as *.Ptx or *.Pts format files, there was only 8.72GB of data.
Therefore, it greatly reduced the size of the data point cloud and saved 53.12% of storage space.
5.2 Construction of historic building components database
The data point cloud collected by a 3D laser scanner has the feature of
"measurement one time, permanent use". So the establishment of a 3D data information table would assist the effective management of historic building components. Users can call and view building component parameter information and eventually establish a historic building components database.
Nowadays, noise-only elimination can be carried out after splicing in Cyclone 7.3 software. Therefore, our research team gained the experience of splicing, noise elimination, reducing data volume, and the generation of CAD graphics using AutoCAD software, and presented a specific coping strategy which is “packet processing, integrated splice” (Zhang et al., 2014).
For multiple stations, it is necessary to group, firstly, one group composed of several stations, and then each group spliced and with noise eliminated, then put the data point cloud model into AutoCAD to slice and describe the CAD drawing. Finally, a 3D data information table of historic building components is established through the insert or external redeployment feature of AutoCAD. Table 3 illustrates the 3D data information table of the pillars from Shang Shu Di.
Table 3. 3D data information table of pillars
ID Code Type Diameter
of pillar bottom
Diameter of pillar top
Height of pillar diameter
width of pillar diameter
PFX1Y1Z1 PF Round 471mm 406mm No No
PFX2Y2Z2 PF Square No No 303mm 301mm
PFX3Y3Z3 PF Round 477mm 398mm No No
According to the actual needs, there are many properties involved in the database, including not only the property of spatial data, such as floor area, material, location, size and social history, etc., but also attribute information, such as literature information, historical and cultural information. Table 4 illustrates the database structure for a single building. Finally, a building components database with perfect classification and easy extraction would be established through data processing indoors, which can achieve the multidimensional use of the mapped data.
Table 4. The database structure for a single building
Character Type Length Name
Leb Float 80 Length of building
Wib Float 80 Width of building
Hed Float 80 Height of door
Wid Float 80 Width of door
Lay Int 5 Layers
Buit Datatime Build time
Ima Image Image information
Rem Text 20 Remarks
6. CONCLUSION
Historic buildings have embedded potential for sustainability. They often use comparatively low energy and durable materials, and historic neighbourhoods are often characterized by density, short distances and mixed use, which make them a relatively efficient model of sustainable development. Furthermore, demolishing or replacing these buildings would require a major reinvestment of energy and resources. Therefore, the retention, rehabilitation and reuse of historic buildings can play a pivotal role in the sustainable development of the city.
Historic building mapping is a basic work to protect, explore, organize and utilize ancient, outstanding architectural heritage. Meanwhile, it not only provides important basic data for the research of architectural history and theory and architectural history teaching, but also provides a reference for succeeding and developing traditional building culture and exploring modern architectural creation (Wang, 2006). The traditional mapping method is simple and intuitive, however, it needs more time and more workers, and there are measurement omissions, mistakes and other issues. The results cannot accurately depict specific components, especially in shaped and complex components and their detailed spatial characteristics. The application of 3D laser scanning technology can overcome the disadvantages of the traditional mapping method, such as accuracy, 3D virtual characteristics, the integrity of the data collected and so on.
In the actual application process, 3D laser scanning technology still has existed issues that need further exploration and solutions: First, as a huge amount of data came from the data point cloud and the colour images, how to fit the cloud with the colour images should be explored further to reduce the amount of data through software technology pathways. Second, more time and more workers are required to change the data point cloud into CAD graphics. Software technology capable of automatic recognition and generation needs further development and improvement. Finally, the automatic data processing techniques of noise elimination and site picture stitching need to improve.
In addition, 3D laser scanning is becoming a standard technology for the 3D modelling of complex scenes. Laser scans contain detailed geometric information, but still require interpretation of the data for making it useable for mapping purposes. With the development of integrated software development technology, 3D laser scanning technology and building information modelling (BIM) technologies will offer new possibilities for capturing, mapping and the analysis of building information in the future.
ACKNOWLEDGEMENTS
This work is supported by the 2012 National Science and Technology
Support Program of China (No.2012BAJ14B05), the National Natural
Science Foundation of China (No.51278123), the education scientific research project of young teachers in Fujian Province (No.JA13048), and the National Scholarship of China (No.201308350110).
REFERENCES
Arayici, Y. (2007). “An approach for real world data modelling with the 3D terrestrial laser scanner for built environment”, Automation in Construction, 16(2007), 816-829.
Armesto-González, J., Riveiro-Rodríguez, B., et al. (2010). “Terrestrial laser scanning intensity data applied to damage detection for historical buildings”, Journal of Archaeological Science, 37(2010), 3037-3047.
Boquet, Y. (2014). “Transportation and Sustainable Development in a Mid-Size French City, Dijon”, International Review for Spatial Planning and Sustainable Development, 2(2), 52- 63.
Boulaassal, H., Landes, T., et al. (2009). "Automatic extraction of planar clusters and their contours on building facades recorded by terrestrial laser scanner", International Journal of Architectural Computing, 7(1), 1-20.
Cardaci, A., Mirabella Roberti, G., et al. (2011). “From the continues to the discrete model: a laser scanning application to conservation projects”, Proceedings of the International Archives of the Photogrammetry, Remote Sensing and Spatial Information Sciences, Trento, Italy, 2–4 March 2011; 38, 437-444.
Chen, B., Deng, K., et al. (2013). “Large-scale deformation monitoring in mining area by D- InSAR and 3D laser scanning technology integration”, International Journal of Mining Science and Technology, 23(2013), 555-561.
Cheng, X.J. and Jin, W. (2006). “Study on reverse engineering of historical architecture based on 3d laser scanner”, Journal of Physics Conference Series, 48(1), 843-849.
Fan, Y., Dong, J., et al. (2012). “Discussion on 3D laser scanning technology and the comprehensive application of related software”, Surveying and Mapping of Geology and Mineral Resources, 28 (3), 21-23. (In Chinese)
Hammersmith Group. (2008). “Historic preservation and sustainable development”, The Hammersmith Group Research Report.
Holopainen, M., Kankare, V., et al. (2013). “Tree mapping using airborne, terrestrial and mobile laser scanning–A case study in a heterogeneous urban forest”, Urban Forestry&Urban Greening, 12(2013) 546-553.
Hudson, M. (2012). "Laser scanning enables Titanic Light Show", Geomatics World, July/August (2012), 20-21.
Jia-Chong, D. and Hung-Chao, T. (2007). “3D laser scanning and GPS technology for landslide earthwork volume estimation”, Automation in Construction, 16(2007), 657-663.
Kuzminsky, S.C. and Gardiner, M.S. (2012). “Three-dimensional laser scanning: potential uses for museum conservation and scientific research”, Journal of Archaeological Science, 39 (2012), 2744-2751.
Lewin, S.S. and Goodman, C. (2013). “Transformative renewal and urban sustainability”, Journal of Green Building, 8(4), 17-38.
Lin, S.C.H., Douglass, M.J., et al. (2010). “The application of 3D laser scanning technology to the assessment of ordinal and mechanical cortex quantification in lithic analysis”, Journal of Archaeological Science, 37(2010), 694-702.
Mahdjoubi, L., Moobela, C., et al. (2013). “Providing real-estate services through the integration of 3D laser scanning and building information modelling”, Computers in Industry, 64 (2013), 1272-1281.
Wang, Q. 2006. “Historic building mapping”, China Architecture & Building Press, Beijing.
(In Chinese)
Wang Y. (2014) “The Framework of Social Sustainability for Chinese Communities:
Revelation from Western Experiences”, International Review for Spatial Planning and Sustainable Development, 2(3), 4-17.
Zang, C. (2006). “Application of the 3D laser scanning techniques to the study of cultural relics conservation”, Architectural Journal, 24 (12), 54 -56. (In Chinese)
Zhang, Y., Zhang, Y., et al. (2014). “Research on application of 3D laser scanner in ancient architecture mapping”, Experimental Technology and Management, 31(1), 79-82. (In Chinese)