1
Title: Side population cell fractions from hepatocellular carcinoma cell lines increased with tumor dedifferentiation, but lack characteristic features of cancer stem cells
Masamichi Nakayama1)2), Sachiko Ogasawara1), Jun Akiba1), Kousuke Ueda1), Keiko Koura1)2), Keita Todoroki1), Hisafumi Kinoshita2), Hirohisa Yano1)
1) Department of Pathology, Kurume University School of Medicine, Kurume, Japan 2) Department of Surgery, Kurume University School of Medicine, Kurume, Japan
Corresponding author: Jun Akiba
Address: Department of Pathology, Kurume University School of Medicine, 67 Asahimachi, Kurume 830-0011, JAPAN
Tel: +81-942-31-7546 Fax: +81-942-32-0905
E-mail: [email protected]
2 Abstract
Background and Aim: Cancer stem cells (CSCs), a minority population with stem cell-like characteristics, play important roles in cancer development and progression.
Putative CSC markers, such as CD13, CD90, CD133, and EpCAM, and side population (SP) technique are generally used in an attempt to isolate CSCs. We aimed to clarify the relationship between CSCs and clonal dedifferentiation in hepatocellular carcinoma (HCC).
Methods: We used a well-differentiated HCC cell line (HAK-1A) and a poorly differentiated HCC cell line (HAK-1B) established from a single nodule with histological heterogeneity. HAK-1B arose due to clonal dedifferentiation of HAK-1A. The SP cells and non-SP (NSP) cells were isolated from the two cell lines with a FACSAria II and used for the analyses.
Results: The SP cell fractions in HAK-1A and HAK-1B were 0.2% and 0.9%, respectively. CD90 or EpCAM was not expressed in either HAK-1A or HAK-1B, while CD13 and CD133 were expressed in HAK-1B alone. Although sphere forming ability, tumorigenicity, growth rate, and CD13 expression were higher in HAK-1B SP cells than HAK-1B NSP cells, there were no differences in drug resistance, colony forming ability, or cell cycle rates between HAK-1B SP and NSP cells, suggesting HAK-1B SP cells do not fulfill CSC criteria.
Conclusions: Our findings suggested a possible relationship between the expression of CSC markers and clonal dedifferentiation. However, the complete features of CSC could not be identified in SP cells, and the concept of SP cells as a universal marker for CSC may not apply to HAK-1A and HAK-1B.
Keywords: cancer stem cells, side population cells, dedifferentiation
3 Introduction
Cancer stem cells (CSCs) are defined by self-renewing capacity, differentiation capacity, and tumor-initiating capacity. Additionally, the seeding of metastasis and tumor relapse are attributed to CSCs [1-3]. To date, the existence of CSCs has been proven not only in hematopoietic neoplasms [4, 5], but also various solid neoplasms [6-11].
Side population (SP) cell sorting was initially applied for the identification of
hematopoietic stem cells and has been used to enrich stem cell compartments in diverse tissues and organs [12-14]. SP cells are detected by their ability to efflux Hoechst 33342 dye through ATP-binding cassette (ABC) membrane transporters. Recently, SP cells have also been used in an attempt to isolate a stem cell–like fraction in cancer cells [15-17]. The approach seems valuable because a variety of cancers, including HCC, highly express ABC transporters, which are reported to contribute to multi-drug resistance [18].
A variety of markers have been successfully used to enrich CSC fractions from different tumors including HCC [19]. Although no markers for putative liver CSCs have been generally accepted, CD133, CD90, epithelial cell adhesion molecule (EpCAM) and CD13 are thought to be candidates for liver CSC markers [20-24].
Recent evidence suggests that CSCs, a minority population with stem-cell-like characteristics, play important roles in cancer development and progression [25].
In this study, we isolated the SP and non-SP (NSP) cells from two HCC cell lines, a well-differentiated human HCC cell line (HAK-1A) and a poorly differentiated HCC cell line (HAK-1B) which were established from a single nodule with a three-layered structure having different histologic features [26], and compared the relationship between CSCs and clonal dedifferentiation.
Materials and methods Cell lines and cell culture
4
This study used two human HCC cell lines: HAK-1A, HAK-1B, which were both established from a single HCC nodule showing a three-layered structure with a different histological grade in each layer [26]. HAK-1A resembles well-differentiated HCC cells in the outer layer of the original tumor, and HAK-1B resembles poorly differentiated cells in the inner layer. The presence of an identical point mutation in the p53 gene in the two cell lines suggests that they are of clonal origin. The cell culture condition is described elsewhere [26].
SP cell analysis using flow cytometry
We followed the protocol previously reported by Goodell et al. [13], with minor modifications. Briefly, cells were detached from the culture dish with Accutase
(Innovative Cell Technologies, Inc., San Diego, CA, USA). The cells were incubated at 37 °C for 60 minutes with Hoechst 33342 (SIGMA-Aldrich, Saint Louis, MO, USA). The control cells were incubated in the presence of 15 μg Reserpine (SIGMA-Aldrich). After staining, the cells were suspended in PBS with 2% FBS, filtered through a 40 μm cell strainer (BD Biosciences, San Jose, CA, USA). Cells were counterstained with 0.5 µg/mL propidium iodide (PI, BD Biosciences) for the discrimination of dead cells. Viable cells were analyzed and isolated by a FACSAria II (BD Biosciences).
Immunofluorescence flow cytometric analysis of SP and NSP cells
We analyzed SP and NSP cells isolated from HAK-1A and HAK-1B for expression of the putative stem cell markers CD133, CD90, EpCAM and CD13. Cells were first stained with Hoechst 33342. Excess dye was removed by resuspending 1×10⁶ cells/mL in PBS with 2% FBS. Cells were incubated in the dark at 4 °C for 30 minutes with
fluorescence-conjugated monoclonal antibodies, including allophycocyanin (APC) -conjugated mouse anti human CD133/2 (293C3) antibodies (Miltenyi Biotec,
Bergisch-Gladbach, Germany), fluorescein isothiocyanate (FITC) -conjugated mouse
5
anti human CD90, phycoerythrin (PE) -conjugated mouse anti human EpCAM and Purified Mouse Anti-Human CD13 (BD Biosciences). After 30 minutes, cells with Purified Mouse Anti-Human CD13 were also incubated in the dark at 4 °C for 30 minutes with Goat Anti-Mouse Ig FITC (BD Biosciences). Cells were counterstained with 0.5 µg/mL PI for the discrimination of dead cells. The data were analyzed using a FACSAria II.
Generation of SP and NSP cells by SP or NSP cells
A total of 1 x 10⁵ sorted SP cells or NSP cells from HAK-1A and HAK-1B were cultured for 1 week, and used for SP cell analysis, as described above, to examine whether SP or NSP cells generate SP and NSP cells.
Proliferation of HAK-1B SP and NSP cells
The proliferative ability of the cells from each subpopulation, including HAK-1B SP and NSP cells was examined using colorimetric assays with 3-(4,
5-dimethylthiazol-2yl-yl-)-2, 5-dimethyl tetrazolium bromide (MTT) cell growth assay kits (Chemicon, Temecula, CA, USA), as described elsewhere [27]. SP and NSP cells (1500 cells/well) were seeded on 96-well plates (Falcon, Becton Dickinson Labware, Tokyo, Japan) by a FACS Aria II. After culture for 24 h, 48 h, 72 h, 96 h, or 120 h, the number of viable cells was examined.
Effects of CDDP, 5-FU, and PEG-IFN-α2b on the proliferation of HAK-1B SP and NSP cells
Effects of Cisplatin (CDDP) (Nihonkayaku, Tokyo, Japan), 5-fluorouracil (5-FU) (Kyowa Hakko, Tokyo, Japan) and pegylated IFN-α2b (PEG-IFN-α2b) (Schering-Plough K.K., Osaka, Japan) on cell proliferation were examined by MTT assay. SP and NSP cells (1,500 cells/well) were seeded on 96-well plates, cultured for 24 h, and then the culture
6
medium was replaced with a new medium containing CDDP alone (0, 0.125, 0.25 or 0.5 μg/mL); 5-FU alone (0, 0.75, 1.5 or 3 μM); or PEG-IFN-α2b (0, 500, 1,000 or 2,000 IU/mL). After culturing for 48 h or 96 h, the number of viable cells was examined by MTT assay.
Drug treatment assay of SP and NSP cells in HAK-1A and HAK-1B
HAK-1A and HAK-1B cells were cultured with medium alone (Control) or medium containing 5-FU (1.5 µM) or PEG-IFN-α2b (1,000 IU/mL) and cultured for 96 hours, and SP cell analysis, as described above, was performed to estimate the effect of drugs on SP cell fraction.
Cell cycle analysis of HAK-1B SP and NSP cells
Cultured HAK-1B cells were labeled with 10mM bromodeoxyuridine (BrdU) (Sigma Chemical Co., St. Louis, MO) for 30 min, harvested, and used for the isolation of SP and NSP by a FACSAria II. Isolated SP or NSP cells were used for cell cycle analysis
according to the technique described elsewhere [28]. The percentage of the cells in the G1, S or G2/M phase was calculated from a dot plot.
Colony formation assay of HAK-1B SP and NSP cells
Colony formation assay was performed almost according to a modified previously described method [29]. The number of colonies > 0.5 mm in diameter was counted 14 days later.
Sphere formation assay of HAK-1B SP and NSP cells
We performed sphere formation assay according to a previously described method [29].
Tumorigenicity assay of HAK-1B SP and NSP cells in vivo
7
Various numbers of cells (1, 5, 10, 50, or 100 x 103) were injected subcutaneously into 4-week-old female NOD/SCID mice (n=5 in each group). Tumorigenic capacity was judged 8 weeks after injection. All procedures were approved by the Ethics Review Committee for Animal Experimentation of Kurume University School of Medicine.
Gene expression microarrays of SP and NSP cells isolated from HAK-1A and HAK-1B The cRNA was amplified, labeled, and hybridized to a 44K Agilent 60-mer
oligomicroarray according to the manufacturer's instructions. All hybridized microarray slides were scanned by an Agilent scanner. Relative hybridization intensities and
background hybridization values were calculated using Agilent Feature Extraction Software (9.5.1.1).
Quantitative real-time reverse transcriptase-polymerase chain reaction (qRT-PCR) of SP and NSP cells isolated from HAK-1A and HAK-1B
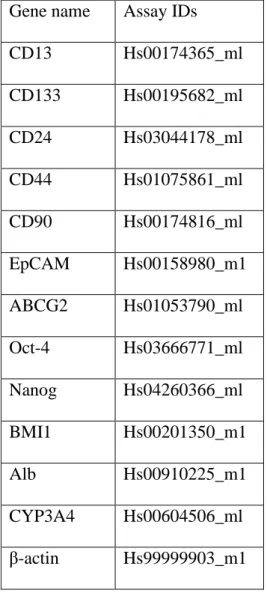
Total RNA was extracted using RNeasy Plus Micro Kit (Qiagen, Valencia, CA, USA) and complementary DNA (cDNA) was synthesized using Reverse Transcription System (Promega, Madison, WI, USA) according to the manufacturer’s instructions. qRT-PCR was carried out with TaqMan technology using ABI PRISM 7500 (Applied Biosystems, Foster City, CA, USA) followed by a previously published method [29]. Gene expression assays primer and probe mixes were used for CD13, CD133, CD24, CD44, CD90, EpCAM, ABCG2, Oct-4, Nanog, BMI1, Alb, CYP3A4 and β-actin (assay IDs are listed in Table 1; Applied Biosystems).
Statistical analysis
Comparison of colorimetric cell growth, drug resistance, colony forming ability and sphere forming ability were performed using Student’s t-test. Differences were considered significant at P<0.05.
8 Results
1. Identification of SP and NSP cells in HAK-1A and HAK-1B and expression of CSC markers
The SP cell fraction in HAK-1A was very low at only 0.2%. Expression of the putative CSC markers, such as CD133, CD90, EpCAM, CD13, was almost completely absent in both SP and NSP cells from HAK-1A (Fig. 1a). The SP fraction in HAK-1B was 0.9%.
Moreover, while CD90 and EpCAM expression was absent in HAK-1B SP and NSP cells, CD133 expression was observed both in 4.6~6.4% of HAK-1B SP cells and in 3.9~
5.3% of HAK-1B NSP cells. CD13 expression was higher in SP cells (21.7%) than in NSP cells (8.9%) (Fig. 1b).
2. Generation SP and NSP cells from sorted SP and NSP cells in HAK-1A and HAK-1B After culturing HAK-1A SP cells or HAK-1B SP cells for 1 week, the percentage of HAK-1A and HAK-1B SP cells decreased to 1.9% and 7.3%, respectively. In contrast, culture of HAK-1A SP cells and HAK-1B NSP cells generated a small population of SP cells in HAK-1A (0.1%) and HAK1B (0.7%). The results suggest the SP cells could generate NSP cells, and vice versa (Fig. 2).
3. Biological features of SP and NSP cells in HAK-1B cells in vitro.
In HAK-1B, SP cell growth was significantly higher than that of NSP cells at every time point (24 h, 48 h, 72 h, 96 h, and 120 h; Fig. 3a). The cell cycle analysis revealed no obvious differences in G0-G1/ S/ G2-M ratios between SP cells (64.0%/ 30.1%/ 4.2%) and NSP cells (65.3%/ 31.9%/ 1.6%) (Fig. 3b).
Drug resistance to 5-FU, CDDP or PEG-IFN-α2b was examined. The results showed that the viability of HAK-1B SP cells (58.7%) was significantly lower than that of HAK-1B NSP cells (71.5%) at 96 h in cells treated with 0.75 μM 5-FU (P<0.001).
9
Similarly, after 96 h treatment with 1.5 μM 5-FU, viability of SP cells fell to 40.7%, compared with 47.9% in NSP cells (P<0.05). SP cell viability was also significantly lower (50.7%) than NSP cells (63.5%)(P<0.05) after 96 h treatment with 500 IU/mL PEG-IFN-α2b. No other significant differences were observed between SP and NSP cells (Fig. 3c). After exposure of HAK-1B cells to PEG-IFN-α2b for 72 h, the percentage of SP cells decreased as compared with control. Conversely, the percentage of SP cells
increased when HAK-1B cells were treated with 5-FU for 72 h (Fig. 3d).
In the colony formation assay, SP cells from HAK-1B formed 252 ±33.4 colonies, while the NSP cells formed 243 ±70.1 colonies; this difference was not significant (Fig.
4a). Sphere formation was significantly higher in SP cells (21.0±4.1 spheres) as
compared with NSP cells (15.7±2.7 spheres) in the HAK-1B cell line (P<0.05; Fig. 4b).
4. Biological features of SP and NSP cells in HAK-1B cells in vivo.
Injection of 1, 5, or 10 x 103 SP or NSP cells produced no tumors in NOD/SCID mice. In contrast, four mice that received 5 x 10⁴ SP cells and five mice that received 10 x 104 SP cells developed tumors at 8 weeks. In addition, one mouse that received 5 x 10⁴ NSP cells and two mice that received 10 x 104 NSP cells also developed small tumors (Fig.4c).
5. cDNA microarray analysis of gene expression in SP and NSP cells sorted from HAK-1A or HAK-1B cells
cDNA microarray analysis found 884 and 470 differences in gene expression between HAK-1A and HAK-1B, respectively, but there were no significant differences between SP and NSP cells in expression of stemness genes (e.g., CD44, Oct-4, Bim-1, ABCG2, CD24, EpCAM)( Table 2).
6. qRT-PCR analysis of SP and NSP cells in HAK-1A or HAK-1B cells
SP and NSP cells of HAK-1A and HAK-1B expressed mRNAs of CSC markers, such as
10
CD13, CD133, CD24, CD44, EpCAM, ABCG2, Nanog, and Bmi-1. The expression of these molecules was slightly higher in SP cells than in NSP cells. In addition, the differences in expression levels of CD133, CD24, and CD44 between SP and NSP cells were slightly larger in HAK-1B than HAK-1A cells (Fig. 4a and 4b). The other putative CSC markers, such as CD90 and Oct-4, were not expressed. As to hepatocyte
markers, CYP3A4 was expressed in HAK-1A and HAK-1B, but albumin was not expressed in either cell line.
Discussion
The present study utilized two HCC cell lines showing clonal dedifferentiation that were established at our department from a single nodule-in-nodule HCC (HAK-1A, HAK-1B), and which are unique in the world. Our aim was to study the SP cell fractions, which are considered universal markers for CSCs [15-17], in these two cell lines to clarify the relationship between CSCs and clonal dedifferentiation
SP cells from HAK-1A, which was established from a part of the well-differentiated HCC, represented only 0.2% of total cells, an extremely low percentage. However, in SP cells from the HAK-1B cell line, which is a part of the poorly-differentiated HCC derived from dedifferentiation of HAK-1A, the SP fraction was 0.9%, 4.5 times higher than in HAK-1A. Further, our analysis of the putative CSCs markers CD133, CD90, EpCAM and CD13 found no expression of CD90 or EpCAM in either HAK-1A or HAK-1B, while CD13 and CD133 was expressed in HAK-1B alone. In addition, while there was no difference in the expression of CD133 between SP and NSP cells in HAK-1B, CD13 expression was apparently higher in HAK-1B SP cells (21.7%) than HAK-1B NSP cells (8.9%). Haraguchi et al. [20] have reported that CD13 was an abundantly expressed marker in SP cells from the HCC cell lines HuH7 and PLC/PRL/5. This fraction existed primarily during the G0 phase of the cell cycle, and exhibited high tumorigenicity and drug resistance. Our findings suggest the possibility that CD13 could also be a CSC
11
marker for HAK-1B cells. The significance of CD13 in HAK-1B should be further studied.
Analysis of biological features revealed that HAK-1B SP cells possess some properties of CSC, such as higher sphere forming ability and tumorigenicity, as compared with NSP cells. However, HAK-1B SP cells lacked the following four features of CSC. Firstly, HAK-1B SP cells lacked high drug resistance and colony forming ability. Drug treatment usually increases the percentage of CSC, but our results did not always show such tendency, i.e., PEG-IFN-α2b treatment increased the percentage of SP cells, but 5-FU treatment increased the percentage of SP cells. The reason for this contradictory result is not clear and should be further elucidated. Secondly, the percentage of G0/G1 phase is usually higher in CSC, but our cell cycle analysis revealed no difference in rates between SP and NSP cells. Thirdly, differentiated cells do not generate CSC, but in our study, NSP cells could generate SP cells. Fourthly, no difference in microarray analysis and slight difference in qRT-PCR analysis were observed in stemness gene expression between SP and NSP cells.
These results suggest that HAK-1B SP cells do not fulfill the criteria to be considered CSCs.
As described above, it is recognized that the SP cell fraction in a variety of tumors is rich in CSC [15-17], but some reports question whether there is a relationship between SP cells and CSCs. Burket et al. [30] examined SP and NSP cells in 4 gastrointestinal cancer cell lines and found that CD34 was expressed in the NSP fraction but not in the SP fraction, however no significant differences were observed in any other category, including colony formation, tumorigenicity, or multi-lineage differentiation.
Two main theories are still being debated with regard to the histogenesis of HCC. For many years the observation of preneoplastic nodules in HCC induced experimentally by exposure to chemicals supported the dedifferentiation hypothesis, i.e. the theory that HCC was derived from the dedifferentiation of adult hepatocytes. Further, the recent
12
discovery of the role of small oval cells in the process of carcinogenesis has led to development of the maturation arrest hypothesis, which suggests that HCC derives from the maturation arrest of hepatic stem cells, and analysis of HCC cells has indicated the presence of cells with stem-cell-like properties [31]. It is also suspected that
dedifferentiation may cause CSCs. As of yet there have been no reports on the relationship between dedifferentiation and CSCs. The present study suggested a
relationship between dedifferentiation and expression of CSC markers, but many aspects of the mechanisms of dedifferentiation remain unclear, and many different mechanisms have been reported to explain the abnormal proliferation and dedifferentiation of liver cells in HCC pathogenesis. Among these the most common are (i) inactivation of p53, p14 and p16, (ii) overexpression of cyclin D1/Cdk4, insulin-like growth factor-II or c-MET, or (iii) activation of the Ras/mitogen activated protein kinase (MAPK), transforming growth factor (TGF)-β signaling or Wnt/β-catenin signaling [32-37].
Further studies are required to clarify the mechanisms underlying dedifferentiation, including the relation between dedifferentiation and CSCs.
In conclusion, the present study found that the SP cell fraction was 4.5 times higher in the HAK-1B cell line than in the HAK-1A cell line, and that the expression of CD13 and CD133, which are considered to be CSC markers, was observed only in HAK-1B. Also, a comparison of HAK-1B SP and NSP cells found that CD13 expression was higher in the SP fraction, suggesting a possible relationship between the expression of CSC markers and dedifferentiation. Moreover, HAK-1B SP cells showed more malignant biological features, such as higher sphere forming ability and tumorigenicity as compared with NSP cells. However, with the exception of these biological features, no other CSC characteristics were clearly observed in the HAK-1B SP cells. Thus, the concept of the SP cells as a universal marker for CSC may not apply to HAK-1A and HAK-1B. We plan to examine the relationship between dedifferentiation and CSC using other CSC markers, such as CD13 and CD133.
13 Acknowledgements
We thank Ms. Akemi Fujiyoshi for her excellent assistance in our experiments.
14 References
1. Clarke, M.F., et al., Cancer stem cells--perspectives on current status and future directions: AACR Workshop on cancer stem cells. Cancer Res, 2006.
66(19):9339-9344.
2. Jordan, C.T., M.L. Guzman, and M. Noble, Cancer stem cells. N Engl J Med, 2006. 355(12):1253-1261.
3. Marquardt, J.U., V.M. Factor, and S.S. Thorgeirsson, Epigenetic regulation of cancer stem cells in liver cancer: current concepts and clinical implications. J Hepatol. 53(3):568-577.
4. Lapidot, T., et al., A cell initiating human acute myeloid leukaemia after transplantation into SCID mice. Nature, 1994. 367(6464): 645-648.
5. Bonnet, D. and J.E. Dick, Human acute myeloid leukemia is organized as a hierarchy that originates from a primitive hematopoietic cell. Nat Med, 1997.
3(7):730-737.
6. Collins, A.T., et al., Prospective identification of tumorigenic prostate cancer stem cells. Cancer Res, 2005. 65(23):10946-10951.
7. Houghton, J., et al., Gastric cancer originating from bone marrow-derived cells.
Science, 2004. 306(5701):1568-1571.
8. Kim, C.F., et al., Identification of bronchioalveolar stem cells in normal lung and lung cancer. Cell, 2005. 121(6):823-835.
9. Ponti, D., et al., Isolation and in vitro propagation of tumorigenic breast cancer cells with stem/progenitor cell properties. Cancer Res, 2005. 65(13):5506-5511.
10. Ricci-Vitiani, L., et al., Identification and expansion of human colon-cancer-initiating cells. Nature, 2007. 445(7123):111-115.
11. Singh, S.K., et al., Identification of a cancer stem cell in human brain tumors.
Cancer Res, 2003. 63(18):5821-5828.
12. Falciatori, I., et al., Identification and enrichment of spermatogonial stem cells
15
displaying side-population phenotype in immature mouse testis. FASEB J, 2004.
18(2):376-378.
13. Goodell, M.A., et al., Isolation and functional properties of murine hematopoietic stem cells that are replicating in vivo. J Exp Med, 1996. 183(4):1797-1806.
14. Shimano, K., et al., Hepatic oval cells have the side population phenotype defined by expression of ATP-binding cassette transporter ABCG2/BCRP1. Am J Pathol, 2003. 163(1):3-9.
15. Kondo, T., T. Setoguchi, and T. Taga, Persistence of a small subpopulation of cancer stem-like cells in the C6 glioma cell line. Proc Natl Acad Sci U S A, 2004.
101(3):781-786.
16. Chiba, T., et al., Side population purified from hepatocellular carcinoma cells harbors cancer stem cell-like properties. Hepatology, 2006. 44(1):240-251.
17. Patrawala, L., et al., Side population is enriched in tumorigenic, stem-like cancer cells, whereas ABCG2+ and ABCG2- cancer cells are similarly tumorigenic.
Cancer Res, 2005. 65(14):6207-6219.
18. Itsubo, M., et al., Immunohistochemical study of expression and cellular
localization of the multidrug resistance gene product P-glycoprotein in primary liver carcinoma. Cancer, 1994. 73(2):298-303.
19. Park, C.Y., D. Tseng, and I.L. Weissman, Cancer stem cell-directed therapies:
recent data from the laboratory and clinic. Mol Ther, 2009. 17(2):219-30.
20. Haraguchi, N., et al., CD13 is a therapeutic target in human liver cancer stem cells. J Clin Invest. 120(9):3326-3339.
21. Ma, S., et al., Identification and characterization of tumorigenic liver cancer stem/progenitor cells. Gastroenterology, 2007. 132(7):2542-2556.
22. Suetsugu, A., et al., Characterization of CD133+ hepatocellular carcinoma cells as cancer stem/progenitor cells. Biochem Biophys Res Commun, 2006.
351(4):820-824.
16
23. Yamashita, T., et al., EpCAM-positive hepatocellular carcinoma cells are
tumor-initiating cells with stem/progenitor cell features. Gastroenterology, 2009.
136(3):1012-1024.
24. Yang, Z.F., et al., Significance of CD90+ cancer stem cells in human liver cancer.
Cancer Cell, 2008. 13(2):153-166.
25. Libbrecht, L., Hepatic progenitor cells in human liver tumor development. World J Gastroenterol, 2006. 12(39):6261-6265.
26. Yano, H., et al., Establishment of two distinct human hepatocellular carcinoma cell lines from a single nodule showing clonal dedifferentiation of cancer cells.
Hepatology, 1993. 18(2):320-327.
27. Hisaka, T., et al., Interferon-alphaCon1 suppresses proliferation of liver cancer cell lines in vitro and in vivo. J Hepatol, 2004. 41(5):782-789.
28. Yano, H., et al., Interferon alfa receptor expression and growth inhibition by interferon alfa in human liver cancer cell lines. Hepatology, 1999.
29(6):1708-1717.
29. Ueda, K., et al., Aldehyde Dehydrogenase 1 Identifies Cells with Cancer Stem Cell-Like Properties in a Human Renal Cell Carcinoma Cell Line . PLOS ONE, 2013. 8(10):e75463.
30. Burkert, J., W.R. Otto, and N.A. Wright, Side populations of gastrointestinal cancers are not enriched in stem cells. J Pathol, 2008. 214(5):564-573.
31. Sell, S. and H.L. Leffert, Liver cancer stem cells. J Clin Oncol, 2008.
26(17):2800-2805.
32. Breuhahn, K., T. Longerich, and P. Schirmacher, Dysregulation of growth factor signaling in human hepatocellular carcinoma. Oncogene, 2006.
25(27):3787-3800.
33. El-Serag, H.B. and K.L. Rudolph, Hepatocellular carcinoma: epidemiology and molecular carcinogenesis. Gastroenterology, 2007. 132(7):2557-2576.
17
34. Tannapfel, A., et al., INK4a-ARF alterations and p53 mutations in hepatocellular carcinomas. Oncogene, 2001. 20(48):7104-7109.
35. Teufel, A., et al., Genetics of hepatocellular carcinoma. World J Gastroenterol, 2007. 13(16):2271-2282.
36. van Zijl, F., et al., Epithelial-mesenchymal transition in hepatocellular carcinoma.
Future Oncol, 2009. 5(8):1169-1179.
37. Villanueva, A., et al., Genomics and signaling pathways in hepatocellular carcinoma. Semin Liver Dis, 2007. 27(1):55-76.
18 Figure legends
Fig. 1a. SP cells are considered to be abolished by reserpine. The ratio of SP cells in the HAK-1A cell line was 0.207%. There was almost no expression of CD133, CD90, EpCAM or CD13 in SP and NSP cells from HAK-1A.
Fig. 1b. The ratio of SP cells in the HAK-1B cell line was 0.9%. In the HAK-1B cell line, CD133 was expressed in 4.6~6.4% of SP cells and 3.9~5.3% of NSP cells. CD13 expression was higher in SP cells (21.7%) than in NSP cells (8.9%). CD90 and EpCAM expression was low in both SP and NSP cells. The experiments were repeated twice, and almost identical results were obtained.
Fig. 2. After culturing HAK-1A SP cells or HAK-1B SP cells for 1 week, the percentage of HAK-1A SP cells and HAK-1B SP cells decreased to 1.9% and 7.3%, respectively. In contrast, culture of HAK-1A and HAK-1B NSP cells generated a small population of SP cells in HAK-1A (0.1%) and HAK1B (0.7%). The experiments were repeated twice, and almost identical results were obtained.
Fig. 3a. Cell proliferation was significantly higher in SP cells than in NSP cells at 24 h, 48 h, 72 h, 96 h, or 120 h. The experiments were repeated twice, and almost identical results were obtained.
Fig. 3b. Cell cycle analysis found no apparent difference in G0-G1/ S/ G2-M ratios between HAK-1B SP and NSP cells. The experiments were repeated twice, and almost identical results were obtained.
19
Fig. 3c. Drug resistance to CDDP, 5-FU or PEG-IFN-α2b was compared between SP and NSP cells from HAK-1B at 48 h and 96 h. The viability of SP cells was significantly lower than NSP cells after 96 h treatment with 0.75 μM or 1.5 µM 5-FU, or 96 h treatment with 500 IU/mL PEG-IFN-α2b. No other significant differences were observed between SP and NSP cells. The experiments were repeated at least three times, and almost identical results were obtained.
Fig. 3d. After exposure of HAK-1B cells to PEG-IFN-α2b for 72 h, the percentage of SP cells decreased as compared with control. Conversely, the percentage of SP cells
increased when HAK-1B cells were treated with 5-FU for 72 h. The experiments were repeated at least three times, and almost identical results were obtained.
Fig. 4a. Colony formation assay found no significant difference between HAK-1B SP cells and NSP cells. The experiments were repeated at least three times, and almost identical results were obtained.
Fig. 4b. Sphere formation was significantly higher in HAK-1B SP cells than NSP cells.
The experiments were repeated at least three times, and almost identical results were obtained.
Fig 4c. Injection of 1, 5, or 10 x 103 SP or NSP cells produced no tumors in NOD/SCID mice. In contrast, four mice that received 5 x 10⁴ SP cells and five mice that received 10 x 104 SP cells developed tumors at 8 weeks. In addition, one mouse that received 5 x 10⁴ NSP cells and two mice that received 10 x 104 NSP cells also developed small tumors
20
Fig. 5a and b. SP and NSP cells of HAK-1A and HAK-1B expressed mRNAs of CSC markers, such as CD13, CD133, CD24, CD44, EpCAM, ABCG2, Nanog, and Bmi-1, and hepatocyte marker, CYP3A4. The expression of CSC markers was slightly higher in SP cells than in NSP cells.
21
Table 1 Primer and probe mixes list for qRT-PCR analysis Gene name Assay IDs
CD13 Hs00174365_ml
CD133 Hs00195682_ml
CD24 Hs03044178_ml
CD44 Hs01075861_ml
CD90 Hs00174816_ml
EpCAM Hs00158980_m1 ABCG2 Hs01053790_ml Oct-4 Hs03666771_ml Nanog Hs04260366_ml
BMI1 Hs00201350_m1
Alb Hs00910225_m1
CYP3A4 Hs00604506_ml β-actin Hs99999903_m1
22
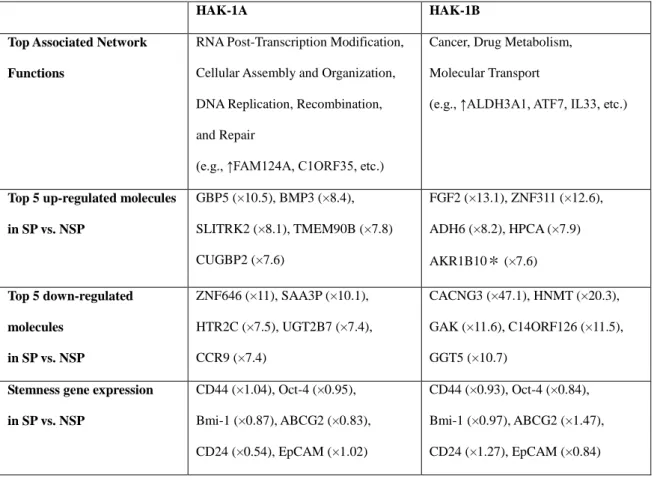
Table 2. Summary of cDNA microarray of SP and NSP cells from HAK-1A and HAK-1B
Gene expression in SP cells and NSP cells sorted from HAK-1A or HAK-1B cells was analyzed by cDNA microarray, but no significant differences were observed between SP cells and NSP cells of either cell line with regard to stemness gene expression.
HAK-1A HAK-1B
Top Associated Network Functions
RNA Post-Transcription Modification, Cellular Assembly and Organization, DNA Replication, Recombination, and Repair
(e.g., ↑FAM124A, C1ORF35, etc.)
Cancer, Drug Metabolism, Molecular Transport
(e.g., ↑ALDH3A1, ATF7, IL33, etc.)
Top 5 up-regulated molecules in SP vs. NSP
GBP5 (×10.5), BMP3 (×8.4), SLITRK2 (×8.1), TMEM90B (×7.8) CUGBP2 (×7.6)
FGF2 (×13.1), ZNF311 (×12.6), ADH6 (×8.2), HPCA (×7.9) AKR1B10* (×7.6)
Top 5 down-regulated molecules
in SP vs. NSP
ZNF646 (×11), SAA3P (×10.1), HTR2C (×7.5), UGT2B7 (×7.4), CCR9 (×7.4)
CACNG3 (×47.1), HNMT (×20.3), GAK (×11.6), C14ORF126 (×11.5), GGT5 (×10.7)
Stemness gene expression in SP vs. NSP
CD44 (×1.04), Oct-4 (×0.95), Bmi-1 (×0.87), ABCG2 (×0.83), CD24 (×0.54), EpCAM (×1.02)
CD44 (×0.93), Oct-4 (×0.84), Bmi-1 (×0.97), ABCG2 (×1.47), CD24 (×1.27), EpCAM (×0.84)