RESEARCH ARTICLE
Possible increase in insulin resistance and concealed glucose-coupled potassium-
lowering mechanisms during acute coronary syndrome documented by covariance
structure analysis
Satoshi Ito, Tomohisa Nagoshi*, Kosuke Minai, Yusuke Kashiwagi, Hiroshi Sekiyama, Akira Yoshii, Haruka Kimura, Yasunori Inoue, Kazuo Ogawa, Toshikazu D. Tanaka, Takayuki Ogawa, Makoto Kawai, Michihiro Yoshimura
Division of Cardiology, Department of Internal Medicine, The Jikei University School of Medicine, Tokyo, JAPAN
Abstract
Objective
Although glucose-insulin-potassium (GIK) therapy ought to be beneficial for ischemic heart disease in general, variable outcomes in many clinical trials of GIK in acute coronary syn- drome (ACS) had a controversial impact. This study was designed to examine whether
“insulin resistance” is involved in ACS and to clarify other potential intrinsic compensatory mechanisms for GIK tolerance through highly statistical procedure.
Methods and results
We compared the degree of insulin resistance during ACS attack and remission phase after treatment in individual patients (n = 104). During ACS, homeostasis model assess- ment of insulin resistance (HOMA-IR) values were significantly increased (P<0.001), while serum potassium levels were transiently decreased (degree of which was indicated by ΔK) (P<0.001). This finding provides a renewed paradox, as ΔK, a surrogate marker of intrinsic GIK cascade activation, probably reflects the validated glucose metabolism during ische- mic attack. Indeed, multiple regression analysis revealed that plasma glucose level during ACS was positively correlated with ΔK (P = 0.026), whereas HOMA-IR had no impact on ΔK. This positive correlation between ΔK and glucose was confirmed by covariance struc- ture analysis with a strong impact (β: 0.398, P = 0.015). Intriguingly, a higher incidence of myocardial infarction relative to unstable angina pectoris, as well as a longer hospitaliza- tion period were observed in patients with larger ΔK, indicating that ΔK also reflects dis- ease severity of ACS.
a1111111111 a1111111111 a1111111111 a1111111111 a1111111111
OPEN ACCESS
Citation: Ito S, Nagoshi T, Minai K, Kashiwagi Y, Sekiyama H, Yoshii A, et al. (2017) Possible increase in insulin resistance and concealed glucose-coupled potassium-lowering mechanisms during acute coronary syndrome documented by covariance structure analysis. PLoS ONE 12(4):
e0176435.https://doi.org/10.1371/journal.
pone.0176435
Editor: Junichi Sadoshima, Rutgers New Jersey Medical School, UNITED STATES
Received: December 13, 2016 Accepted: April 10, 2017 Published: April 21, 2017
Copyright:©2017 Ito et al. This is an open access article distributed under the terms of theCreative Commons Attribution License, which permits unrestricted use, distribution, and reproduction in any medium, provided the original author and source are credited.
Data Availability Statement: All relevant data are within the paper and its Supporting Information files.
Funding: The authors received no specific funding for this work.
Competing interests: The authors have declared that no competing interests exist.
Conclusions
Insulin resistance most likely increases during ACS; however, ΔK was positively correlated with plasma glucose level, which overwhelmed insulin resistance condition. The present study with covariance structure analysis suggests that there are potential endogenous glu- cose-coupled potassium lowering mechanisms, other than insulin, regulating glucose metabolism during ACS.
Introduction
Substantial experimental evidence with animal models supports the potential benefit of glu- cose-insulin-potassium (GIK) administration in patients with ischemic heart disease (IHD) in general by promoting glucose metabolism. The activation of insulin signaling per se has a car- dioprotective effect mainly via anti-inflammatory, anti-apoptotic, and provasodilatory proper- ties, as well as by accelerating uptake and utilization of glucose in the heart, which becomes an important preferential substrate for ischemic myocardium [1–4]. As such, the sustenance of glycolytic flux is crucial for maintaining cellular viability and ion homeostasis via Na
+/K
+- ATPase activation.
However, many clinical trials with variable results have a controversial impact on GIK given to patients with acute coronary syndrome (ACS) [5–11]. A number of factors may offset the cardioprotective effects of GIK, such as elevated glucose levels and volume overload induced by this cocktail infusion [8]. In addition, the presence of insulin resistance during ACS attack is believed to be a critical reason for this paradox, although few studies have directly evaluated the insulin resistance in the acute phase of ischemic attack [12].
We recently reported a transient decrease in serum potassium (K) level during ischemic attack of ACS compared to remission phase after treatment in individual patients [13]. The degree of the transient K decrease is tightly correlated with glucose level during ischemic attack, independently of the diabetic condition. The findings in that study indicated the pres- ence of intrinsic glucose-coupled K lowering mechanisms, like GIK, but without involving insulin, that are activated during ACS attack. Although the study suggested that the degree of transient K decrease, as a parameter of intrinsic GIK cascade activation, represents validated glucose metabolism during ischemic attack, little is known about the degree of insulin resis- tance at the acute phase of ACS attack.
Several methods have been developed for assessing insulin resistance, including plasma insulin level and homeostasis model assessment of insulin resistance (HOMA-IR). When eval- uating the correlation of transient K decrease with glucose and various parameters of insulin resistance, it is logical to simultaneously include every possible factor in the same analysis.
However, given that HOMA-IR can be confounded by serum glucose and insulin levels, multi- ple regression analysis cannot be conducted at the same time. A covariance structure analysis is therefore useful for understanding how relationships among observed variables might be generated by hypothesized latent variables in many areas [14]. The path model, a platform of the covariance structure analysis, is proposed based on the scientific knowledge, abundant experience, steady concept, and clear direction of the study.
To identify the mechanism of GIK tolerance and elucidate other intrinsic compensatory
systems for glucose metabolism during ACS attack, we examined whether or not insulin resis-
tance is increased in the acute phase of ischemia and evaluated the relationship between the
degree of transient K decrease and insulin resistance as well as other clinical factors related to glucose/electrolytes metabolism using covariance structure analysis.
Methods Study patients
Patients with ACS who required emergency admission to The Jikei University Hospital from September 2014 to August 2016 were included in this study. The ethics committee of The Jikei University School of Medicine approved the study protocol (27–103[7988]). ACS was defined as the presence of myocardial infarction (MI) or unstable angina pectoris, as described in detail previously [13]. Briefly, the presence of any two of the following three criteria was required for the diagnosis of MI: (1) a history of cardiac chest pain lasting at least 30 minutes; (2) typical electrocardiographic changes; (3) an increase in serum creatine kinase (CK) level. Unstable angina pectoris was diagnosed according to the criteria for the Braunwald clinical classification without a serum CK increase. All of the patients were admitted to the hospital and underwent emergent cardiac catheterization within 24 hours of the onset. During the study period, 122 patients were treated for ACS in total. Patients who were receiving or starting dialysis (n = 7), were taking potassium-controlling agents (n = 2), were treated with insulin (n = 8) and/or ste- roids (n = 6) were excluded. No patient with ACS died from any cause during hospi talization in the present study. Based on these selection criteria, 104 consecutive patients, including 53 with MI (51.0%), were enrolled in the present study (Table 1).
Data collection
The clinical characteristics were collected retrospectively from the hospital medical records.
ΔK, indicating the degree of transient K decrease during ischemic attack, was calculated from the difference between K during remission phase (the serum K level at the time of discharge) and K during ischemic attack (the serum K level at the time of the emergent cardiac catheteri- zation), as described in detail previously [13]:
DK ¼ K during remission phase K during ischemic attack
All other biochemical data, including plasma glucose level and insulin level, were measured both at the time of the emergent catheterization and at discharge, except for peak CK level.
HOMA-IR (as a parameter of insulin resistance), homeostatic model assessment beta cell func- tion (HOMA-β), and the estimated glomerular filtration rate (eGFR) were calculated as described previously [13, 15, 16]. The definition of Diabetes mellitus (DM), hypertension, and dyslipidemia were described previously [15, 17, 18]. The hemodynamic parameters, including left ventricular ejection fraction (LVEF), were measured at the time of cardiac catheterization [19].
Definitions of the medication profiles
As for the involvement of renin-angiotensin-aldosterone system inhibitors (RAAS-I) and
diuretics, the influence of the changes in each medication profile was examined as follows
(also as described previously [13]): “newly-administered (+)” indicates that the medications
were not being taken at admission but were introduced during hospitalization; “newly-admin-
istered (-)” indicates all the other patients who were not included in newly-administered (+)
subject. Two patients in each group were taking the medications at admission but discontin-
ued them during hospitalization, and they were designed as newly-administered (-) subjects.
Statistical analysis
Continuous variables were expressed as the means ± standard deviation (SD). To compare the serum K, glucose, insulin, BNP levels as well as HOMA-IR and HOMA-β between groups, the statistical analyses were performed using a paired sample t-test. The influence of β-blocker use at admission on ΔK was assessed using one way analysis of variance (ANOVA), and the influ- ence of changes in the medication profiles of RAAS-I and diuretics was evaluated using Mann- Whitney’s U test. To assess the determinants of ΔK, multiple regression analyses were per- formed after simple regression analyses, as described previously [13]. The patients’ mean blood pressure, plasma glucose level, plasma insulin level, HOMA-IR, HOMA-β during ische- mic attack and remission phase, glycohemoglobin (HbA1c), sodium (Na) level, eGFR, B-type natriuretic peptide (BNP), LVEF, and the changes in the medication profile of RAAS–I and diuretics were included as variables. In the multiple regression analysis, indicator variables were employed as follows (also as described previously [13]): one indicator variable coded as 0/1 for variables with two categories (changes in medication profiles of RAAS-I and diuretics) was generated. To evaluate the association of ΔK with the disease severity, all of the patients were divided into two groups based on the median value of ΔK, as described previously [13], and also based on quartiles of ΔK. The ΔK threshold for the incidence of MI was assessed using receiver operating characteristic (ROC) curve, and the optimal cut-off point was defined
Table 1. Clinical characteristics (n = 104).
Age, years 63±13
Male, gender (%) 85(81.7)
Height, cm 166±7.6
Weight, kg 68.4±15.0
BMI, kg/m2 24.7±4.7
BP, mmHg
Systolic 137±23
Diastolic 78±14
Mean 102±15
K during ischemic attack, mmol/L 3.9±0.4
Na during ischemic attack, mmol/L 139±2.4
eGFR, mL/min/1.73m2 76.0±19.0
Cr, mg/dL 0.8±0.2
HbA1c, % 6.1±0.8
Glucose, mg/dL 143±40
Insulin,μU/mL 13.4±10.0
BNP, pg/mL 67±132
LVEF, % 55±9.3
Duration of hospital stay, days 10.7±7.8
Myocardial infarction (%) 53(51.0)
Unstable angina (%) 51(49.0)
Diabetes mellitus (%) 35(33.7)
Hypertension (%) 72(69.2)
BMI: body mass index, BP: blood pressure.
K: potassium, Na: sodium.
Cr: creatinine, eGFR: estimated glomerular filtration rate.
BNP: B-type natriuretic peptide.
LVEF: left ventricular ejection fraction.
https://doi.org/10.1371/journal.pone.0176435.t001
as a combination of the highest sensitivity and specificity. Continuous variables were evaluated using Mann-Whitney’s U test, and the Chi-square test for categorical variables. All of the data were statistically analyzed using the SPSS Statistics software program (version 22.0, SPSS Inc., Chicago, IL, USA). P < 0.05 was considered to be statistically significant.
Covariance structure analysis
To confirm the contribution of the plasma glucose levels to ΔK, we performed a covariance structure analysis as in our previous study [14]. This analysis compares the power among the multiple independent variables, which confound each other. A path model based on covari- ance structure analysis was proposed to investigate the relationship among clinical factors in this study population and specifically to identify probable causal effects on ΔK. The causality model defines some hierarchical regression models between clinical factors and ΔK. Another path analysis was used to investigate the relationship (causality) between RAAS-I newly- administered (+) and peak CK, as a surrogate marker of the disease severity of ACS. The path analysis was performed using the IBM SPSS AMOS software program (version 23, Amos Development Corporation, Meadville, PA, USA). The obtained structural equation models were tested and confirmed at a significance level of P < 0.05.
Results
Characteristics of the study patients
Table 1 showed the clinical characteristics of the 104 patients. A total of 33.7% of the patients were diagnosed with type 2 DM, while the mean HbA1c was 6.1±0.8% and the mean HOMA- IR during remission phase was 2.4±3.0 (normal level is < 1.6) (Table 2), indicating high inci- dence of glucose intolerance in the subjects with ACS. The mean serum K level during ische- mic attack was significantly decreased compared to K during remission phase (Table 2). In contrast, both the mean plasma glucose and the mean insulin levels were significantly higher during ischemic attack than during remission phase, leading to a higher HOMA-IR value dur- ing ischemic attack (Table 2). However, HOMA-β during ischemic attack was lower than that during remission phase, albeit non-significantly (P = 0.058). These data as well as the time course profiles of the plasma glucose and insulin levels in an individual patient (S1 Fig) indi- cate that insulin resistance is highly prevalent in patients with ACS and further increased dur- ing acute phase of ACS attack. However, concerns remained that the data gathered during ischemic attacks were obtained from patients under various dietary conditions. Therefore, a sub-analysis was performed using the data of the subjects under fasting condition, as con- firmed by their medical history. Twenty-three out of 104 patients were determined as in “a
Table 2. The comparison of the data during ischemic attack and remission phase (n = 104).
Ischemic attack Remission phase P
K, mmol/L 3.9±0.4 4.3±0.3 <0.001
Glucose, mg/dL 143.0±40.0 109.5±32.2 <0.001
Insulin,μU/mL 13.4±10.0 8.4±6.4 <0.001
HOMA-IR 5.1±5.0 2.4±3.0 <0.001
HOMA-β 65.3±41.9 75.1±55.2 0.058
BNP, pg/mL 67.2±132.0 92.4±129.8 0.116
HOMA-IR: homeostasis model assessment of insulin resistance.
HOMA-β: homeostatic model assessment beta cell function.
https://doi.org/10.1371/journal.pone.0176435.t002
definite fasting condition” (>9 hours had passed from the last meal), including subjects with early-morning onset of ACS after overnight fasting (same condition as the blood test for the remission phase). After eliminating the effects of various dietary conditions, we found that the plasma glucose, insulin and HOMA-IR levels were significantly higher and the K level signifi- cantly lower during ischemic attack than during the remission phase in these 23 patients (S1 Table). These data are in absolute agreement with the original data from the total 104 patients (Table 2), confirming that insulin resistance is likely to be increased during ischemic attack.
Clinical factors affecting the degree of the transient K decrease (ΔK) during ACS attack
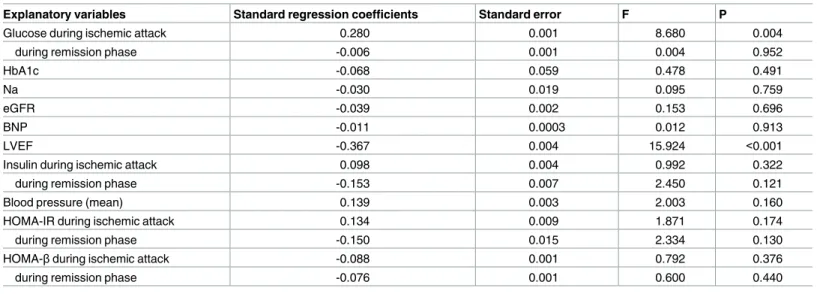
To evaluate the determinants of ΔK, we performed a simple regression analysis (Table 3).
Plasma glucose level during ischemic attack, but not that during remission phase, showed a significantly positive correlation with ΔK (P = 0.004). On the other hand, LVEF showed a neg- ative correlation with ΔK (P<0.001). ΔK was not associated with HbA1c, the insulin level, HOMA-IR, or HOMA-β during either ischemic attack or remission phase.
Next, we investigated the influence of the changes in each medication profile on ΔK.
Detailed information concerning the medication profiles is shown in S2 Table. Of the 104 patients, 34 (32.7%) were taking one or more RAAS-I and/or diuretics at admission, and 82 (78.8%) had taken these agents at the time of discharge. Eighteen patients (17.3%) were taking β-blockers at admission (β1 selective β-blockers: 10 patients; non-selective β-blocker: 8 patients) and 60 (57.7%, β1 selective β-blockers: 13; non-selective β-blocker: 47) had taken them at the time of discharge. The “newly-administered (+)” group for RAAS-I and diuretics during hospitalization showed a significantly larger ΔK than the “newly-administered (-)”
group (S2A and S2B Fig, respectively, P<0.01). The profiles of β-blocker use shown in S2C Fig had no influence on ΔK, at least for the current data, although the number of the patients tak- ing β-blockers during ischemic attack was relatively small.
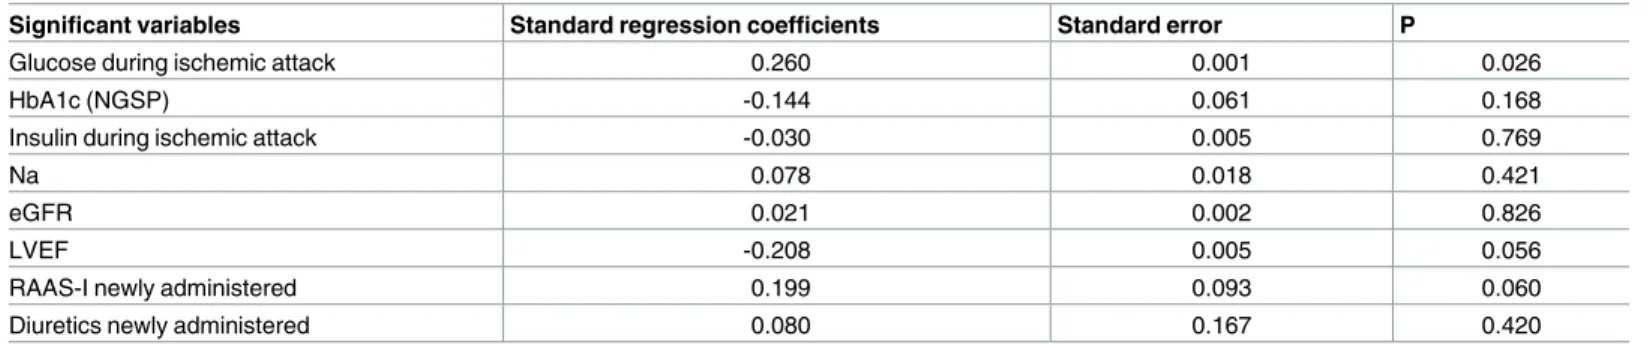
We next performed a multiple regression analysis in order to assess the independent deter- minants of ΔK (Table 4). Neither LVEF nor the medication profile influenced ΔK in this analy- sis. Of note, the plasma glucose level during ischemic attack was the sole independent factor
Table 3. The results of a simple regression analysis ofΔK (n = 104).
Explanatory variables Standard regression coefficients Standard error F P
Glucose during ischemic attack 0.280 0.001 8.680 0.004
during remission phase -0.006 0.001 0.004 0.952
HbA1c -0.068 0.059 0.478 0.491
Na -0.030 0.019 0.095 0.759
eGFR -0.039 0.002 0.153 0.696
BNP -0.011 0.0003 0.012 0.913
LVEF -0.367 0.004 15.924 <0.001
Insulin during ischemic attack 0.098 0.004 0.992 0.322
during remission phase -0.153 0.007 2.450 0.121
Blood pressure (mean) 0.139 0.003 2.003 0.160
HOMA-IR during ischemic attack 0.134 0.009 1.871 0.174
during remission phase -0.150 0.015 2.334 0.130
HOMA-βduring ischemic attack -0.088 0.001 0.792 0.376
during remission phase -0.076 0.001 0.600 0.440
ΔK = K during remission phase−K during ischemic attack.
https://doi.org/10.1371/journal.pone.0176435.t003
positively correlated with ΔK (P = 0.026), consistent with our previous study [13], whereas HbA1c and insulin levels during ischemic attack had no impact (Table 4). In addition, neither HOMA-IR nor HOMA-β was correlated with ΔK (S3 and S4 Tables, respectively). However, there was a significant positive correlation between plasma glucose level during ischemic attack and HbA1c, insulin, and HOMA-IR (P<0.001, in a linear regression analysis, data not shown).
Concept of the proposed path model (A)
The proposed theoretical path model is shown in Fig 1A. The path model was created with the blood levels of Na, HbA1c, insulin, glucose, and HOMA-IR in parallel. The correlation between any two factors among the blood levels of Na, HbA1c, insulin, glucose, and HOMA- IR is indicated using two-way arrows. In addition, LVEF, eGFR, and the usage of RAAS-I and diuretics were included as potential factors affecting ΔK. The paths between variables were drawn from independent variables to dependent variable with directional arrows for every regression model—namely, from the blood levels of Na, HbA1c, insulin, glucose, and HOMA- IR to ΔK.
Results of the path model (A)
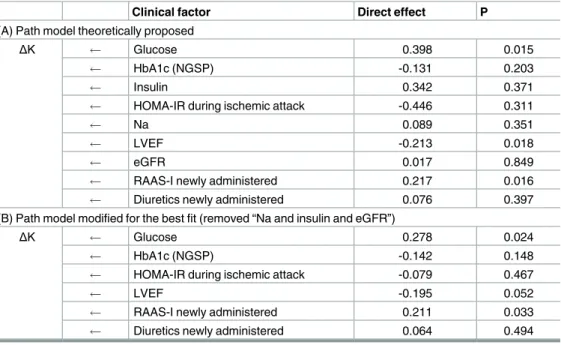
The results of the statistical analysis are shown in Table 5. The final model showed the follow- ing regression weights after standardizing all variables: ΔK was estimated by the glucose level (standardized regression coefficients, β: 0.398, P = 0.015), LVEF (β: -0.213, P = 0.018) and newly-administered RAAS-I (β: 0.217, P = 0.016). Of note, the plasma glucose levels, but not HbA1c, insulin, or HOMA-IR levels, were associated with ΔK in the covariance structure anal- ysis, which reinforced the findings of the multivariate analysis.
Concept of the proposed path model (B)
In the path model (A), the ΔK was estimated by glucose level; however, we made no allowance for a possible connection between ΔK and the use of drugs or LVEF. To examine whether they were separate effects or not, another theoretical path model (B) was proposed, as shown in Fig 1B. This path model was created with the blood levels of HbA1c, glucose, HOMA-IR, LVEF, and the usage of RAAS-I and diuretics in parallel, which were potential factors affecting ΔK.
Table 4. The results of a multiple regression analysis ofΔK (n = 104).
Significant variables Standard regression coefficients Standard error P
Glucose during ischemic attack 0.260 0.001 0.026
HbA1c (NGSP) -0.144 0.061 0.168
Insulin during ischemic attack -0.030 0.005 0.769
Na 0.078 0.018 0.421
eGFR 0.021 0.002 0.826
LVEF -0.208 0.005 0.056
RAAS-I newly administered 0.199 0.093 0.060
Diuretics newly administered 0.080 0.167 0.420
Dependent variable:ΔK
Explanatory variables: Glucose, HbA1c, Insulin during ischemic attack, Na, eGFR, LVEF.
RAAS-I or diuretics newly administered.
https://doi.org/10.1371/journal.pone.0176435.t004
Fig 1. Path models. A. Path model theoretically proposed. B. Path model modified for the best fit. Each path has a coefficient showing the standardized coefficient of a regressing independent variable on a dependent variable of the relevant path. These variables mean standardized regression coefficients (direct effect) [underlined portions indicate remarkable values], squared multiple correlations [in narrow italics] and correlations among exogenous variables [green].
https://doi.org/10.1371/journal.pone.0176435.g001
Table 5. The results of standardized regression coefficient analysis to identify the clinical factors influencingΔK in each path model.
Clinical factor Direct effect P
(A) Path model theoretically proposed
ΔK Glucose 0.398 0.015
HbA1c (NGSP) -0.131 0.203
Insulin 0.342 0.371
HOMA-IR during ischemic attack -0.446 0.311
Na 0.089 0.351
LVEF -0.213 0.018
eGFR 0.017 0.849
RAAS-I newly administered 0.217 0.016
Diuretics newly administered 0.076 0.397
(B) Path model modified for the best fit (removed “Na and insulin and eGFR”)
ΔK Glucose 0.278 0.024
HbA1c (NGSP) -0.142 0.148
HOMA-IR during ischemic attack -0.079 0.467
LVEF -0.195 0.052
RAAS-I newly administered 0.211 0.033
Diuretics newly administered 0.064 0.494
The results (direct effect) of the path model theoretically proposed (A) and the path model modified for the best fit (B) analysis to identify the clinical factors influencingΔK (seeFig 1).
The standardized direct effect of each variable onΔK after standardizing all variables.
https://doi.org/10.1371/journal.pone.0176435.t005
Results of the path model (B)
The results of the statistical analysis are shown in Table 5. The final model showed the follow- ing regression weights after standardizing all variables: ΔK was estimated by glucose level (standardized regression coefficients, β: 0.278, P = 0.024) and newly-administered RAAS-I (β:
0.211, P = 0.033). Of note, the effects of glucose and RAAS-I on ΔK can be separately consid- ered as influential factors.
Clinical significance of the transient K decrease during ACS
To evaluate the clinical implications of ΔK during ACS, we examined the association of ΔK with the disease severity and clinical course. The patients who underwent coronary bypass sur- gery were excluded from the analysis of “Duration of hospital stay”, since the surgery affects the hospitalization period independently of the disease severity. When all of the study subjects were divided into two groups based on the median value of ΔK (<0.3 and 0.3), a higher inci- dence of MI relative to unstable angina pectoris, in association with a longer hospitalization period and higher peak CK level, was observed in patients with a larger ΔK (Table 6), consis- tent with the findings from our previous study [13]. We further investigated the association of ΔK with the disease severity and clinical course in the subjects divided into two groups based on quartiles of ΔK (S5 Table). The incidence of myocardial infarction in the subjects with larger ΔK values was consistently higher, at whichever point the quartiles were divided (S5 Table). The ΔK cut-off value for predicting the incidence of MI based on the ROC curve, was 0.3 mmol/L (S3 Fig). These data indicate that ΔK reflects the disease severity of ACS.
Clinical implications of newly-administered RAAS-I on the disease severity of ACS
Given that newly-administered RAAS-I showed a larger ΔK and that ΔK reflects the disease severity of ACS, we can infer that newly-administered RAAS-I per se increases the severity of ACS. In order to examine the correlations between newly-administered RAAS-I and the dis- ease severity, another theoretical path model (C) was proposed (S4 Fig).
Results of path model (C)
The results of the statistical analysis are shown in S6 Table. The final model showed the follow- ing regression weights after standardizing all variables: the peak CK was estimated by glucose level (β: 0.437, P = 0.002), indicating that the plasma glucose level is elevated in association with the severity of ACS. This result is consistent with one of the major findings of the present study that glucose level was positively correlated with ΔK, which reflects the disease severity.
On the other hand, the peak CK was not estimated by newly-administered RAAS-I (β: -0.349, P = 0.374), whereas newly-administered RAAS-I was estimated by peak CK (β: 0.676, P = 0.010). These data suggest that RAAS-I tends to be administered more frequently in
Table 6. The impact ofΔK on disease severity and clinical course.
ΔK<median value ΔKmedian value
Myocardial Infarction 11 (28.2%) [39] 42 (64.6%) [65] P = 0.001
Peak Creatine Kinase (U/L) 639.8±969.2 [39] 1602.4±2093.0 [65] P = 0.004
Duration of hospital stay (days) 7.2±4.2 [38] 11.6±7.2 [63] P<0.001
Median value ofΔK = 0.3.
The number of cases is noted in square brackets.
https://doi.org/10.1371/journal.pone.0176435.t006
patients with severe myocardial damage, but newly-administered RAAS-I per se does not induce myocardial damage. In fact, path model (C) might reflect the clinical settings wherein patients with ACS with a relatively severe condition, such as myocardial infarction with LV dysfunction, need to be administered RAAS-I for the inhibition of myocardial remodeling as well as for other cardioprotective effects.
Discussion
Impaired glucose tolerance is a common feature in patients with IHD in general and is well established as a risk factor for increased morbidity and mortality [12, 20, 21]. In the subjects of the present study, insulin resistance (as indicated by HOMA-IR) was relatively high in remis- sion phase (namely, stable phase), consistent with the findings from a previous study [12]. We thus clearly showed for the first time that insulin resistance is likely to be increased in the acute phase of ACS attack. Regarding development of insulin resistance, miscellaneous environmen- tal factors, such as a Western-style diet and a sedentary lifestyle, increase insulin resistance, where glucotoxicity and lipotoxicity as well as chronic inflammation are deeply involved [22].
When insulin resistance progresses gradually, these factors play central roles in the coronary endothelial dysfunction, leading to coronary spasm and thrombus formation, both of which can induce ACS attack [23]. It is of clinically importance, an additional physical and mental stresses and high anxiety can become the final straw, inducing an attack. We therefore believe that the rapid increase in insulin resistance at the acute phase observed in the current study could be not only a consequence but also likely a cause of ACS.
We subsequently found that a transient K decrease during ACS attack, the degree of which (as indicated by ΔK) was positively correlated with glucose, was still preserved even under insulin resistance condition. These results indicate that there are potential neurohumoral mechanisms, like GIK but other than insulin, promoting glucose metabolism during acute ischemic attack. The current results were obtained from not only conventional statistical anal- yses but also a covariance structure analysis, which is a highly statistical procedure. The path model (A) showed a significant influence of glucose on ΔK by taking all of the potential cofounding factors of blood sampling data into consideration. We additionally found that LVEF and a hyperkalemic effect of RAAS-I were also involved in the ΔK regulation in this model. We then developed another path model (B), which again successfully showed a signifi- cant influence of glucose on ΔK while making allowances for other confounding factors, including RAAS-I. These data strongly reinforced the results obtained in the multiple regres- sion analyses.
Under high-glucose condition, insulin stimulates an intracellular K shift into the cardiac and skeletal muscles via sodium-proton exchanger (NHE)–Na
+/K
+-ATPase activation, leading to a decrease in serum K level [13, 24, 25]. Thus, ΔK assessed in the current study can be con- sidered a surrogate marker of endogenous GIK cascade activation during ACS attack, allowing that insulin resistance is rapidly increased. The possible “insulin-independent” glucose-cou- pled K-lowering mechanisms are as follows: 1) Elevated catecholamines stimulate Na
+/K
+- ATPase primarily via β2-adrenergic receptor [25–27], although the profiles of β-blocker use had no influence on the ΔK values, at least in the current study. However, the dosages of β- blockers might be critical for evaluating their effects on ΔK, and we speculate that an adequate amount of β-blockers might effectively decrease the ΔK during ACS. Since the number of the patients taking high-dose β-blockers was limited in the present study, future analyses concern- ing the dose dependent effects of β-blockers on ΔK should be performed in a larger population.
2) The activation of renin-angiotensin-aldosterone system in response to ischemic stress
might be another mechanism regulating K homeostasis during ACS [28]. 3) We recently
reported that sodium-glucose cotransporter (SGLT), which is activated by Na
+/K
+-ATPase, significantly contributes to glucose uptake in the heart as the initial rate-limiting step for car- diac metabolism during ischemia-reperfusion injury [4]. There are two major “insulin-inde- pendent” glucose transporters in the heart: SGLT1 and GLUT1 [29]. In contrast to facilitated energy-independent GLUT transport, SGLTs, as active transporters, work against the glucose concentration gradient by coupling glucose transport to the downhill Na
+electrochemical gra- dient via Na
+/K
+-ATPase. Therefore, SGLT1 activation plays a particularly important role under pathological low-glucose conditions, such as that associated with ischemia, relative to stable conditions. The present finding of a larger K decrease in subjects with higher glucose levels during ischemic attacks suggests that SGLT1-Na
+/K
+ATPase coupling might be deeply involved in the pathophysiology of the acute phase of ACS. Given this possible link, in the present path models, we populated the data of the serum sodium levels as a possible variable for the determination of a decrease in K levels. Interestingly, when drawing the path model without including the sodium level, the standardized regression coefficient (β) was slightly reduced from 0.398 to 0.380 (the precise data was not shown). This result may also support our hypothesis that the sodium level provides to be important for glucose use during ACS.
The time of the last meal was not routinely documented for the patients presenting with ACS and may affect the data on glucose and insulin levels during ischemic attack in the present study. However, the sub-analysis with the subjects in “a definite fasting condition” clearly showed that the HOMA-IR was significantly increased, while the serum K level was decreased during ischemic attack. Although we only identified 23 patients as being in a definite fasting condition (confirmed by their medical history), there might have been more cases that were in a fasting state. However, we had to exclude such potential patients to ensure data accuracy, as we could not conclusively confirm that they were in “a definite fasting state”. Although the presence of various dietary conditions is a limitation associated with the present study, the HOMA-IR during both ischemic attack and the remission phase did not significantly influence the ΔK in any case, whereas the influence of the glucose level during attack on the ΔK was con- sistently significant (Fig 1 and Tables 3–5). In contrast, HOMA-β, which is in general dramati- cally elevated in the post-prandial state, actually turned out to be low-normal during ischemic attack (Table 2). Therefore, although the influence of the prandial state cannot be completely excluded in the current study, we cannot deny that insulin resistance was increased during ischemic attack.
A complex interaction of counter-regulatory hormones, such as catecholamines, cortisol and cytokines can cause the development of stress induced hyperglycemia [30]. The derange- ment of these neurohumoral factors antagonizes the action of insulin, promotes lipolysis, and increases circulating free fatty acid (FFA) levels, all of which can ultimately leads to high hepatic glucose output and insulin resistance [3, 30]. In this context, future studies are war- ranted to determine whether plasma glucose and insulin levels, as well as FFA level, are increased during ACS attack in comparison to both those before and after ischemic attack in order to more directly delineate “transient” insulin resistance, and to understand its potential mechanism. Moreover, it is possible that acute onset of other various serious diseases, such as heart failure, respiratory failure, or acute abdomen, may induce hyperglycemia by the above- described mechanisms. Thus, it would be interesting to see whether a transient increase in insulin resistance and a decrease in potassium level are observed in these clinical conditions.
On the other hand, an increase in insulin resistance during ACS attack is of greater pathophys-
iological significance in comparison to an increase in insulin resistance during the acute phase
of other serious diseases, given that promoting glucose metabolism, -which is an important
preferential substrate for ischemic myocardium during acute phase of an ischemic attack- by
GIK therapy has cardioprotective effects.
The sample size was somewhat small in the present study. However, covariance structure analysis as well as conventional multiple regression analysis consistently showed that glucose level was positively correlated with ΔK with the highest standard regression coefficient (Table 5 and Fig 1). Thus, considering the power of β, as shown in the covariance structure analysis (0.398 in path model [A] and 0.278 in [B]), we believe that ΔK is closely associated with glucose level during ACS attack, even under insulin-resistant conditions.
Conclusions
Insulin resistance most likely increases during the acute phase of ACS attack. Although there is an endogenous GIK-tolerant state during ACS attack, a transient decrease in serum K level during ischemic attack was still observed, the degree of which was consistently positively cor- related with glucose level but not correlated at all with HOMA-IR. These data suggest that, at the acute phase of ACS attack, there is “insulin-independent” intrinsic GIK cascade activation to promote glucose metabolism in order to cope with the critical ischemic condition, even in an insulin-resistant state. Meanwhile, the present study supports the findings of recent large clinical trials recommending that GIK administration be started as early as possible (namely, before a rapid increase in insulin resistance) [7, 11, 31, 32] and underscores the importance of preventing or ameliorating insulin resistance as an acute-phase treatment of ACS to ensure the effective utilization of the intrinsic GIK cascade activation.
Supporting information
S1 Fig. The time course of the plasma glucose and insulin level profiles. An individual patient’s profile (n = 104) is indicated by the arrow pointing to the data during remission phase from those during ischemic attack.
(TIFF)
S2 Fig. The comparison of ΔK among the changes in the medication profiles. The compari- son of ΔK among the indicated changes in the medication profiles of rennin-angiotensin-aldo- sterone system inhibitors (RAAS-I) (newly administered (-): n = 52; (+): n = 52) (A) and diuretics (newly administered (-): n = 96; (+): n = 8) (B) in all patients (n = 104) are shown.
The definition of ‘newly administered’ is described in the Methods section. (C) The ΔK is com- pared among the medication profiles for β-blockers; (-) indicates the subjects who were not taking any β-blockers at admission (n = 86), and those with β1 selective β-blocker use (n = 10) and those with non-selective β-blocker use (n = 8) at admission are represented.
P<0.01 by independent t-test. NS; not significant.
(TIFF)
S3 Fig. Receiver operating characteristic (ROC) curve for detecting ΔK threshold for the incidence of myocardial infarction. The cut-off value of ΔK is 0.3 with a combination of the highest sensitivity and specificity. AUC; area under the ROC curve.
(TIFF)
S4 Fig. Path model theoretically proposed for the correlation between the effects of newly- administered angiotensin-aldosterone system inhibitors (RAAS-I) and the disease severity.
Each path has a coefficient showing the standardized coefficient of a regressing independent variable on a dependent variable of the relevant path. These variables represent standardized regression coefficients (direct effect) [underlined portions indicate remarkable values] and squared multiple correlations [in narrow italics].
(TIFF)
S1 Table. The comparison of the data during ischemic attack and remission phase in patients under fasting condition confirmed by medical history.
(PDF)
S2 Table. Medication profile.
(PDF)
S3 Table. The results of a multiple regression analysis of ΔK.
(PDF)
S4 Table. The results of a multiple regression analysis of ΔK.
(PDF)
S5 Table. The impact of ΔK on disease severity and clinical course based on quartiles of ΔK.
(PDF)
S6 Table. The results of standardized regression coefficient analysis to identify the correla- tion between the effects of RAAS-I newly administered and the disease severity in path model.
(PDF)
Acknowledgments
The authors are grateful to Ms. Kumiko Nishiyama for data assistance.
Author Contributions
Conceptualization: SI TN MY.
Formal analysis: SI KM YI MK MY.
Investigation: SI YK HS AY HK KO TT.
Methodology: KM TO MY.
Project administration: TN MY.
Resources: KM TO.
Supervision: SI TN MY.
Visualization: SI TN.
Writing – original draft: SI TN HS TT MY.
Writing – review & editing: SI TN MK MY.
References
1. Matsui T, Tao J, del Monte F, Lee KH, Li L, Picard M, et al. Akt activation preserves cardiac function and prevents injury after transient cardiac ischemia in vivo. Circulation. 2001; 104(3):330–5. PMID:
11457753
2. Nagoshi T, Matsui T, Aoyama T, Leri A, Anversa P, Li L, et al. PI3K rescues the detrimental effects of chronic Akt activation in the heart during ischemia/reperfusion injury. J Clin Invest. 2005; 115(8):2128–
38.https://doi.org/10.1172/JCI23073PMID:16007268
3. Nagoshi T, Yoshimura M, Rosano GM, Lopaschuk GD, Mochizuki S. Optimization of Cardiac Metabo- lism in Heart Failure. Curr Pharm Des. 2011; 17:3846–53.https://doi.org/10.2174/
138161211798357773PMID:21933140
4. Kashiwagi Y, Nagoshi T, Yoshino T, Tanaka TD, Ito K, Harada T, et al. Expression of SGLT1 in Human Hearts and Impairment of Cardiac Glucose Uptake by Phlorizin during Ischemia-Reperfusion Injury in Mice. PLOS ONE. 2015; 10(6):e0130605.https://doi.org/10.1371/journal.pone.0130605PMID:
26121582
5. Sack MN, Yellon DM. Insulin therapy as an adjunct to reperfusion after acute coronary ischemia: a pro- posed direct myocardial cell survival effect independent of metabolic modulation. J Am Coll Cardiol.
2003; 41(8):1404–7. PMID:12706939
6. Mehta SR, Yusuf S, Diaz R, Zhu J, Pais P, Xavier D, et al. Effect of glucose-insulin-potassium infusion on mortality in patients with acute ST-segment elevation myocardial infarction: the CREATE-ECLA ran- domized controlled trial. JAMA. 2005; 293(4):437–46.https://doi.org/10.1001/jama.293.4.437PMID:
15671428
7. Selker HP, Beshansky JR, Sheehan PR, Massaro JM, Griffith JL, D’Agostino RB, et al. Out-of-hospital administration of intravenous glucose-insulin-potassium in patients with suspected acute coronary syn- dromes: the IMMEDIATE randomized controlled trial. JAMA. 2012; 307(18):1925–33.https://doi.org/
10.1001/jama.2012.426PMID:22452807
8. Kloner RA, Nesto RW. Glucose-insulin-potassium for acute myocardial infarction: continuing contro- versy over cardioprotection. Circulation. 2008; 117(19):2523–33.https://doi.org/10.1161/
CIRCULATIONAHA.107.697979PMID:18474824
9. Grossman AN, Opie LH, Beshansky JR, Ingwall JS, Rackley CE, Selker HP. Glucose-insulin-potassium revived: current status in acute coronary syndromes and the energy-depleted heart. Circulation. 2013;
127(9):1040–8.https://doi.org/10.1161/CIRCULATIONAHA.112.130625PMID:23459576 10. Nam MC, Byrne CD, Kaski JC, Greaves K. Insulin in Acute Coronary Syndrome: a Narrative Review
with Contemporary Perspectives. Cardiovasc Drugs Ther. 2016.
11. Selker HP, Harris WS, Rackley CE, Marsh JB, Ruthazer R, Beshansky JR, et al. Very early administra- tion of glucose-insulin-potassium by emergency medical service for acute coronary syndromes: Biologi- cal mechanisms for benefit in the IMMEDIATE Trial. Am Heart J. 2016; 178:168–75.https://doi.org/10.
1016/j.ahj.2016.03.026PMID:27502865
12. Ramachandran A, Chamukuttan S, Immaneni S, Shanmugam RM, Vishnu N, Viswanathan V, et al.
High incidence of glucose intolerance in Asian-Indian subjects with acute coronary syndrome. Diabetes Care. 2005; 28(10):2492–6. PMID:16186285
13. Sekiyama H, Nagoshi T, Komukai K, Matsushima M, Katoh D, Ogawa K, et al. Transient decrease in serum potassium level during ischemic attack of acute coronary syndrome: Paradoxical contribution of plasma glucose level and glycohemoglobin. Cardiovasc Diabetol. 2013; 12:4.https://doi.org/10.1186/
1475-2840-12-4PMID:23289667
14. Kinoshita K, Kawai M, Minai K, Ogawa K, Inoue Y, Yoshimura M. Potent influence of obesity on sup- pression of plasma B-type natriuretic peptide levels in patients with acute heart failure: An approach using covariance structure analysis. Int J Cardiol. 2016; 215:283–90.https://doi.org/10.1016/j.ijcard.
2016.04.111PMID:27128547
15. Komukai K, Minai K, Arase S, Ogawa T, Nakane T, Nagoshi T, et al. Impact of body mass index on clini- cal outcome in patients hospitalized with congestive heart failure. Circ J. 2012; 76(1):145–51. PMID:
22094909
16. Inoue Y, Kawai M, Minai K, Ogawa K, Nagoshi T, Ogawa T, et al. The impact of an inverse correlation between plasma B-type natriuretic peptide levels and insulin resistance on the diabetic condition in patients with heart failure. Metabolism. 2016; 65(3):38–47.https://doi.org/10.1016/j.metabol.2015.09.
019PMID:26892514
17. Yagi H, Komukai K, Hashimoto K, Kawai M, Ogawa T, Anzawa R, et al. Difference in risk factors between acute coronary syndrome and stable angina pectoris in the Japanese: Smoking as a crucial risk factor of acute coronary syndrome. J Cardiol. 2010; 55(3):345–53.https://doi.org/10.1016/j.jjcc.
2009.12.010PMID:20350505
18. Ogawa K, Tanaka T, Nagoshi T, Sekiyama H, Arase S, Minai K, et al. Increase in the oxidised low-den- sity lipoprotein level by smoking and the possible inhibitory effect of statin therapy in patients with car- diovascular disease: a retrospective study. BMJ Open. 2015; 5(1):e005455.https://doi.org/10.1136/
bmjopen-2014-005455PMID:25609666
19. Minai K, Ogawa T, Kawai M, Komukai K, Tanaka T, Ogawa K, et al. The Plasma B-Type Natriuretic Peptide Levels Are Low in Males with Stable Ischemic Heart Disease (IHD) Compared to Those Observed in Patients with Non-IHD: A Retrospective Study. PLOS ONE. 2014; 9(10):e108983.https://
doi.org/10.1371/journal.pone.0108983PMID:25360594
20. Lazzeri C, Valente S, Chiostri M, Attana P, Mattesini A, Gensini GF. Acute insulin resistance assessed by the homeostatic model assessment in acute coronary syndromes without previously known diabetes.
Angiology. 2014; 65(6):519–24.https://doi.org/10.1177/0003319713489018PMID:23650645
21. Trifunovic D, Stankovic S, Sobic-Saranovic D, Marinkovic J, Petrovic M, Orlic D, et al. Acute insulin resistance in ST-segment elevation myocardial infarction in non-diabetic patients is associated with incomplete myocardial reperfusion and impaired coronary microcirculatory function. Cardiovasc Diabe- tol. 2014; 13:73.https://doi.org/10.1186/1475-2840-13-73PMID:24708817
22. Riehle C, Abel ED. Insulin Signaling and Heart Failure. Circ Res. 2016; 118(7):1151–69.https://doi.org/
10.1161/CIRCRESAHA.116.306206PMID:27034277
23. Iguchi T, Hasegawa T, Otsuka K, Matsumoto K, Yamazaki T, Nishimura S, et al. Insulin resistance is associated with coronary plaque vulnerability: insight from optical coherence tomography analysis. Eur Heart J Cardiovasc Imaging. 2014; 15(3):284–91.https://doi.org/10.1093/ehjci/jet158PMID:24022065 24. Kim HJ, Han SW. Therapeutic approach to hyperkalemia. Nephron. 2002; 92 Suppl 1:33–40.
25. Yee J, Parasuraman R, Narins RG. Selective review of key perioperative renal-electrolyte disturbances in chronic renal failure patients. Chest. 1999; 115(5 Suppl):149S–57S. PMID:10331349
26. Madias JE, Shah B, Chintalapally G, Chalavarya G, Madias NE. Admission serum potassium in patients with acute myocardial infarction: its correlates and value as a determinant of in-hospital outcome.
Chest. 2000; 118(4):904–13. PMID:11035655
27. Foo K, Sekhri N, Deaner A, Knight C, Suliman A, Ranjadayalan K, et al. Effect of diabetes on serum potassium concentrations in acute coronary syndromes. Heart. 2003; 89(1):31–5. PMID:12482786 28. Caprio M, Newfell BG, la Sala A, Baur W, Fabbri A, Rosano G, et al. Functional mineralocorticoid recep-
tors in human vascular endothelial cells regulate intercellular adhesion molecule-1 expression and pro- mote leukocyte adhesion. Circ Res. 2008; 102(11):1359–67.https://doi.org/10.1161/CIRCRESAHA.
108.174235PMID:18467630
29. Ramratnam M, Sharma RK, D’Auria S, Lee SJ, Wang D, Huang XY, et al. Transgenic Knockdown of Cardiac Sodium/Glucose Cotransporter 1 (SGLT1) Attenuates PRKAG2 Cardiomyopathy, Whereas Transgenic Overexpression of Cardiac SGLT1 Causes Pathologic Hypertrophy and Dysfunction in Mice. J Am Heart Assoc. 2014; 3(4).
30. Dungan KM, Braithwaite SS, Preiser JC. Stress hyperglycaemia. Lancet. 2009; 373(9677):1798–807.
https://doi.org/10.1016/S0140-6736(09)60553-5PMID:19465235
31. van der Horst IC. Acute coronary syndromes: Early metabolic modulation—a solution for MI? Nat Rev Cardiol. 2012; 9(7):377–8.https://doi.org/10.1038/nrcardio.2012.75PMID:22614622
32. Selker HP, Udelson JE, Massaro JM, Ruthazer R, D’Agostino RB, Griffith JL, et al. One-year outcomes of out-of-hospital administration of intravenous glucose, insulin, and potassium (GIK) in patients with suspected acute coronary syndromes (from the IMMEDIATE [Immediate Myocardial Metabolic Enhancement During Initial Assessment and Treatment in Emergency Care] Trial). Am J Cardiol. 2014;
113(10):1599–605.https://doi.org/10.1016/j.amjcard.2014.02.010PMID:24792735