industry in Japan through the evolution of mobile network services : An empirical
analysis.
著者 Ono Shigeru
journal or
publication title
Otsuma journal of social information studies
volume 28
page range 63‑76
year 2019‑12‑30
URL http://id.nii.ac.jp/1114/00006768/
Creative Commons : 表示 ‑ 非営利 ‑ 改変禁止
http://creativecommons.org/licenses/by‑nc‑nd/3.0/deed.ja
1.Introduction
The mobile telecommunications industry has grown at a fairly high rate in the past decades, with advance in technology and service. The mobile telecommunications networks perform multi-sided platforms; for example, subscribers are connected to the networks on one side while content/
application service providers on the other (Ravivio
& Luukkaine, 2011). The platforms are constituted by many interdependent components, and they are dynamic in their nature.
Academic literature has provided various aspects to discuss the evolutional process of the mobile telecommunications industr y, concentrating on economic factors (e.g. Andonova, 2006; Gruber &
Competition dynamics of the mobile network industry in Japan through the evolution of mobile network services:An empirical analysis.
Shigeru Ono*
Abstract
This paper examines how advance in mobile network services influences competition dynamics of the mobile telecommunications industry in Japan, aiming at a better understanding of the mechanism of the evolution of the mobile telecommunications industry. The contribution of the paper is to provide quantitative evidence of interdependence between advance of mobile network services and dynamics of competition of mobile network carries by using panel data over the period of FY2000 - FY2018, during which 3G and 4G mobile wireless technology services were sequentially launched, the iPhone provoked the proliferation of smartphones, and the mobile content/commerce businesses noticeably expanded. This paper shows that the growth of mobile network services heterogeneously influences the business performances, the growth rates of the number of subscribers and ARPU in particular, of the mobile network carries in Japan, and that the causal direction of the influence strongly depends on the market position of the carries.
Moreover, it empirically confirms that the proliferation of smartphones is an important complement to the progress of the mobile commerce market.
Key Words : mobile telecommunications industry, panel data analysis, VAR, wireless mobile technologies, smart phones, multi-sided platforms
*Faculty of Social Information Studies, Otsuma Women’s University
Verboven, 2001; Liikanen, Stoneman, & Toivanen, 2004; Madden, Coble-Neal, & Dalzell, 2004; Massini, 2004), value creation mechanisms (e.g. Li &
Whalley, 2002; Maitland, Bauer, & Wester veld, 2002; Sabat, 2002), regulatory policies (e.g. Casey
& Töyli,2012; Vogelsang, 2017) , and the role of mobile handsets (Ono & Tang, 2010). Although these discussions individually contribute to deep understanding about specialised aspects of the evolutional process, more research especially from a holistic viewpoint is necessary. Co-evolutional approaches (e.g. Lewin & Volberda, 1999; Volberda
& Lewin, 2003) emphasise that an evolutionary process of a constituent system involves mutual interactions among all relevant constituents and suggest that the character of the relative importance of the constituents should vary during its evolution process. Moreover, the literature on industr y evolution has endeavoured to characterise systematically industry dynamics by investigating change of individual firm performances, such as market share and profitability (e.g., Lenox, Scott &
Lewin, 2007). Along the lines of these approaches, this paper takes the Japanese mobile telecommunications industry as a case and quantitatively investigates how the mobile network service evolution, especially caused through the advancement of mobile wireless technologies and mobile handset functions, influences business performances of the mobile network carries.
In the Japanese mobile telecommunications industr y, the evolution of the mobile network services can be classified into four phases: voice- based ser vices, mobile Internet ser vices, high- speed data services, and sophisticated application services specialised for smart-phones. These phase shifts have brought change in the competition structure of the industry and caused turbulence in market shares and profitability of mobile network carries. In Japan, there are three dominant mobile network car riers having dif ferent business
backgrounds: NTT DoCoMo (hereafter DoCoMo), KDDI-au (hereafter KDDI), and Softbank. DoCoMo, a genuine mobile network operator spun off from NTT in 1991, has been the largest in the Japanese market and is renowned for eminent technology in wireless communications as well as the i-Mode. It is the first operator to launch 3G and 4G mobile wireless technology service in the Japanese market while the last to offer the iPhone, the most popular s m a r t p h o n e b r a n d i n J a p a n . K D D I i s a telecommunications operator and provides ISP ser vices. It has been the second largest since formed through the merger of KDD, DDI and IDO in 2000, and was distinguished from the other Japanese mobile network carriers by IS-95 based mobile wireless technology for 2.5G and 3G network ser vices, by which technology KDDI smoothly migrated from 2G to 3G. Softbank is a multinational conglomerate holding company and entered the market with the acquisition of the Japanese division of Vodafone in 2006. Though delayed in launching 3G mobile network service, it garnered attention with introducing the iPhone into the Japanese market for the first time in 2008, which provoked the proliferation of smartphones in the Japanese market. By investigating causal effects of mobile network service advancements over the competition of these three distinctive mobile network carriers, a better understanding of the dynamics of the evolution of the mobile network industry is expected to be achieved.
This paper examines the causal relationships across the growth of mobile network services and the business performances of the three mobile network carriers by using panel data models and vector autoregressive models. The growth of mobile network services should heterogeneously influence the business performances of the three mobile network carriers; i.e., the introduction of some ser vice at a certain time favourably affect one carrier, while unfavourably another. This paper
provides quantitative evidence of the interdependence and an additional perspective for describing that interdependence in terms of multi-sided platform markets (e.g. Rochet, & Tirole, 2006; Royall &
Sorenson, 2007), which are the main contributions of the paper.
This paper proceeds as follows. Section 2 explains the data sources and the variables for estimation.
Section 3 details the estimation results including the estimation methods used in this paper. They are explained in two parts: panel-data models and VAR models. It is followed by discussions of the estimation results with a brief conclusion.
2.Data description and descriptive statistics Due to the limit of the data availability, this paper utilises quarterly or annual data of the time period from FY1995Q4 to FY2018Q4, during which the mobile Internet ser vices based on 2G mobile wireless networks were initiated, 3G/4G mobile wireless technology ser vices were sequentially launched, the sales of smartphones shapely rose, and the mobile content/commerce businesses noticeably expanded. Key variable adopted for the analysis are as follows: the growth rates of the number of subscribers and ARPU of the mobile network carriers, the number of subscribers of 2G/3G/4G mobile network services, the shipment volumes of the feature phone, the smartphone, and the iPhone, and the transaction volume of mobile content/commerce. Real Gross National Income (GNI) is also included as an income index. In addition, two kinds of dummy variables indicating the availability of the iPhone and the 3G/4G mobile service are defined; they take on the value zero for the period before the service is launched and the value one after the service is launched. 3G precedes the iPhone and the iPhone precedes 4G, so that these dummy variables have a proper inclusive relation. The number of subscribers, market shares
and APRUs represent the business performances of mobile network car riers; 2G/3G/4G mobile network services correspond to advances in the mobile wireless technology; the increase of the smar tphone shipment indicates functional improvements of the mobile handsets available in the market; the expansion of the transaction volumes of mobile content/commerce illustrates the development of the mobile network applications and services. These variables, therefore, cover main constituents for capturing the evolution of the mobile telecommunications industr y in Japan (Krafft, 2003).
Table 1 provides a summary of the variables and their statistics. All variables except for the dummies are represented in natural logarithms. The statistics of ARPU are calculated on a quarterly basis from FY2000Q4 to FY2018Q4. Some figures of quarterly ARPUs are not available in public, so that they are smoothly interpolated with the annual data. The statistics for the mobile handsets and the mobile content/commerce services are calculated on an annual basis from FY2001 to FY2018.
3. Estimation methods and results of estimation
3.1 Panel data analysis
For dealing with the heterogeneity of the mobile network carriers, this paper first conducts a panel data analysis. Table 2 shows the results of the pairwise Dumitrescu-Hurlin panel causality test applied to the quar terly panel data, where DLNSUBS, LNARPUR and DLNGNI correspond to the growth rates of the number of subscribers, ARPU, and the real GNI, respectively. DIPH is a dummy variable indicating the availability of the iPhones. The causality direction is not symmetric;
DLNSUB is correlated with the introduction of 3G mobile wireless ser vice, while LNARPUR is strongly correlated with the launch of the iPhone.
Table1 Summary of statistics for variables
Quarterly Mean Max Min. Std. Dev. Obs.
LNSUB_ (number of subscribers)/ LNSUBS (pooled/panel data)
DoCoMo 17.59206 18.17801 15.41186 0.585071 93
KDDI 16.99313 17.82693 15.22528 0.613298 93
Softbank 16.59537 17.54567 13.97508 0.829395 93
LNARPUR (growth rate of ARPU)
DoCoMo -0.00921 0.052041 -0.07791 0.021907 76
KDDI -0.00941 0.031499 -0.09471 0.022326 76
Softbank -0.00912 0.097878 -0.08976 0.033849 76
LNWRG (3G+4G)
DoCoMo 16.93026 18.17801 10.20359 1.945556 70
KDDI 17.12784 17.82693 13.9564 0.703969 68
Softbank 16.02454 17.54567 7.090077 2.226847 66
DIPH (dummy variable for the iPhone)
DoCoMo 0.236559 1 0 0.427273 93
KDDI 0.322581 1 0 0.469997 93
Softbank 0.462366 1 0 0.501284 93
DW3G_ (dummy variable for 3G)/ DWCDMA (pooled/panel data)
DoCoMo 0.752688 1 0 0.433788 93
KDDI 0.731183 1 0 0.445748 93
Softbank 0.709677 1 0 0.456371 93
DW4G_ (dummy variable for 4G)/ DLTE (pooled/panel data)
DoCoMo 0.365591 1 0 0.484206 93
KDDI 0.27957 1 0 0.45122 93
Softbank 0.27957 1 0 0.45122 93
LNGNI (real GNI)
1.389618 1.49325 1.318856 0.048404 93
Annual Mean Max Min. Std. Dev. Obs.
LNHAND (mobile handset)
8.21861 8.518992 6.979145 0.317797 24
LNSMART (smartphone)
6.980273 8.088869 3.044522 1.631631 12
LNIPH (iPone)
6.601322 7.393878 4.110874 1.080923 11
LNCONT (mobile contents)
8.587528 10.01059 6.175867 1.016831 19
LNCMRC (mobile commerce)
8.807116 10.59516 4.691348 1.538835 19
Table 2 Pairwise Dumitrescu-Hurlin Panel Causality Tests Independent
variables lag=1 lag=2 lag=4
DLNSUBS LNARPUR DLNSUBS LNARPUR DLNSUBS LNARPUR
DLNSUBS
LNARPUR 0.0027** 0.0277*
DLNGNI
DWCDMA 0.0368* 0.0025** 0.0154*
DLTE 0.000** 0.000** 0.0398**
DIPH 0.000** 0.000** 0.0000**
This suggests that there would be regime changes in the growth rates of the number of subscribers and ARPUs; the regime change of the former corresponds with the progress of the wireless mobile technology and that of the later with the expansion of smart phones, typically the iPhones.
Table 3 reports the estimation results of the fixed-effects and the dynamic panel data models, in which DLSNSUB is the dependent variable and the rest of the variables are the independent variables.
Since the panel data studied in the paper have long time series for a small number of the cross sections, only the results of the fixed-effects estimation, together with those of pooled estimation as a reference, are listed. DLNSUBS is a seasonal variable, so that the quarterly dummy variables are also included into the estimation. Under the null hypothesis that there is no cross-section dependence in residuals, Pesaran scaled LM and Bias-corrected scaled LM tests indicate no significance, though Breusch-Pagan LM is significant at 10% level.
Combined this result with the statistics of the F-test, the estimation of the fixed-estimation is considered as reliable. The Wald-coefficient restriction test, however, shows a strong AR(1) correlation in the residual, so that the dynamic panel data model is more suitable. Nevertheless, the results shown in Table 3 is consistent in that while the advance wireless mobile technology negatively affects the growth rates of the number of subscribers for the three mobile network carries, the launch of the iPhone positively does. These results illustrate the fact that the evolution of the wireless mobile ser vices strongly depends on not only the advancement of the wireless mobile technologies but also the that of the mobile handset functions.
The former intensifies the competition between the mobile network carriers, and the later contributes to the development of the whole market.
Table 4 shows the estimation results of the fixed- effect and the dynamic panel data analysis for the
case that LNARPUR is the independent variable.
LNARPUR is also a seasonal variable, so that the quarterly dummy variables are included into the estimation. The F-test does not reject the null hypothesis of no fixed-effects between the mobile network carries, and thus the pooled estimates are convincing. LNARPUR positively correlates with GNI as well as DIPH, which are consistent among the estimation models. Since ARPU reflects the retail price of mobile ser vices, this result is reasonable.
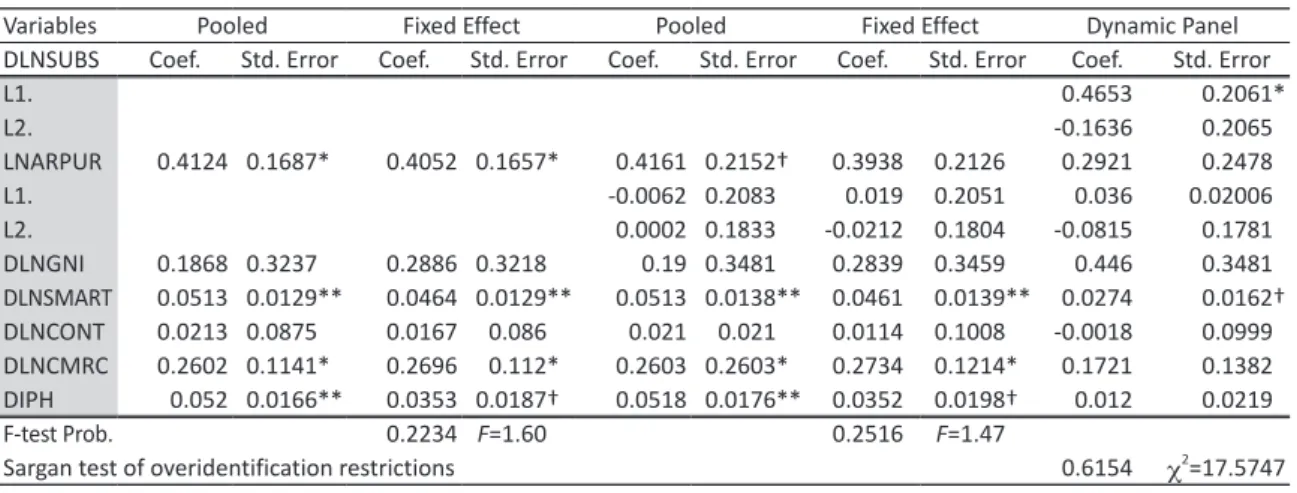
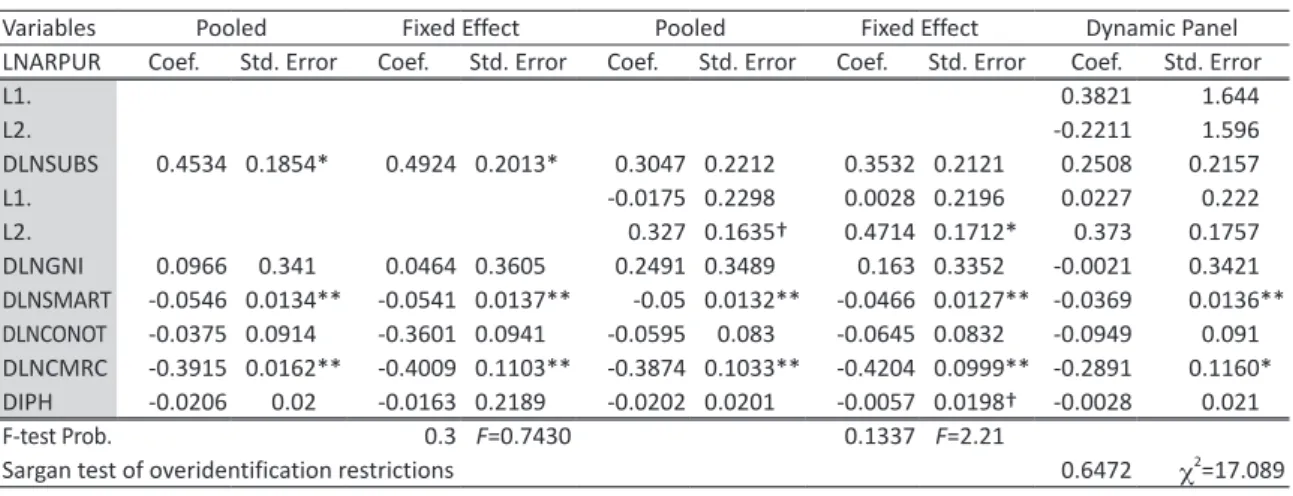
Table 5 and Table 6 are the results of the estimation based on the annual panel data, where DLNSMART, DLNCONT, DLNCMRC are the growth rates of the shipment volume of the smart phones, the market size of the mobile content, and the market size of the mobile commerce, respectively.
DNLCONT and DLNCMRC are proxy variables representing the development of the upper-layer mobile network services. DLNSMART, on the other hand, reflects the advancement of the mobile handset functions. The upper-layer network ser vices and the mobile handset functions are complementar y in the evolution of the mobile telecommunications ser vices; without the emergence and proliferation of the mobile handsets with highly computational capabilities, attractive and sophisticated mobile network services are not diffused into the market.
The results of Table 5 and Table 6 show that DLSMART is positively correlated with DLSUB, but negatively with LNARPU. DLNCMRC is also negatively correlated with LNARPU. These results indicate that as the smartphones spread into the market, the performance of ARPU is unfavourable for the carries, but the expansion of advanced mobile handsets drives the growth of the market.
The Granger-causality test shows that DLNSMART and DLNCMRC have mutual Granger causality, 3.2 VAR (Vector Auto-Regressive) analysis
Table 3 Estimation results of panel data analysis in the case that DLNSUBS is the dependent variable.
Variables Pooled Fixed Effect Pooled Fixed Effect Dynamic Panel
DLNSUBS Coef. Std. Error Coef. Std. Error Coef. Std. Error Coef. Std. Error Coef. Std. Error
L1. 0.5700 0.0393**
L2. 0.1426 0.0372**
LNARPUR 0.0039 0.0375** 0.0091* 0.0373** 0.0143 0.037** 0.0210* 0.0367** 0.0205 0.0091**
L1. 0.0408 0.0361** 0.0456* 0.0356** 0.0279 0.0157†*
L2. 0.0283 0.0354** 0.0309* 0.0350** 0.0055 0.0090**
DLNGNI 0.0167 0.0798** 0.0548* 0.0792** 0.0400 0.0786** 0.0299* 0.0776** 0.0451 0.0403**
DWCDMA -0.0222 0.0026** -0.0215* 0.0026** -0.0197 0.0029** -0.0186* 0.0029** -0.0032 0.0010**
DLTE -0.0113 0.0022** -0.0093* 0.0023** -0.0012 0.0022** -0.0095* 0.0022** -0.0029 0.0012**
DIPH 0.0086 0.0022** 0.0063* 0.0024** 0.0081 0.0022** 0.0053* 0.0023** 0.0013 0.0004**
F-test Prob. 0.063† F=2.79** 0.015* F=4.29**
Sargan test of overidentification restrictions 0.571 c2=202.711
†Significance at 10% level, *Significance at 5% level, **Significance at 1% level
Table 4 Estimation results of panel data analysis in the case that LNARPUR is the dependent variable.
Variables Pooled Fixed Effect Pooled Fixed Effect Dynamic Panel
LNARPUR Coef. Std. Error Coef. Std. Error Coef. Std. Error Coef. Std. Error Coef. Std. Error
L1. -0.145 0.0671†*
L2. 0.0389 0.0664**
DLNSUBS 0.0128 0.1216** 0.0301 0.1234** 0.0912 0.1737** 0.0997 0.1744** 0.1401 0.1821**
L1. -0.2905 0.1990** -0.2839 0.1994** -0.2673 0.2039**
L2. 0.2297 0.1724** 0.2372 0.1728** 0.2111 0.1742**
DLNGNI 0.5495 0.1390** 0.5512 0.1392** 0.5512 0.1393** 0.5537 0.1395** 0.6216 0.1407**
DWCDMA -0.0099 0.0054†* -0.0101 0.0054†* -0.009 0.0058** -0.0091 0.0059** -0.0157 0.0063**
DLTE 0.0033 0.0042** 0.0020 0.0044** 0.0036 0.0042** 0.0023 0.0044** 0.0027 0.0045**
DIPH 0.0106 0.0040** 0.1239 0.0038** 0.0104 0.0041** 0.0121 0.0044** 0.1334 0.0044**
Fixed Effect F-test Prob. 0.5082 F=0.58** 0.6800 F=0.5062
Sargan test of overidentification restrictions 0.5154 c2=205.5484
†Significance at 10% level, *Significance at 5% level, **Significance at 1% level
Table 5 Estimation results of panel data analysis in the case that DLNSUBS is the dependent variable.
Variables Pooled Fixed Effect Pooled Fixed Effect Dynamic Panel
DLNSUBS Coef. Std. Error Coef. Std. Error Coef. Std. Error Coef. Std. Error Coef. Std. Error
L1. 0.4653 0.2061*
L2. -0.1636 0.2065*
LNARPUR 0.4124 0.1687** 0.4052 0.1657** 0.4161 0.2152†* 0.3938 0.2126** 0.2921 0.2478*
L1. -0.0062 0.2083** 0.019 0.2051** 0.036 0.02006*
L2. 0.0002 0.1833** -0.0212 0.1804** -0.0815 0.1781*
DLNGNI 0.1868 0.3237** 0.2886 0.3218** 0.19 0.3481** 0.2839 0.3459** 0.446 0.3481*
DLNSMART 0.0513 0.0129** 0.0464 0.0129** 0.0513 0.0138** 0.0461 0.0139** 0.0274 0.0162†
DLNCONT 0.0213 0.0875** 0.0167 0.086** 0.021 0.021** 0.0114 0.1008** -0.0018 0.0999*
DLNCMRC 0.2602 0.1141** 0.2696 0.112** 0.2603 0.2603** 0.2734 0.1214** 0.1721 0.1382*
DIPH 0.052 0.0166** 0.0353 0.0187†* 0.0518 0.0176** 0.0352 0.0198†* 0.012 0.0219*
F-test Prob. 0.2234 F=1.60** 0.2516 F=1.47**
Sargan test of overidentification restrictions 0.6154 c2=17.5747
†Significance at 10% level, *Significance at 5% level, **Significance at 1% level
To evaluate the causal direction among the variables and estimate the impacts of the launch of 3G/4G and the proliferation of the smartphones, especially the iPhones, on the business performances of the mobile network carries, VAR analysis is conducted. VAR model entails the following steps: a unit root test is per for med to identity the stationarity of time series variables; then VAR models are constructed to ascertain the direction of causality between the variables and evaluate the effects of unit shocks in the variables.
DLNSUB and LNARPUR are seasonal variables, so that a seasonal unit root test is adopted. Table 7 shows the results of Taylor Variance Ratio test for stationary on DLNSUB and LNAPUR. The results reject the null hypothesis of non-stationarity at the significance level of 5%, so that a cointegrate test on DLNSUB and LNARPUR is not conducted. The following paragraphs present the results of VAR analysis.
Table 8 shows the results of the pairwise Granger causality tests. DLNSUB of KDDI noticeably depends on the other variables. Since KDDI has been ranked second of the three carriers, it would be subject to changes of the market environments.
The Granger causality relationships between
LNARPURs and DIPHs of DoCoMo and KDDI are bidirectional, while DIPH of Softbank has no- significant relationship to LNARPURs of the other carriers. DIPH of Softbank is strongly correlated with DLNWRG, the growth rate of 3G/4G services.
In short, the launch of the iPhone by Softbank strongly coordinates with the demand of advanced wireless telecommunications technologies, but it has less effect on the fiscal performances of the other carries.
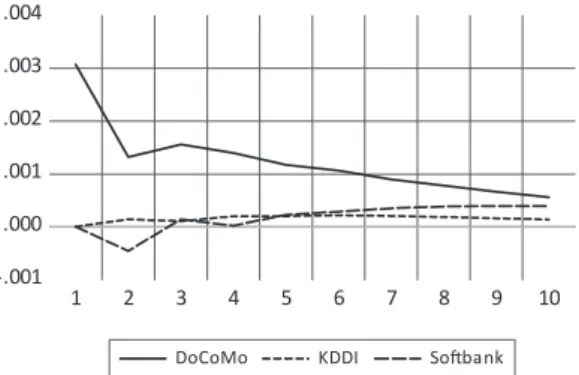
Figure 1 depicts the impulse responses of DLNSUBs in the case when a one standard deviation shock occurred in the growth rate of the number of subscribers. It can be seen in the figure that there are unidirectional causal effects among DLNSUBs;
DLNSUBs of DoCoMo and Softbank receive less impacts from the DLNSUB shocks of the other network carries than from their own shocks, but DLNSUB of KDDI does more impact from the DLNSUB shocks of the other carriers than from its own DNLSUB shock; besides, DLNSUB of DoCoMo has a positive correlation with that of KDDI but negative one with DLNSUB of Softbank.
These features are consistent with the results of the Granger causality test.
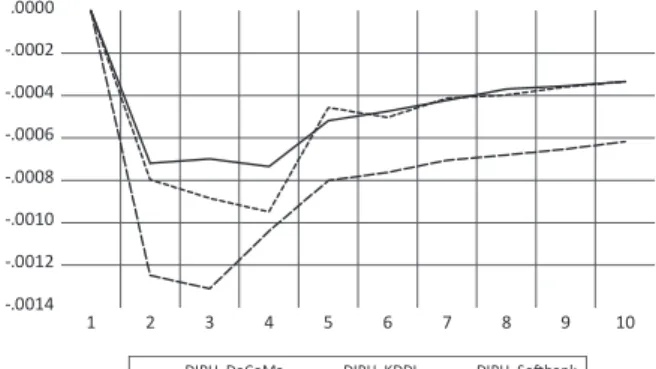
Figure 2 shows the impulse responses of Table 6 Estimation results of panel data analysis in the case that LNARPUR is the dependent variable.
Variables Pooled Fixed Effect Pooled Fixed Effect Dynamic Panel
LNARPUR Coef. Std. Error Coef. Std. Error Coef. Std. Error Coef. Std. Error Coef. Std. Error
L1. 0.3821 1.644**
L2. -0.2211 1.596**
DLNSUBS 0.4534 0.1854** 0.4924 0.2013** 0.3047 0.2212** 0.3532 0.2121** 0.2508 0.2157**
L1. -0.0175 0.2298** 0.0028 0.2196** 0.0227 0.222**
L2. 0.327 0.1635†* 0.4714 0.1712** 0.373 0.1757**
DLNGNI 0.0966 0.341** 0.0464 0.3605** 0.2491 0.3489** 0.163 0.3352** -0.0021 0.3421**
DLNSMART -0.0546 0.0134** -0.0541 0.0137** -0.05 0.0132** -0.0466 0.0127** -0.0369 0.0136**
DLNCONOT -0.0375 0.0914** -0.3601 0.0941** -0.0595 0.083** -0.0645 0.0832** -0.0949 0.091**
DLNCMRC -0.3915 0.0162** -0.4009 0.1103** -0.3874 0.1033** -0.4204 0.0999** -0.2891 0.1160**
DIPH -0.0206 0.02** -0.0163 0.2189** -0.0202 0.0201** -0.0057 0.0198†* -0.0028 0.021**
F-test Prob. 0.3 F=0.7430 0.1337 F=2.21**
Sargan test of overidentification restrictions 0.6472 c2=17.089
† Significance at 10% level, *Significance at 5% level, **Significance at 1% level
Table 8 Results from the pairwise Granger causality tests Dependent Vars.
Independent Vars. DLNSUB_ LNARPUR_ DNLWRG
DoCoMo KDDI Softbank DoCoMo KDDI Softbank DoCoMo KDDI Softbank
DLNSUB_ DoCoMo (†,**,*) (**,*,*) (-,†,-) (†,*,-) (-,*,**)
KDDI (**,**,-) (*,**,-) (-,-,†) (**,-,-) (-,†,**) (**,*,**)
Softbank (**,**,-) (-,*,*) (*.†,-)
LNARPUR_ DoCoMo (-,†,*) (-,-,*) (-,-,**)
KDDI (*,*,*) (-,*,**) (-,*,**) (*,**,**) (*,*,**)
Softbank (†,-,-) (-,*,**) (-,-,**) (-,†,**)
DLNWRG_ DoCoMo (†,-,-) (**,**,*) (*,**,**) (**,**,**)
KDDI (*,*,**) (**,**,**) (*,-,**)
Softbank (-,-,*) (**,**,**) (**,-,†)
DW3G_ DoCoMo (-,-,**) (*,**,-) (**,†,†)
KDDI (-,*,-) (*,†,†) (**,**,-)
Softbank (-,*,-) (**,-,†) (**,-,-)
DW4G_ DoCoMo (†,**,-) (-,**,*) (**,*,-)
KDDI (†, -,*) (*,**,**) (**,-,-)
Softbank (†,-,*) (*,**,**) (**,-,-) (*,-,-)
DIPH_ DoCoMo (*,**,*) (*,**,-) (**,-,-)
KDDI (*,*,-) (*,*,**) (**,-,-) (**,-,-)
Softbank (-,†,-) (-,-,**) (**,-,-) (**,*,-) (**,**,-)
DLNGNI
(lag=1, lag=2, lag=4)
− No siginificance, † Significance at 10% level, *Significance at 5% level, **Significance at 1% level Table 7 Results from the Taylor variance ratio test (seasonal unit root test)
variables VR Stat. 1% 5% 10%
DLNSUB_ DoCoMo 0.005351 ** 0.01184 0.01864 0.02442
KDDI 0.010682 ** 0.01184 0.01864 0.02442
Softbank 0.005053 ** 0.01184 0.01864 0.02442 LNARPUR_ DoCoMo 0.013083 * 0.01184 0.01864 0.02442
KDDI 0.012351 * 0.01184 0.01864 0.02442
Softbank 0.014134 * 0.01184 0.01864 0.02442
DLNSUBs to one standard deviation shocks of DIPHs. DLNSUB of DoCoMo positively reacts to DIPH shock of its own, but DLNSUBs of the other carriers negatively react to DIPH shock of their own. In addition, DLNSUB of KDDI receives strong negative impacts from DIPH shock of Softbank, and DLNSUB of Softbank does negative long-run effects
from DIPH shocks of DoCoMo and KDDI. This result indicates that the market leader, DoCoMo, is hardly affected by the other carriers’ activities, but the rest of competitors are rather fragile; they influence each other.
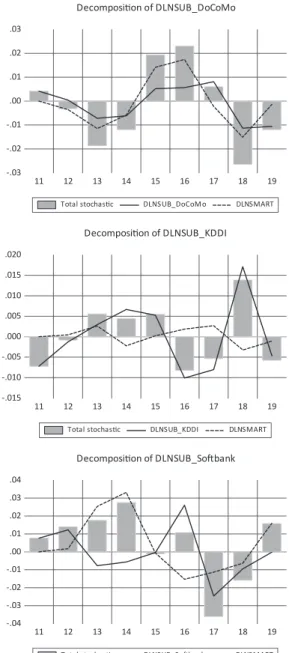
Figure 3 and Figure 4 present the historical decomposition of DSLUBs to the contribution of the -.001
.000 .001 .002 .003 .004
1 2 3 4 5 6 7 8 9 10
DoCoMo KDDI Softbank
Response of DLNSUB_DoCoMo to DLNSUB_Innovations
-.002 .000 .002 .004 .006 .008
1 2 3 4 5 6 7 8 9 10
DoCoMo KDDI Softbank
Response of DLNSUB_KDDI to DLNSUB_ Innovations
-.004 .000 .004 .008 .012 .016
1 2 3 4 5 6 7 8 9 10
DoCoMo KDDI Softbank
Response of DLNSUB_Softbank to DLNSUB_Innovations
Figure 1 Response of DNLSUBs to non-factorised one standard deviation innovations.
shocks of DNLSMART and DLNCMRC. In these figures, asymmetric causal relationships between DNLSMART/DLNCMRC and DLSUBs of the three n e t w o r k c a r r i e s a r e a l s o o b s e r v e d . T h e DLNSMAR T shock gives a positive impact on DSLSUB of DoCoMo over the estimation period, but does negative impacts on DLNSUBs of KDDI and Softbank. Moreover, the DLNMRC shock gives a positive impact on DLNSUB of DoCoMo after 2014, while it does a partially fluctuating impact on DLNSUB of KDDI and a fractional impact on DLSNSUB of Softbank.
The above results indicate that DLNSUBs of the three mobile network carries are asymmetrically influenced to some extent by the growth rate of the number of subscribers of the other carriers, the launch of the iPhones, the grow rate of the shipment volume of the smartphones, and the
market size of the mobile commerce, and that the extent of the influence which a network carrier receives depends on the market position of the network carrier; DLNSUB of the leader carrier receives positive or small impacts while DLNSUB of the intermediates do fluctuating impacts.
4. Discussion and Conclusion
A summary of the estimation results is as follows:
(1) DoCoMo, the largest carrier, has remained its market position as the market has developed through the advance in the mobile wireless technologies, the expansion of the mobile content and commerce markets, and the proliferation of the high functioning mobile handsets; (2) the growth rates of the number of subscribers and ARPU of DoCoMo has been coordinated with those of the
-.0008 -.0006 -.0004 -.0002 .0000 .0002 .0004 .0006
1 2 3 4 5 6 7 8 9 10
DIPH_DoCoMo DIPH_KDDI DIPH_Softbank
-.0014 -.0012 -.0010 -.0008 -.0006 -.0004 -.0002 .0000
1 2 3 4 5 6 7 8 9 10
DIPH_DoCoMo DIPH_KDDI DIPH_Softbank Responses of DLNSUB_DoCoMo to DIPH_ innovation Responses of DLNSUB_KDDI to DIPH_ innovation
-.0015 -.0010 -.0005 .0000 .0005 .0010 .0015
1 2 3 4 5 6 7 8 9 10
DIPH_DoCoMo DIPH_KDDI DIPH_Softbank
Responses of DLNSUB_Softbank to DIPH_ innovation
Figure 2 Impulse responses of DNLSUBs to non-factorised one standard deviation innovations.
whole market. DoCoMo has been less influenced than the other carriers by the changes of the market environments; (3) KDDI, the second largest carrier, has been largely affected on its business per formances with the progress of both the wireless technologies and the smartphones; (4) Softbank, the third largest carrier, provoked the
diffusion of the smartphones by introducing the iPhone and induced the structure changes of the market, but it did not improve its market position;
(5) the first release of the iPhone by Softbank significantly Granger causes the growth rate of the number of subscribers of 3G/4G, ; (6) the progress of the smar tphones has been an impor tant
-.03 -.02 -.01 .00 .01 .02 .03
11 12 13 14 15 16 17 18 19
Total stochastic DLNSUB_DoCoMo DLNSMART
Decomposition of DLNSUB_DoCoMo
-.015 -.010 -.005 .000 .005 .010 .015 .020
11 12 13 14 15 16 17 18 19
Total stochastic DLNSUB_KDDI DLNSMART
Decomposition of DLNSUB_KDDI
-.04 -.03 -.02 -.01 .00 .01 .02 .03 .04
11 12 13 14 15 16 17 18 19
Total stochastic DLNSUB_Softbank DLNSMART
Decomposition of DLNSUB_Softbank
Figure 3 Historical Decomposition using Cholesky (d.f. adjusted) Weights
complement to that of the mobile commerce market.
The first and second results are par tially consistent with the phenomenon observed in the European mobile telecommunications industr y, where the incumbent remained the largest operator in the transition period from 2G to 3G. While in the European countries the incumbents defended their
market standing through delaying their own migration to 3G (Walley & Curwen, 2012), DoCoMo kept its position in the transition period from 2G to 3G with initiating the migration ahead of its competitors. The dominant market share over 45%
and the abundant constant R&D investment on mobile wireless technologies could explain the reason why DoCoMo has continued to be the
-.03 -.02 -.01 .00 .01 .02 .03
2004 2006 2008 2010 2012 2014 2016 2018
Total stochastic DNLSUB_DoCoMo DLNCMRC
Decomposition of DLNSUB_DoCoMo
-.05 -.04 -.03 -.02 -.01 .00 .01 .02 .03 .04
2004 2006 2008 2010 2012 2014 2016 2018
Total stochastic DLNSUB_KDDI DLNCMRC
Decomposition of DLNSUB_KDDI
-.100 -.075 -.050 -.025 .000 .025 .050 .075 .100
2004 2006 2008 2010 2012 2014 2016 2018
Total stochastic DLNSUB_Softbank DLNCMRC
Decomposition of DLNSUB_Softbank
Figure 4 Historical Decomposition using Cholesky (d.f. adjusted) Weights
largest and has not received negative impacts through the industr y evolution. The third and fourth results show that that the evolution of the market provides asymmetric influences on the carriers; the release of the iPhone by Softbank negatively affected KDDI’s performances in short r un, but it did not in long r un, and also was unilateral; the release of the iPhone by KDDI did not significantly affect Softbank’s performances.
The release of the iPhone by DoCoMo negatively affected Softbank’s performances, but did not KDDI’s. Moreover, the expansion of 3G worked more favourably for KDDI with compared to Softbank. The fifth and sixth results accords with the findings of the research on the role of mobile handsets in the mobile network evolution (Ono &
Tang, 2010). The mobile handsets have functions terminating the mobile network services, so that the progress of the handsets is indispensable for the proliferation of advanced and sophisticate mobile network services.
From the viewpoint of the platform competition theor y (Just, 2018; Zhu & Iansiti, 2012), the competition among the three mobile network carriers for the target period of this study can be explained based on three views of installed base, indirect network effects, and consumers’ discount factor of future applications. Reviewing the estimation summar y, it is concluded that the competition among the three carriers is driven by installed base with the moderate strength of indirect network effects. Incumbents, therefore, are likely to dominate the markets, and their leadership positions with first-move advantages is difficult to dislodge. Since the mobile wireless technologies are du jure standardised, consumers’ discount factor of the future wireless technologies is small, and the market dynamics are scarcely driven by the network quality.
On the other hand, consumer’s discount factor would be valid for mobile network services offered
through the mobile handsets; applications with a small quality advantage could achieve larger market shares due to indirect network effects and forward- looking behaviour of consumers. The impacts of the iPhones and the smartphones on the financial performances of the mobile network carriers could be caused by quality driven competition among platforms offered by the mobile network carriers and the mobile handset vendors. Before the iPhones and the smartphones are released in the market, the mobile network carriers had dominant market power over the mobile handset vendors.
However, as the functional capabilities of mobile handsets progress, their market power would be weakened. The investigation behind these mechanisms is left for future research.
References:
Andonova, V. (2006). Mobile phones, the Internet and the institutional environment. Telecommunications Policy, 30, 29-45.
Casey, T. R. & Töyli, J. (2012). Mobile voice diffusion and service competition: A system dynamic analysis of regulatory policy, Telecommunications Policy, 36, 162-174.
Gruber, H. & Verboven, F. (2001). The evolution of markets under entry and standards regulation – the case of global mobile telecommunications.
International Journal of Industrial Organization, 19, 1189-1212.
Just, N. (2018). Governing online platforms:
Competition policy in the times of platformization, Telecommunications Policy, 42, 386-394/
Krafft, J. (2003). Vertical structure of the industry and competition: an analysis of the evolution of the info- communications industry. Telecommunications Policy, vol.27, pp.625-649.
Lenox, M. J., Rockar t, S. F. & Lewin. (2007).
Interdependency, Competition, and Industry
Dynamics. Management Science, 53(4), 599- 615.
Li, F. ,& Whalley, J. (2002). Deconstruction of the telecommunications industr y: from value chains to value networks. Telecommunications Policy, 26, 451-472.
Liikanen, J., Stoneman, P., & Toivanen, O. (2004).
Intergenerational effects in the diffusion of new technology: the case of mobile phones.
International Journal of Industrial Organization, 22, 137-1154.
Lewin, A. Y. & Volberda, H.W. (1999). Prolegomena on coevolution: A framework for research on strategy and new organizational forms.
Organization Science, 10(5), 519-534.
Madden, G., Coble-Neal, G., & Dalzell, B. (2004).
A dynamic model of mobile telephony subscription incorporating a network effect.
Telecommunications Policy, 28, 133-144.
Maitland, C., Bauer, J. M., & Westerveld, R. (2002).
The European market for mobile data: evolving value chains and industrial str ucture.
Telecommunications Policy, 26, 485-504.
Massini, S. (2004). The dif fusion of mobile telephony in Italy and the UK: An empirical investigation. Economics of Innovation and New Technology, 13(3), 251-277.
Ono, S & Tang, P. (2010). The role of mobile handsets in advanced network service evolution:
evidence from Japan. Telecommunications Policy, 34, 440-460.
Raivio, Y & Luukkainen, S. (2011). Mobile Networks as a Two-Sided Platform: Case Open Telco, Journal of Theoretical and Applied Electronic Commerce Research, 6(2), 77-89.
Rochet, J-C. & Tirole, J. (2006). Two-sided markets:
a progress report. RAND Journal Economics, 37, 645-667.
Royall, M. D. & Sorenson, O. (2007). Brokers and competitive advantage. Management Science, 53, 266-583.
Sabat, H. K. (2002). The evolving mobile wireless v a l u e c h a i n a n d m a r k e t s t r u c t u r e . Telecommunications Policy, 26, 505-535.
Vogelsang, I. (2017). The role of competition and r e g u l a t i o n i n s t i m u l a t i n g i n n o v a t i o n - Telecommunications, Telecommunications Policy, 41, 800-812.
Volberda, H.W. & Lewin, A. Y. (2003). Co- evolutionar y dynamics within and between firms: From evolution and co-evolution. Journal of Management Studies, 40(8), 2111-2136.
Whalley, J. & Curwen, P. (2012). Incumbency and market share within European mobile telecommunication networks, Telecommunications Policy, 36, 222-236.
Zhu, F. & Iansiti, M. (2012). Entry Platform-based Markets, Strategic Management Journal, 33(1), 88-106.