Raman Spectroscopic Thermometer for Carbonaceous Material in Chondrites.
Y. Homma1, Y. Kouketsu2, H. Kagi3, T. Mikouchi1, and H. Yabuta4
1 Dept. of Earth & Planet. Sci., Univ. Tokyo, 2Dept. of Earth & Planet. Sci., Nagoya Univ., 3 Geochemical Research Center, Univ.
Tokyo, 4Dept. of Earth & Space Sci., Osaka Univ.
Introduction
Carbonaceous materials are commonly found in both terrestrial metasediments and primitive meteorites. Since their structure changes irreversibly by thermal metamorphism, it is useful to estimate thermal history of host rocks. Therefore, various studies on carbonaceous materials have been reported so far. Raman spectroscopy is a promising method to investigate the structure of carbonaceous materials, because of in-situ, non-destructive analysis.
Experiments to invent geothermometer using Raman spectra of carbonaceous materials were reported for both on terrestrial metasediments and chondrites. For terrestrial metasediments, the Raman thermometer was successfully developed by decomposing obtained Raman spectra into at most five band components [1]. As a result, the applicable temperature range was extended to 150-655 °C. On the other hand, the temperature range of a Raman geothermometer on chondrites were reported as ~200 °C - ~700 °C [2]. In contrast to the thermometer on terrestrial samples, the thermometer on chondrites are based on peak fitting of Raman spectra into only two band components. For low metamorphic carbonaceous materials, it is indicated that at least three band components are needed to analyze the Raman spectra, because of their complexity [3]. In this research, we try to improve the Raman thermometer on carbonaceous material in chondrite by applying the detailed data analysis method recently reported for terrestrial metasediments [1].
Sample and methods
Twenty samples were chosen for Raman measurements from carbonaceous chondrites, ordinary chondrites, and R chondrites. From each samples, Raman spectra of carbonaceous materials were obtained with micro-Raman spectrometer in GCRC, the University of Tokyo. Raman spectra of meteorites samples were obtained on a chip or thin section. A 514.5 nm Ar ion laser for excitation was focused on a sample with a diameter of 2 m, and laser power was controlled in the range of 1.0-2.5 mW at the sample surface.
Acquisition time was 10-30 s. At least 30 data sets were acquired for most of the samples.
After subtracting a fluorescence background as a linear baseline, the obtained Raman spectra were fitted by four pseudo-Voight functions in the region from 1000 cm-1 to 2000 cm-1. The used band components are GL (~1600 cm-1), D1 (~1350 cm-1), D3 (1510 cm-1), and D4 (1245 cm-1) bands.
Figure 2: Representative result of peak fitting on Raman spectra of carbonaceous materials in Efremovka. Peak position of D3 and D4 bands are fixed at 1510 cm-1 and 1245 cm-1.
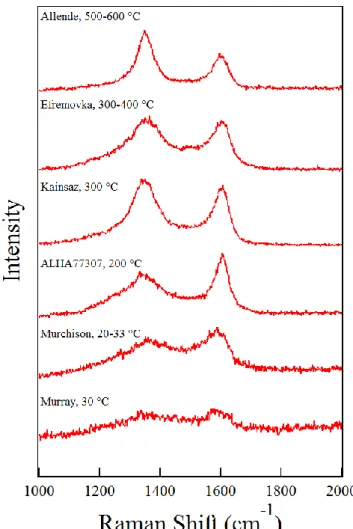
Figure 1: Representative Raman spectra of carbonaceous materials in meteorites whose PMT was reported in [4] and [5].
Band parameters which deviated from the 2 were excluded from the average value.
Results and Discussion
Four-peak spectral fitting was performed on each sample.
Figure 1 shows representative Raman spectra of meteorite samples whose peak metamorphic temperature (PMT) were reported. Figure 2 shows a representative result of peak fitting of Efremovka. For all spectra, intensity (I), peak position (), and full width at half maximum () were obtained from the peak fitting procedure as shown in Figure 2.
The relationship between D1 and ID1/IGL showed that the value ofD1 has the lowest limit (data not shown). The lowest limit of D1 were set at ~65 cm-1.
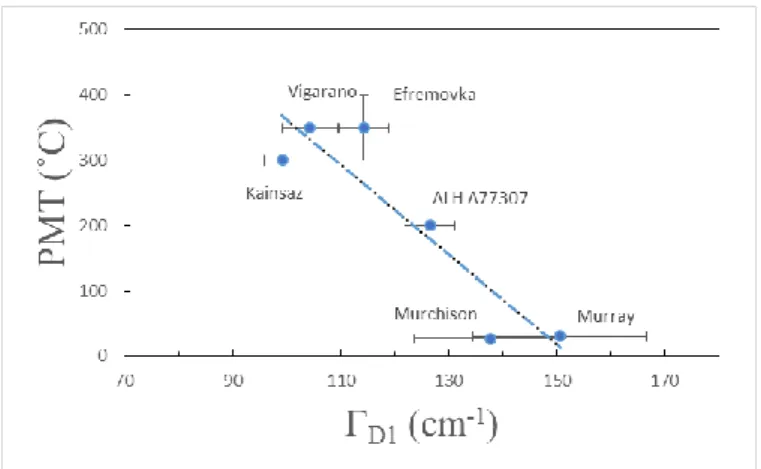
Figure 2 shows plots of D1 versus PMT. A calibration line was obtained from six samples whose PMT were already estimated previously [4] [5]. The relationship was expressed as follows:
PMT (°C) = -6.9 × D1 (cm-1) + 1054.4 (R2 = 0.83) The applicable range of the thermometer is 0 °C to 586 °C.
In this study, it became clear that band separation of D1 from D3 and D4 bands is important in the lower PMT region, since the contribution of D3 and D4 bands to D1 band is not negligible.
Compared to the thermometer on carbonaceous materials in terrestrial metasediments [1], the present thermometer on meteoritic samples shows a steeper inclination. This may reflect the difference in graphitization environment between terrestrial samples and meteorite samples. This study will be published elsewhere [6].
References
[1] Kouketsu et al. (2014) Island Arc, 23, 33-50. [2]
Busemann et al. (2007) MAPS, 42, 1387-1416. [3] Quirico et al. (2009) EPSL, 287, 185-193. [4] Huss et al. (2006) Meteorites and the Early Solar System II, The Univ. of Arizona Press, 567-586. [5] Guo and Eiler (2007) GCA, 71, 5565-5575. [6] Homma et al. (2015) JMPS, under revision.
Figure 3: Plots of D1 versus PMT of six chondrite samples.
PMT and of each samples are values reported in [4] and [5].
Standard errors of the horizontal axis are 1 of gained data, and those of vertical axis are from the literatures.